> ## Documentation Index
> Fetch the complete documentation index at: https://langwatch.ai/docs/llms.txt
> Use this file to discover all available pages before exploring further.
# Track your Claude Code usage
> See what you spend per session, which models you hit, how many tokens are cached, and the full prompt + response trail. Two paths, depending on whether you pay Anthropic per token or on a Claude Max / Pro plan.
The Anthropic Console gives you a monthly total, but nothing about which prompt cost what, which model handled which turn, how many tokens came from the prompt cache vs fresh, or what the assistant actually said in long agentic runs. Without that, you can't debug your own agent.
This guide wires Claude Code up so all of that lands on LangWatch, where you can browse:
* Cost per session and per turn
* Model used per turn, including subagents
* Cache writes vs cache reads (cached prompts are 10x cheaper, so you can adjust your setup to maximize it)
* Full prompt body
* Trace tree of tool calls, latencies, and durations
* **Have your agent automatically self-improve by inspecting its own traces, via [LangWatch skills](https://langwatch.ai/docs/skills/directory) or [MCP](https://langwatch.ai/docs/integration/mcp)**
How you pay Anthropic decides which path you walk:
* [Tracking Claude Code usage on pay-per-token API keys](#tracking-claude-code-usage-on-pay-per-token-api-keys)
* [Tracking Claude Code usage on 5x or 20x plans](#tracking-claude-code-usage-on-5x-or-20x-plans)
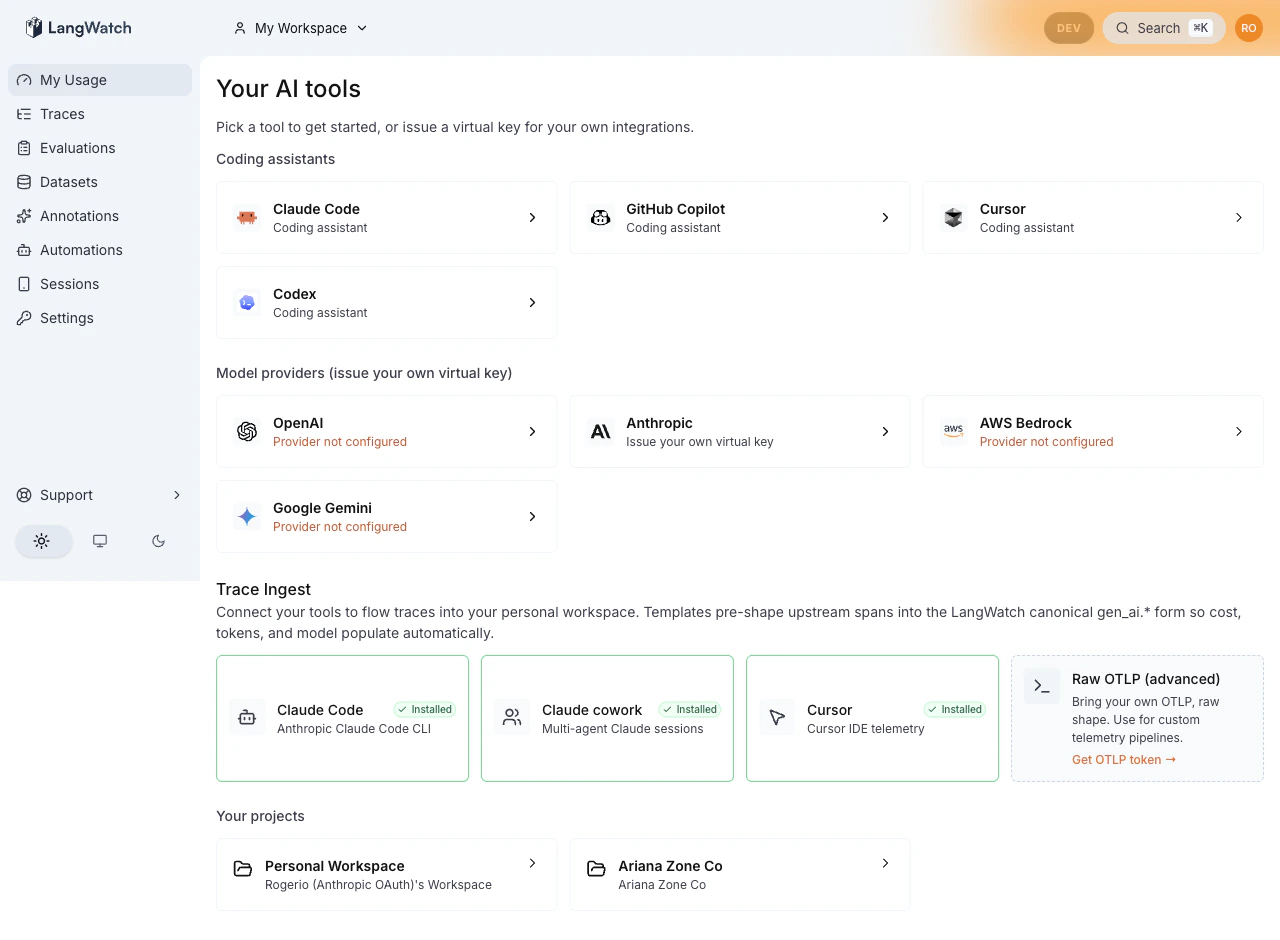
## Step 0: Get LangWatch
Pick one and stop on `/me`:
**SaaS (fastest).** Sign up at [app.langwatch.ai](https://app.langwatch.ai). You land on `/me`.
**Self-hosted (one command).**
```bash theme={null}
npx @langwatch/server
```
That bootstraps Postgres, ClickHouse, Redis, and the app on `http://localhost:5560`. Open it, sign up with email and password.
 ## Tracking Claude Code usage on pay-per-token API keys
You hold an Anthropic API key and pay per request. This path routes every Claude Code call through a local gateway that holds your key, captures the full request and response server-side, and writes a trace. Cost numbers come straight from Anthropic's response.
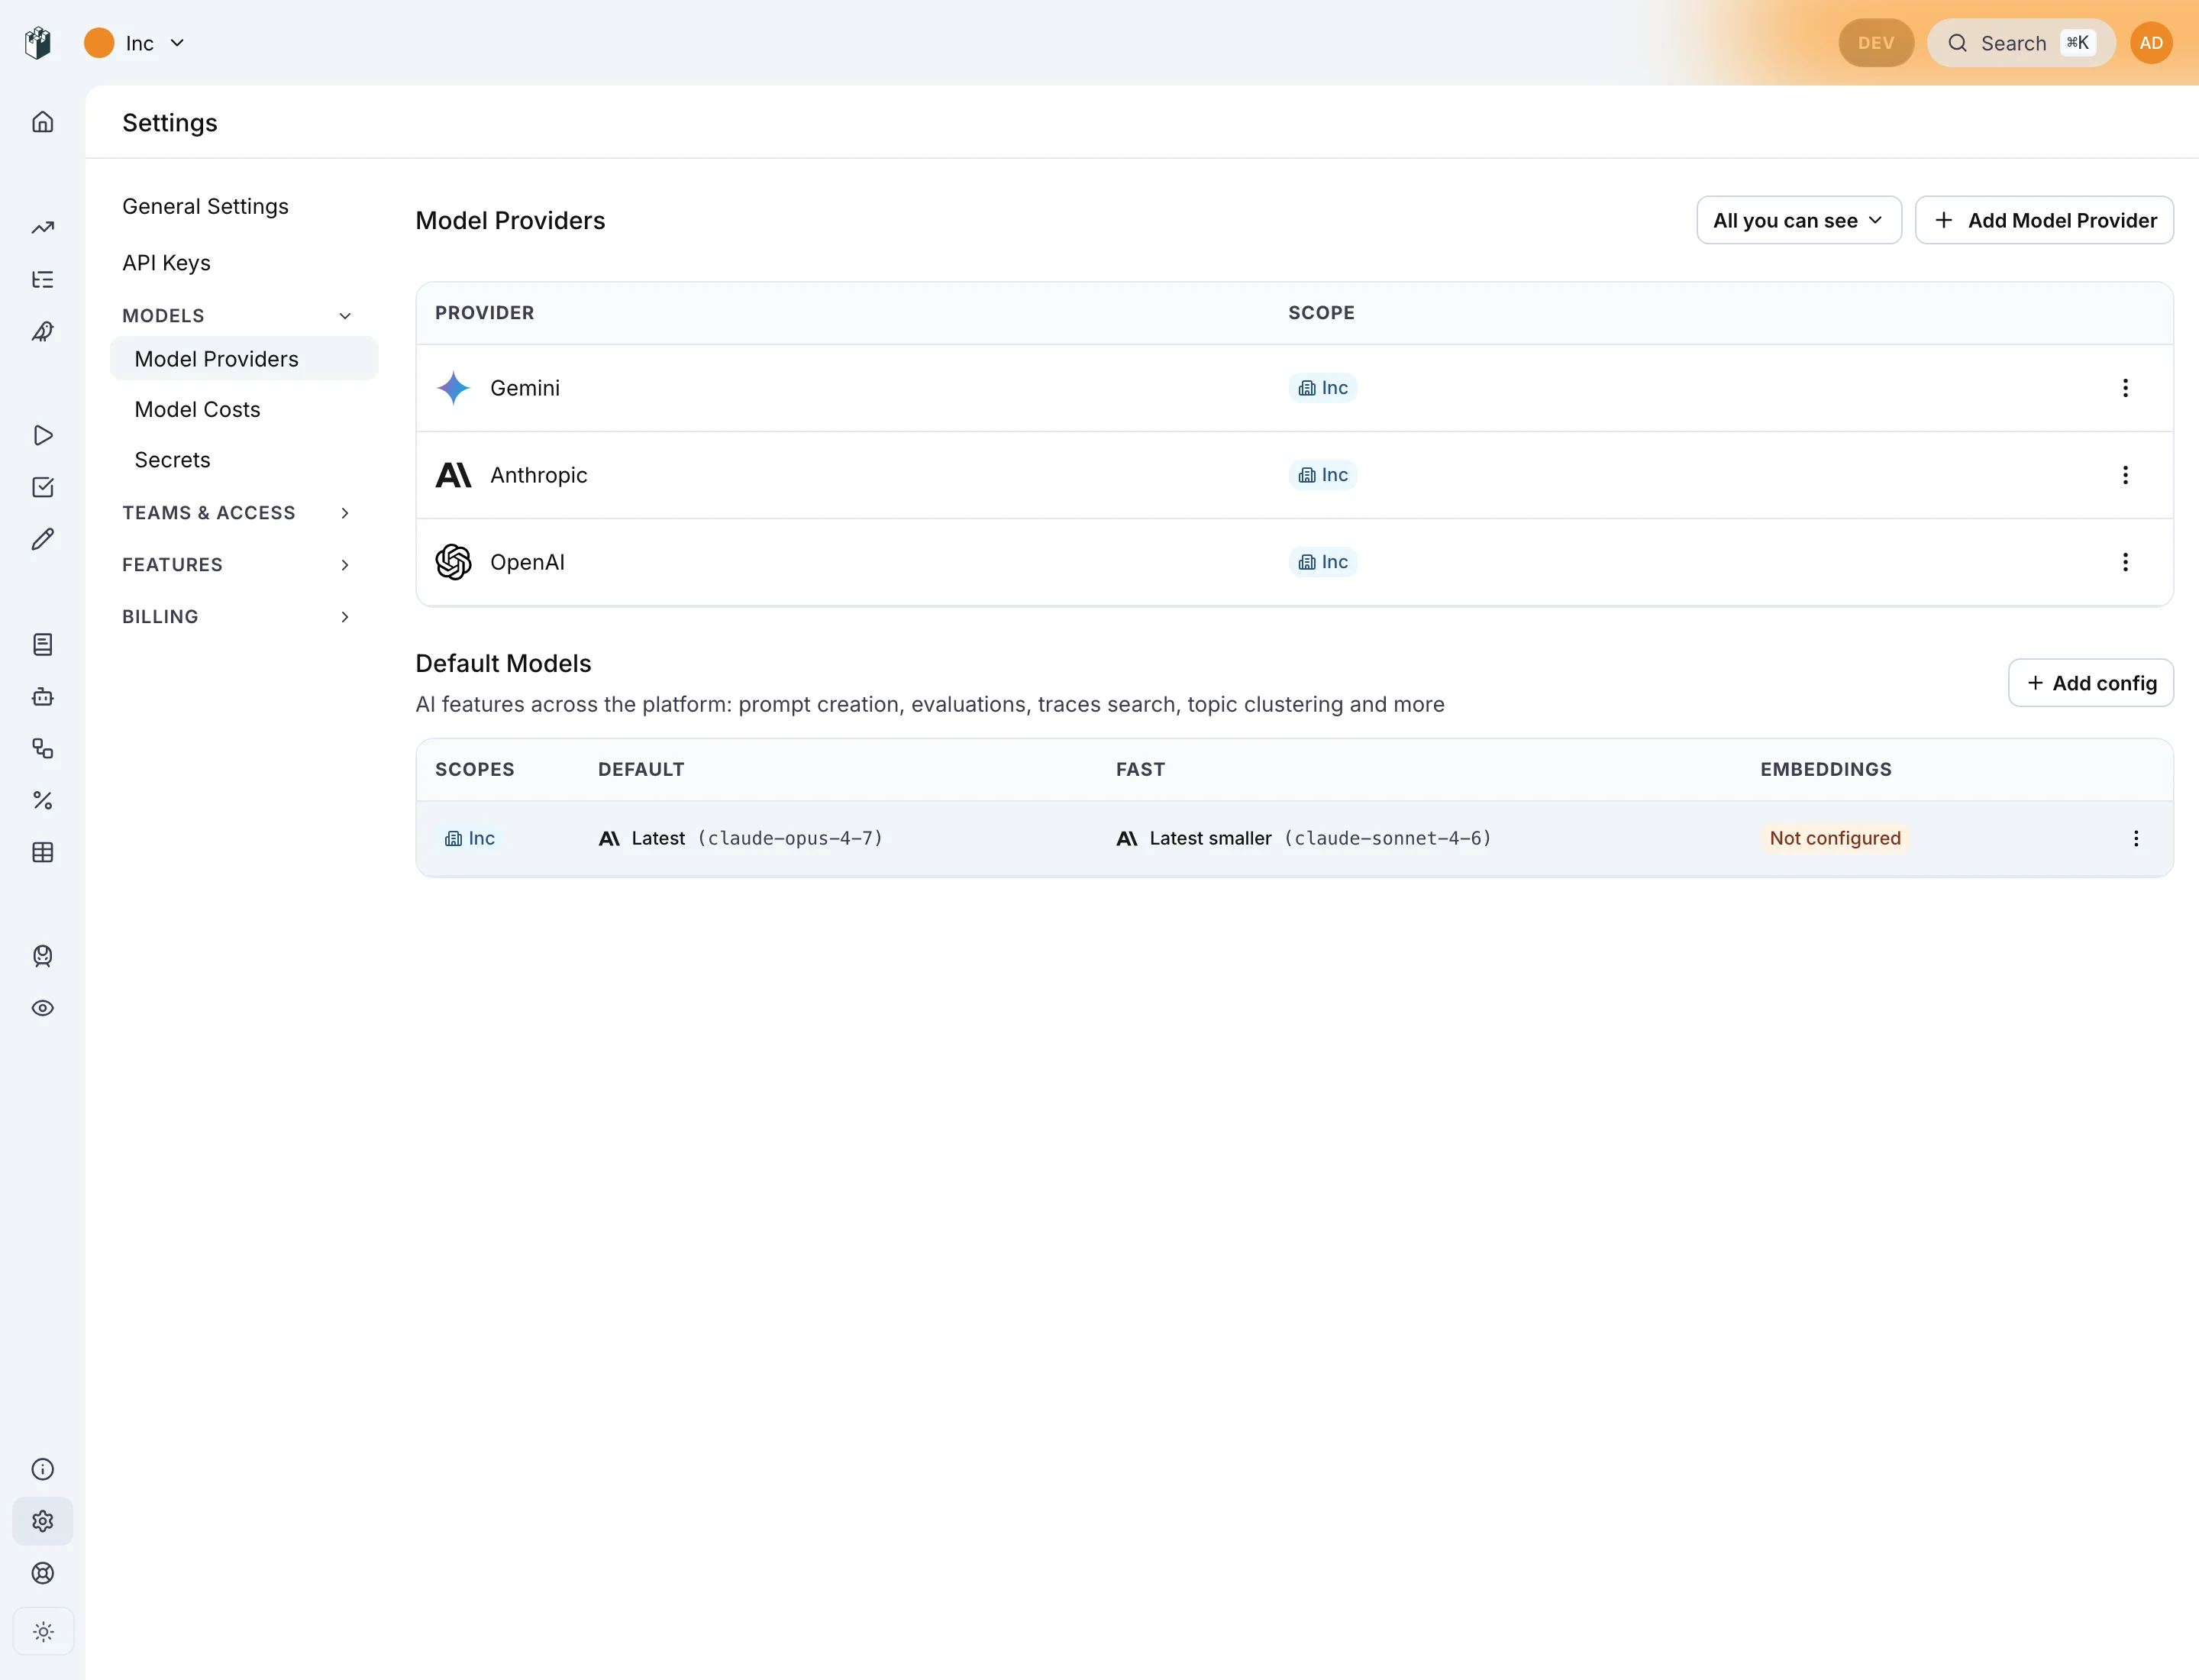
### 1.1 Paste your Anthropic key
Open **Settings → Model providers** (URL: `/settings/model-providers`), click the **Anthropic** tile, paste your `sk-ant-` key.
## Tracking Claude Code usage on pay-per-token API keys
You hold an Anthropic API key and pay per request. This path routes every Claude Code call through a local gateway that holds your key, captures the full request and response server-side, and writes a trace. Cost numbers come straight from Anthropic's response.
### 1.1 Paste your Anthropic key
Open **Settings → Model providers** (URL: `/settings/model-providers`), click the **Anthropic** tile, paste your `sk-ant-` key.
 ### 1.2 Install the CLI
```bash theme={null}
npm install -g langwatch
```
### 1.3 Log in
```bash theme={null}
langwatch login --device
```
Browser opens with an approval code. Approve it. The CLI caches your refresh token and your default Virtual Key at `~/.langwatch/config.json`.
### 1.2 Install the CLI
```bash theme={null}
npm install -g langwatch
```
### 1.3 Log in
```bash theme={null}
langwatch login --device
```
Browser opens with an approval code. Approve it. The CLI caches your refresh token and your default Virtual Key at `~/.langwatch/config.json`.
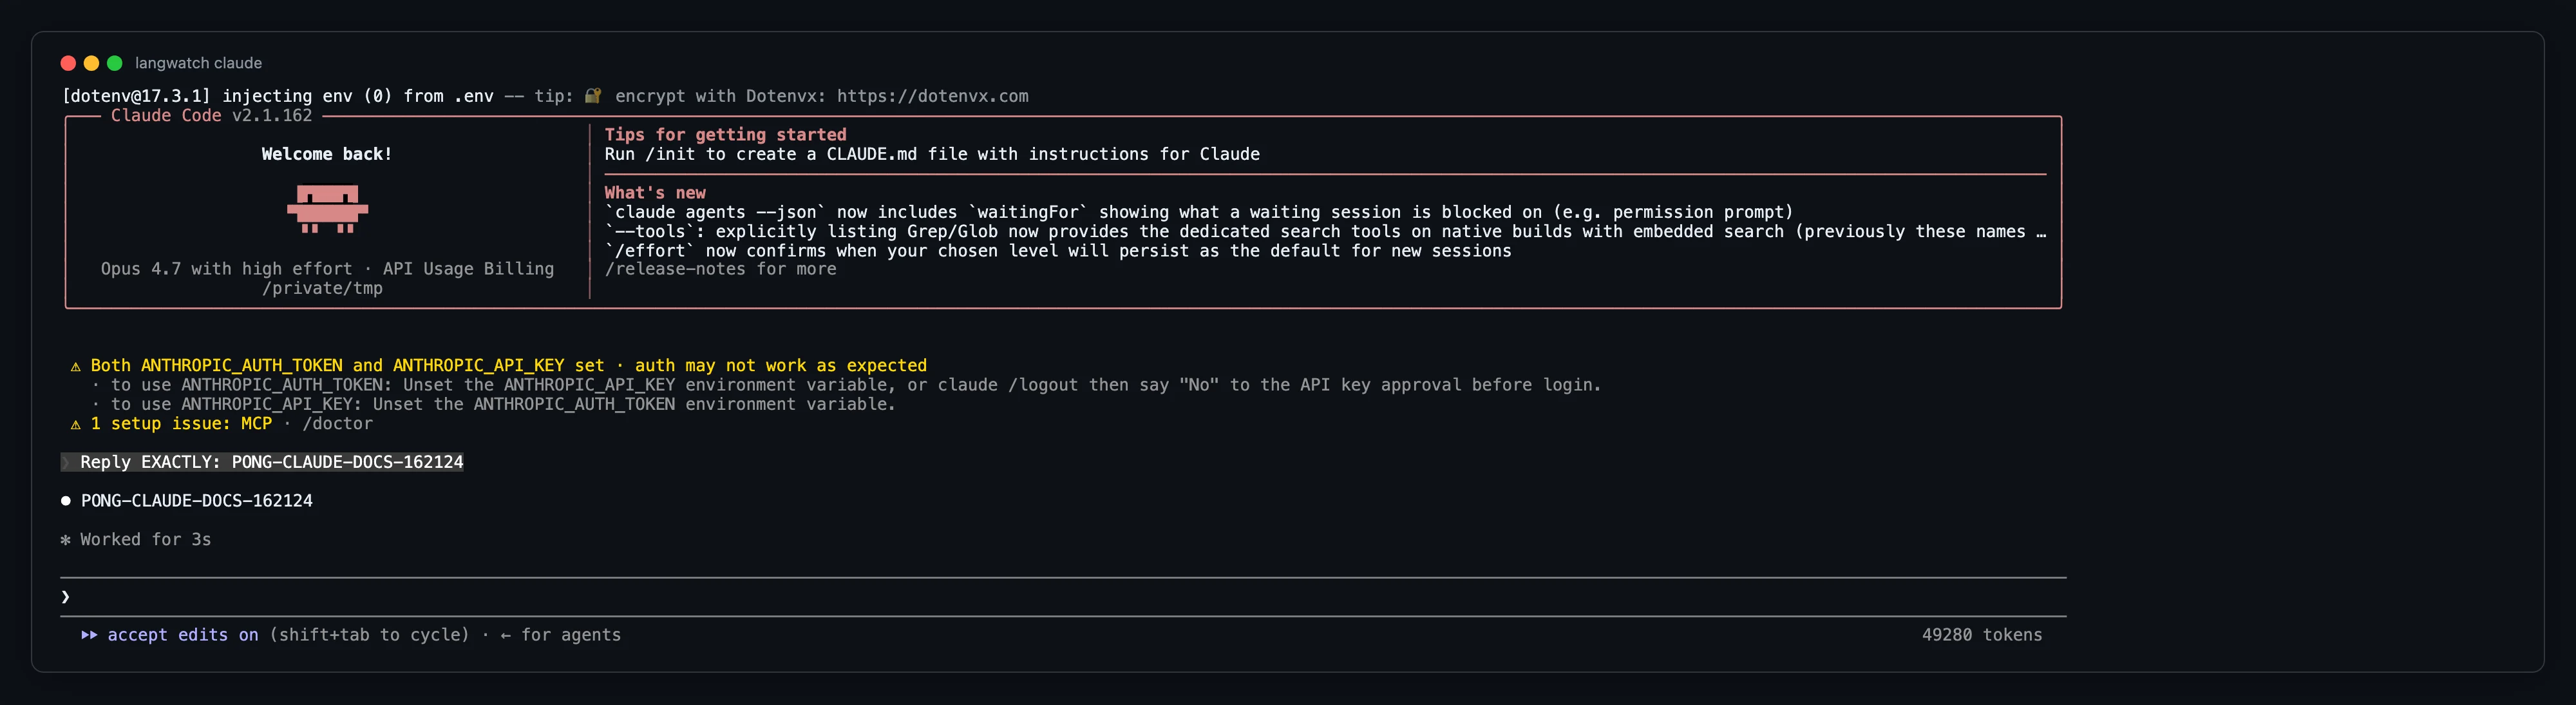
 ### 1.4 Run Claude Code through the wrapper
```bash theme={null}
langwatch claude
```
That spawns Claude Code with `ANTHROPIC_BASE_URL` and `ANTHROPIC_AUTH_TOKEN` set so every request goes through the gateway. UX is identical to `claude` on its own: same REPL, same keybinds, same agent loop.
### 1.4 Run Claude Code through the wrapper
```bash theme={null}
langwatch claude
```
That spawns Claude Code with `ANTHROPIC_BASE_URL` and `ANTHROPIC_AUTH_TOKEN` set so every request goes through the gateway. UX is identical to `claude` on its own: same REPL, same keybinds, same agent loop.
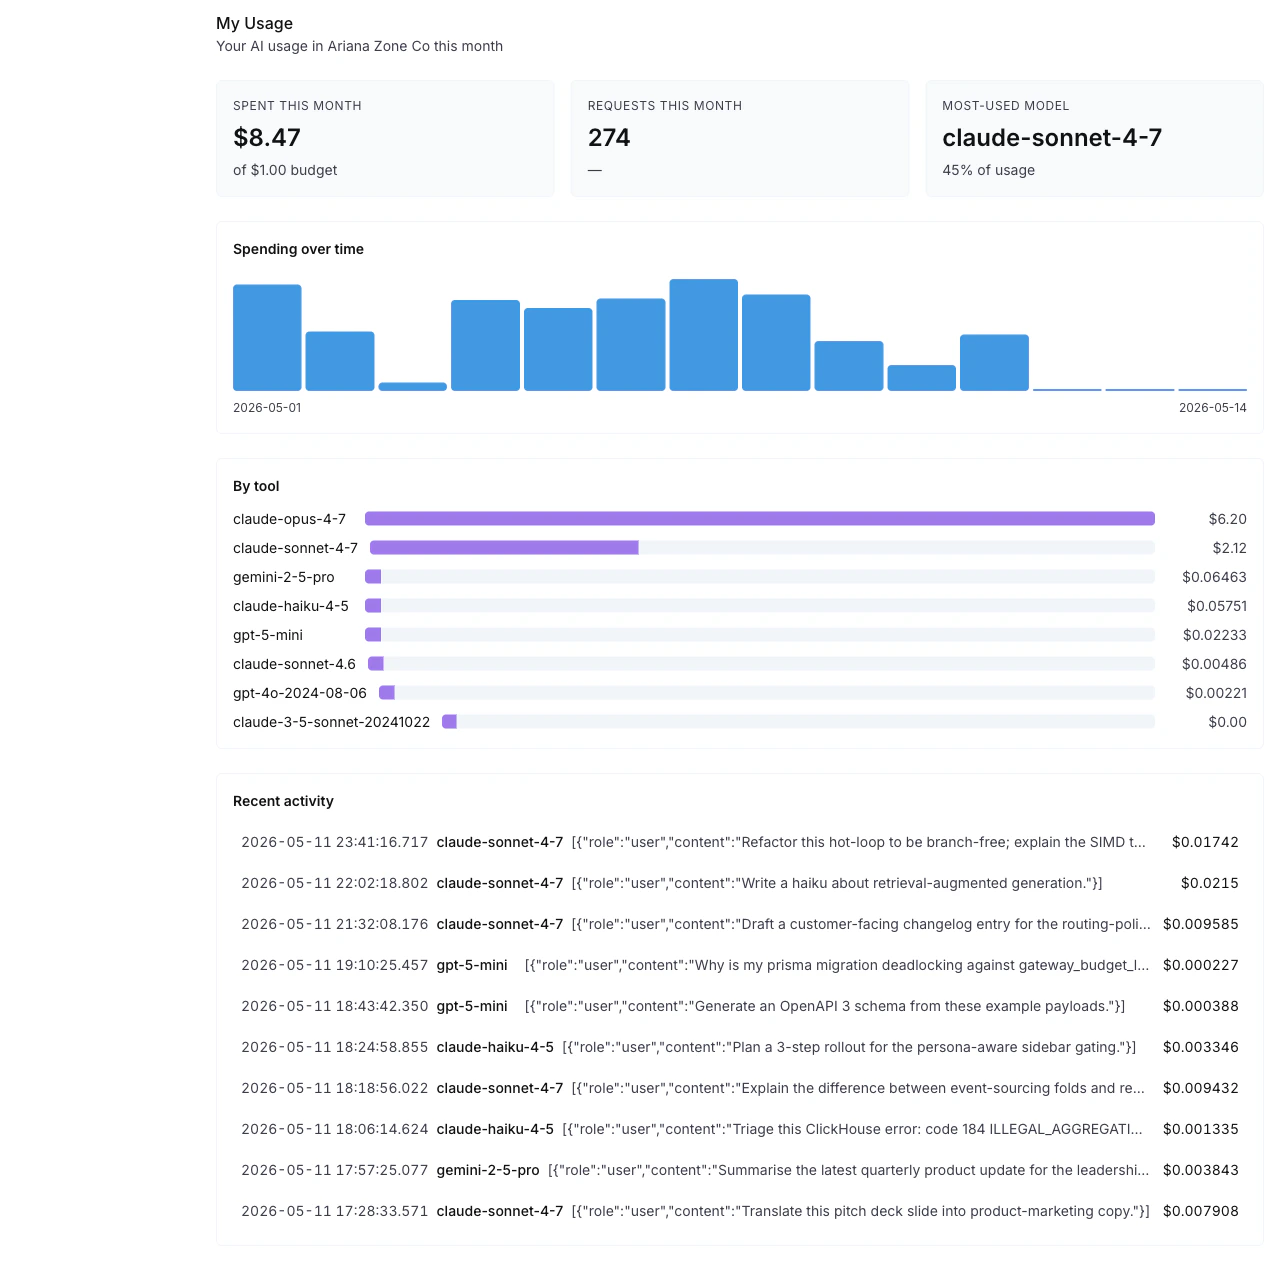
 ### 1.5 Open `/me`
Within a few seconds:
* **Spent this month** has a number.
* **Recent activity** has a row per Claude Code turn, with model, tokens, dollar cost.
* **By tool** breaks down spend per model.
### 1.5 Open `/me`
Within a few seconds:
* **Spent this month** has a number.
* **Recent activity** has a row per Claude Code turn, with model, tokens, dollar cost.
* **By tool** breaks down spend per model.
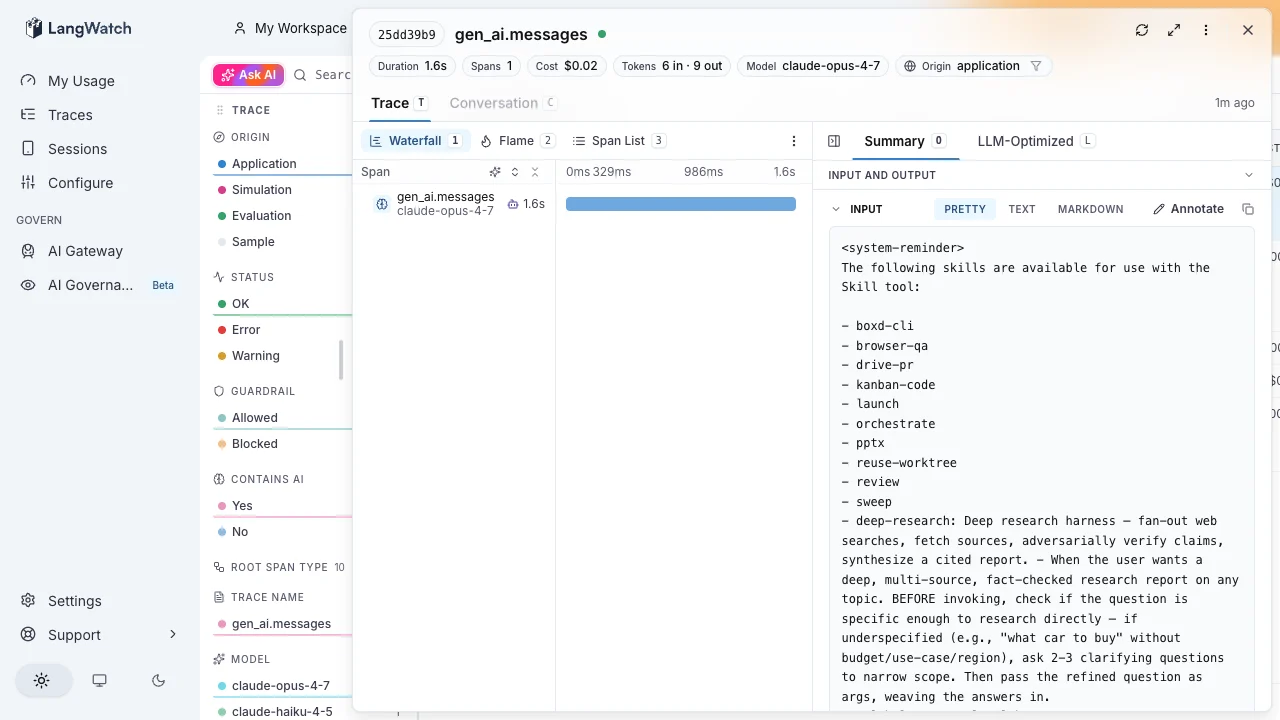
 Click **Traces** in the sidebar for the per-request view. Each turn lands as a `gen_ai.*` span with prompt, response, model, tokens, and dollar cost.
 That is the loop. Every future `langwatch claude` session writes here. Skip to [What you can do with this](#what-you-can-do-with-this).
## Tracking Claude Code usage on 5x or 20x plans
You pay Anthropic flat per month on a Max or Pro plan. The Anthropic Console only shows a monthly total, no per-call breakdown. The only way to see per-call detail is to capture Claude Code's own OpenTelemetry output and let LangWatch render it.
You do not need a Virtual Key for this path. The wrapper detects that no API key is on file and falls back to OTLP ingestion automatically.
### 2.1 Install the CLI
```bash theme={null}
npm install -g langwatch
```
### 2.2 Log in
```bash theme={null}
langwatch login --device
```
Same browser approval as Path 1; no API key needed.
### 2.3 Run Claude Code through the wrapper
```bash theme={null}
langwatch claude
```
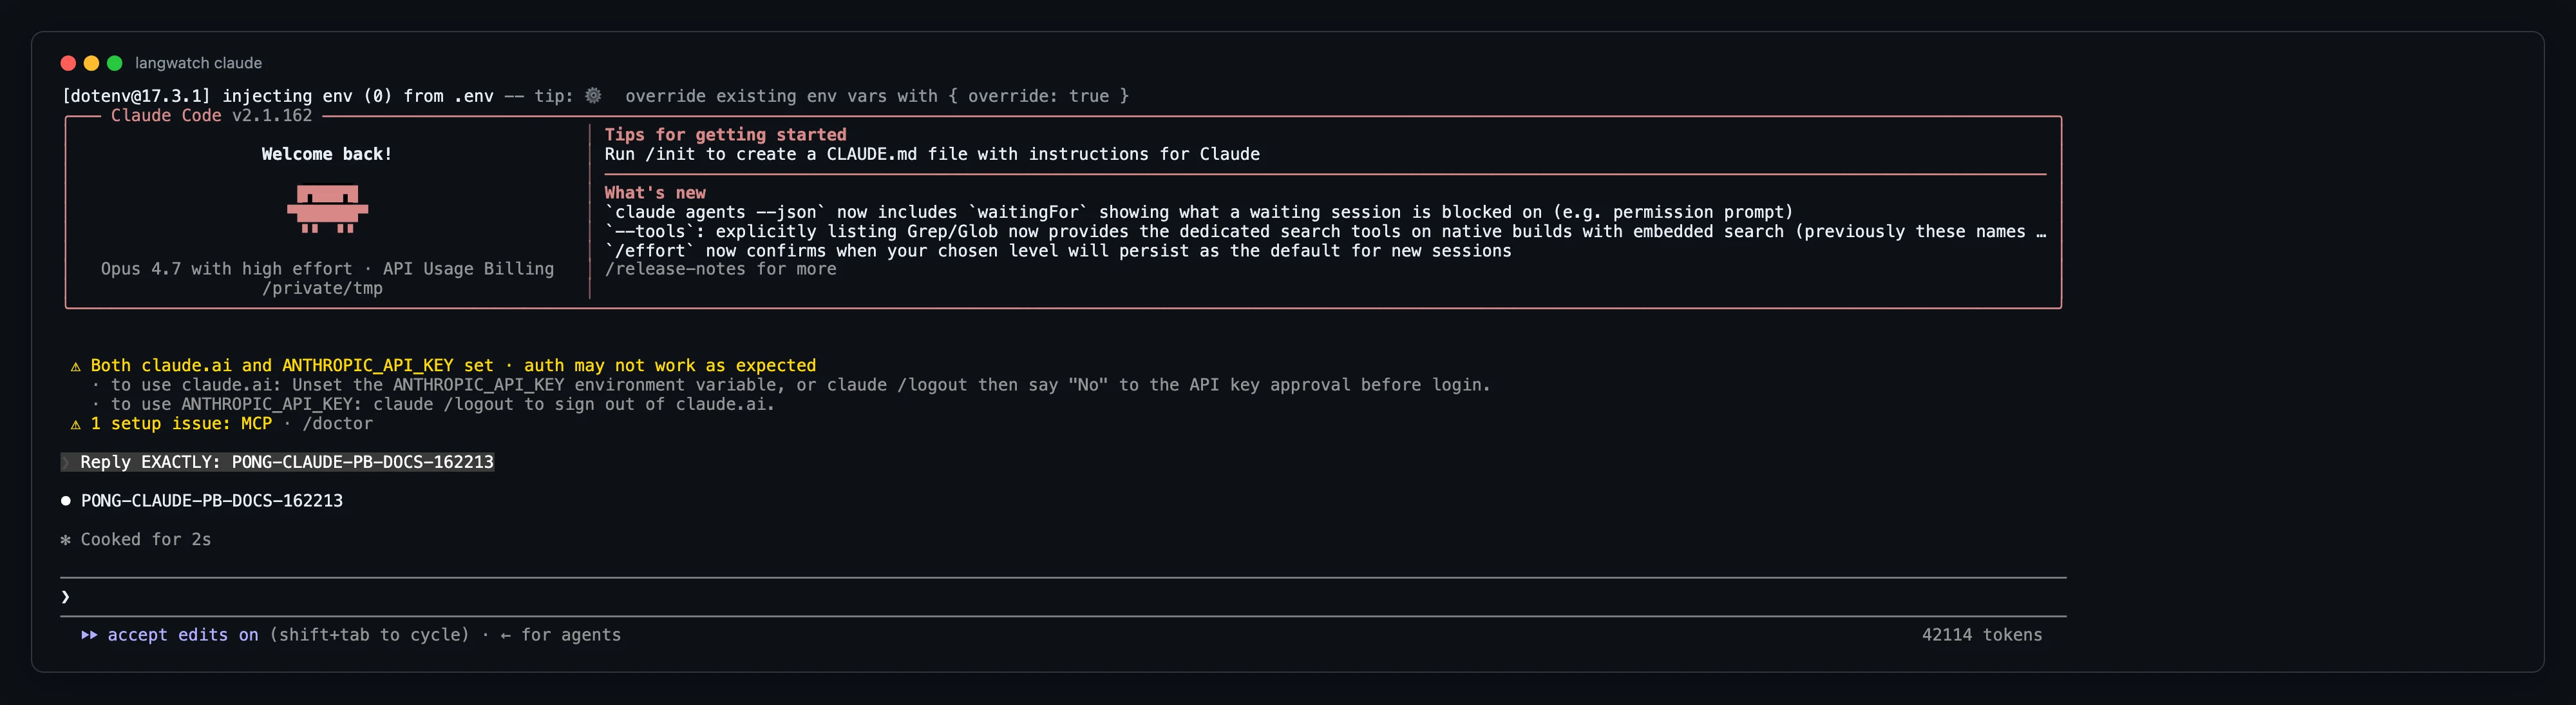
Your Claude Code session keeps using your Max plan unchanged. LangWatch reads the OTel log records Claude Code emits and renders them.
That is the loop. Every future `langwatch claude` session writes here. Skip to [What you can do with this](#what-you-can-do-with-this).
## Tracking Claude Code usage on 5x or 20x plans
You pay Anthropic flat per month on a Max or Pro plan. The Anthropic Console only shows a monthly total, no per-call breakdown. The only way to see per-call detail is to capture Claude Code's own OpenTelemetry output and let LangWatch render it.
You do not need a Virtual Key for this path. The wrapper detects that no API key is on file and falls back to OTLP ingestion automatically.
### 2.1 Install the CLI
```bash theme={null}
npm install -g langwatch
```
### 2.2 Log in
```bash theme={null}
langwatch login --device
```
Same browser approval as Path 1; no API key needed.
### 2.3 Run Claude Code through the wrapper
```bash theme={null}
langwatch claude
```
Your Claude Code session keeps using your Max plan unchanged. LangWatch reads the OTel log records Claude Code emits and renders them.
 ### 2.4 Open `/me`
Within \~30 seconds of your first turn:
* **Spent this month** has a number from Claude Code's own `cost_usd` field.
* **Recent activity** has a row per turn.
* **By tool** shows the model breakdown.
### 2.4 Open `/me`
Within \~30 seconds of your first turn:
* **Spent this month** has a number from Claude Code's own `cost_usd` field.
* **Recent activity** has a row per turn.
* **By tool** shows the model breakdown.
 ## Per-repo telemetry with plain `claude` (no wrapper)
Use this when you have both work and personal repos on the same machine, want telemetry on for specific repos only, run plain `claude` (no wrapper), want the configuration auto-applied per repo at launch with no leak to personal repos.
This is a **delivery method**, not a third billing path — it works under either Path 1 or Path 2's billing model. Instead of the `langwatch claude` wrapper injecting environment variables at spawn time, Claude Code reads them from `.claude/settings.json` in your project root at launch. The LangWatch-specific wiring connects to the **project** OTLP endpoint (`/api/otel/v1/traces`). For why the project endpoint is the correct home for Claude Code's own usage telemetry (versus the governance IngestionSource plane), see [Choosing the right OTel endpoint](/docs/observability/trace-vs-activity-ingestion). For how Claude Code's `env` block works and its settings-precedence rules, see the [Claude Code settings reference](https://code.claude.com/docs/en/settings) — this section documents only the LangWatch wiring.
A repo with no `.claude/settings.json` `env` block, run with plain `claude`, emits zero telemetry to LangWatch.
### Get your project key
The key you need is a standard LangWatch project API key (`sk-lw-…`). Mint it at [app.langwatch.ai/authorize](https://app.langwatch.ai/authorize) — the same self-serve page that produces `LANGWATCH_API_KEY` in the quick-start guide.
Minting requires a live device session. If the mint returns 401, re-run `langwatch login --device` to refresh it. Once minted, **ingestion does not need a live session** — the key authenticates the OTLP endpoint standalone; your `claude` sessions keep sending traces even after the device session expires.
An `ik-lw-` write-only key (obtainable via the governance REST endpoint) also authenticates the project OTLP endpoint, but `sk-lw-` is the documented self-serve path.
### The two-file recipe
Commit `.claude/settings.json` with the non-secret flags and keep the bearer token **plus the `CLAUDE_CODE_ENABLE_TELEMETRY` enable flag** in a gitignored `.claude/settings.local.json`. Telemetry is **off by default**: the enable flag lives only in the local file, so a fresh clone with just the committed `settings.json` (and no `settings.local.json`) never attempts to export. This matters because the committed flags include `OTEL_LOG_USER_PROMPTS` (prompt text); raw API bodies (`OTEL_LOG_RAW_API_BODIES`) are kept off in committed config as the highest-risk flag and opted into locally only when needed. None of this content ships until the repo owner opts in locally by adding the enable flag. `settings.local.json`'s `env` merges per-key with `settings.json`'s `env`, so the local enable flag combines with the committed flags rather than replacing them.
**`.claude/settings.json`** (commit this):
```json theme={null}
{
"env": {
"OTEL_LOG_USER_PROMPTS": "1",
"OTEL_LOG_TOOL_DETAILS": "1",
"OTEL_LOG_TOOL_CONTENT": "1",
"OTEL_LOG_RAW_API_BODIES": "0",
"OTEL_TRACES_EXPORTER": "otlp",
"OTEL_LOGS_EXPORTER": "otlp",
"OTEL_METRICS_EXPORTER": "otlp",
"OTEL_EXPORTER_OTLP_PROTOCOL": "http/json",
"OTEL_EXPORTER_OTLP_ENDPOINT": "https://app.langwatch.ai/api/otel",
"OTEL_RESOURCE_ATTRIBUTES": "project.repo=my-repo-name,cost_center=my-team"
}
}
```
For self-hosted (`npx @langwatch/server`), replace the endpoint with `http://localhost:5560/api/otel`. The SDK auto-appends `/v1/traces`, `/v1/logs`, `/v1/metrics` — never write the per-signal path yourself.
**`.claude/settings.local.json`** (gitignore this — add `.claude/settings.local.json` to `.gitignore`):
```json theme={null}
{
"env": {
"CLAUDE_CODE_ENABLE_TELEMETRY": "1",
"OTEL_EXPORTER_OTLP_HEADERS": "Authorization=Bearer sk-lw-…",
"OTEL_RESOURCE_ATTRIBUTES": "project.repo=my-repo-name,cost_center=my-team,enduser.id=you@example.com"
}
}
```
**`OTEL_RESOURCE_ATTRIBUTES` is not merged across files — the higher-precedence file fully replaces it.** `settings.local.json` wins over `settings.json`, so if you set `OTEL_RESOURCE_ATTRIBUTES` in both, the local file's value completely replaces the committed one. Carry all three attributes (`project.repo`, `cost_center`, `enduser.id`) together in the local file, or `project.repo` is silently dropped from every span.
### Verify
Run `claude` for at least one turn, then send a test trace or inspect the OTLP response. Real success requires **two conditions** to both be true:
1. The response body contains `"Trace received successfully."` (not just HTTP 200).
2. `partialSuccess.rejectedSpans` equals `0` over a **non-empty** body (at least one span submitted).
A bare HTTP 200 is not proof — an empty payload returns `{"message":"No traces to process"}` with 200, and a malformed span returns `rejectedSpans:1` with 200. Both are silent failures.
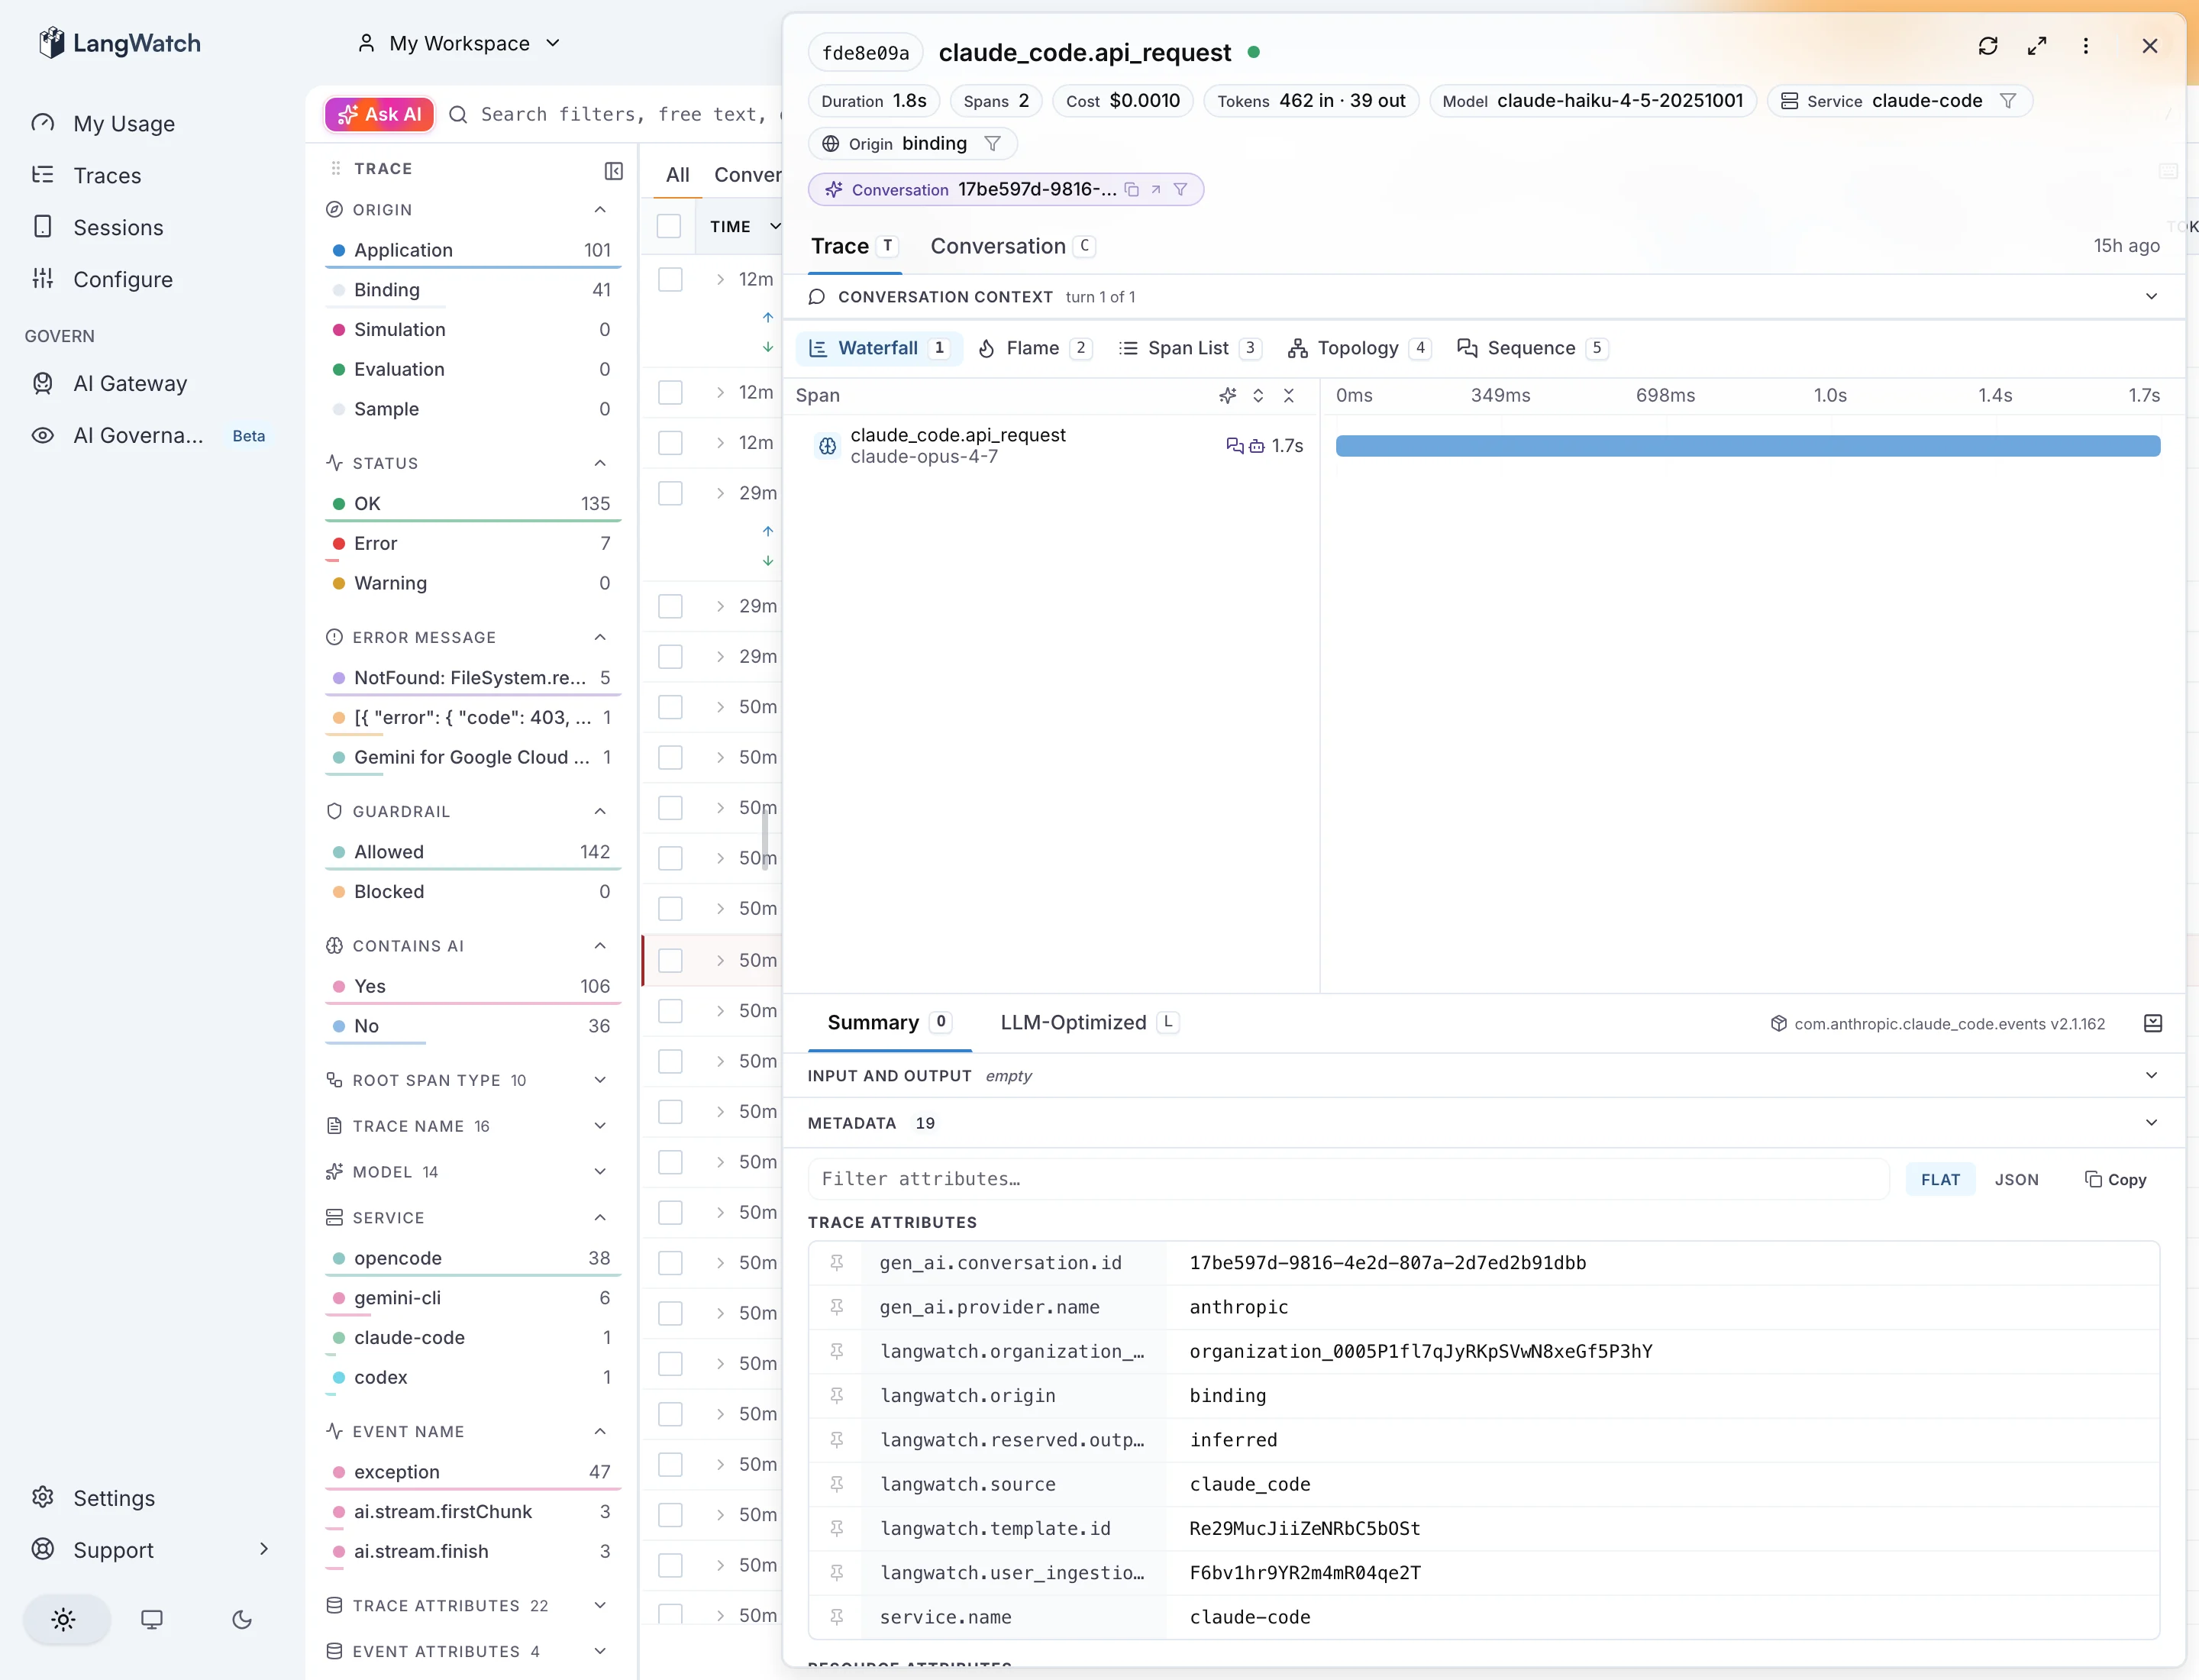
View confirmed traces in `/traces` and cost attribution in `/me`.
`langwatch ingest list` will be **empty** for this path — that is expected. `ingest list` surfaces governance IngestionSources only (the `lw_is_` plane); project-plane traces never create an IngestionSource. Verify via `/traces` and `/me`, not `ingest list`.
### Gotchas
**Claude Code reads `settings.json` `env` at launch.** A session already running when you add or change the `env` block emits nothing until you restart `claude`. If telemetry is missing after editing the file, exit and relaunch.
**`.gitignore` covering all of `.claude/` silently swallows the committed `settings.json`.** Some repos ignore the entire `.claude/` directory for privacy. That prevents `git add` from staging `settings.json`, so teammates never inherit the telemetry flags — yet local telemetry still works for you (the file is present on disk), so you won't notice. Fix: either `git add -f .claude/settings.json` to force-track it, or — if you want the file tracked by default — fix the `.gitignore` itself. A bare `!.claude/settings.json` negation is a no-op here, because git won't descend into an excluded directory to re-include a file under it. You have to un-ignore the directory first, then re-ignore the secret files:
```gitignore theme={null}
.claude/
!.claude/ # un-ignore the dir so specific files can be re-included
.claude/settings.local.json # re-ignore the secret (personal/token) file
.claude/*.lock # re-ignore other previously-covered files (e.g. scheduled_tasks.lock)
```
After this, `git check-ignore .claude/settings.json` reports it is no longer ignored (so it commits), while `settings.local.json` stays ignored (so your token is safe).
**Shared key vs key per repo.** One `sk-lw-` key can serve any number of repos — attribution rides on the `project.repo` resource attribute, not the key itself. However, revoking a shared key (app/dashboard only — no CLI revoke) kills telemetry for all repos using it. If you need isolated blast radius, mint a separate key per repo.
**Telemetry is scoped to the launch directory, not the git repository identity.** Claude Code resolves `.claude/settings.json` by walking up from the working directory at launch — so starting from a subdirectory still works via walk-up. A git worktree of the same repo is a separate directory tree; its gitignored `settings.local.json` does not carry over from the main worktree, so telemetry silently won't apply in the worktree unless you re-wire it there. `project.repo` is a hand-set label in `OTEL_RESOURCE_ATTRIBUTES` — it is not derived from the git remote or any git metadata.
## What you can do with this
Whichever path you walked, the data is now sitting on `/me` and `/traces`. Some things you can do with it that Claude Code does not give you on its own:
### Find expensive sessions
`/traces` is the right surface for this: filter by cost, sort, drill into any session to see exactly what was sent and what came back. Useful when one session burns through an unexpected amount of context, or when you want to audit a whole day of agent activity.
### Audit cache hit ratio
The trace metadata includes `cache_creation_tokens` and `cache_read_tokens` separately. Anthropic prompt caching reads at roughly 0.1x and writes at roughly 1.25x of the regular input rate, so the split is the difference between expensive and cheap turns. If your cache\_read ratio is low, your prompts are probably changing the cacheable prefix between turns.
### See what the agent actually sent
You can read every prompt the agent issued, including the long system prompt and any tool definitions it injected.
### Set a personal budget
`/me` → **Settings** → **Personal budget**. Set a monthly cap.
* **Path 1**: the gateway enforces it. Requests fail with `budget_exceeded` once you cross.
* **Path 2**: alerts at 80% and 100%. Claude Code calls keep flowing; Anthropic does not let the receiver gate them.
### Have the agent improve itself off its own traces
Point Claude Code (or any agent) at LangWatch's [skills directory](https://langwatch.ai/docs/skills/directory) so it can reach into its own past traces, find where it wasted tokens or made the wrong call, and update its own behaviour. The [LangWatch MCP](https://langwatch.ai/docs/integration/mcp) does the same thing through the MCP protocol.
### Use the same wrapper for other CLIs
Same pattern works for the other agent CLIs you might be running. The wrapper picks gateway vs OTLP ingestion based on whether a Virtual Key is on file.
| Command | With Virtual Key | Without Virtual Key |
| -------------------- | --------------------------------------------------------- | ----------------------------------------------------------------------------------------------------------------------------------------------------------------------------------------------------------------------------------------------------------------------------------------------------------------------------------------- |
| `langwatch claude` | gateway via `ANTHROPIC_BASE_URL` + `ANTHROPIC_AUTH_TOKEN` | OTLP via `CLAUDE_CODE_ENABLE_TELEMETRY` + an ingestion key on `OTEL_EXPORTER_OTLP_HEADERS="Authorization=Bearer sk-lw-…"` + the four `OTEL_LOG_*` unlock knobs (`USER_PROMPTS`, `TOOL_DETAILS`, `TOOL_CONTENT`, `RAW_API_BODIES`) so user prompt text, tool I/O content, and full api\_response\_body assistant text all land on the wire |
| `langwatch codex` | gateway via `OPENAI_BASE_URL` + `OPENAI_API_KEY` | OTLP via `[otel]` block in `~/.codex/config.toml` |
| `langwatch gemini` | gateway via `GOOGLE_GEMINI_BASE_URL` + `GEMINI_API_KEY` | OTLP (gen\_ai.\* native) |
| `langwatch opencode` | gateway via `OPENAI_*` + `ANTHROPIC_*` env pairs | OTLP (opencode 1.14 emits structural spans only; tokens / model / cost wait on upstream `gen_ai.*` adoption) |
## Privacy
Everything you mint here is scoped to your personal project. If you signed in via a shared org workspace, switch to your personal workspace before running `langwatch login` so the wrapper binds to the right account; the workspace picker is at the top of the sidebar.
For self-hosted (`npx @langwatch/server`), nothing leaves your machine. Postgres, ClickHouse, and Redis all bind to localhost.
## Troubleshooting
**Device login approval fails with "AI-tools (device) login needs governance enabled" (self-hosted).** Your server runs a LangWatch version that ships governance off by default. Update it (`npx @langwatch/server@latest`) or set `RELEASE_UI_AI_GOVERNANCE_ENABLED=1` in `~/.langwatch/.env` and restart the server, then re-run `langwatch login --device`.
**Nothing in Recent activity after 30 seconds.** Confirm the wrapper spawned with the right env. Open `~/.langwatch/config.json`: Path 1 needs a `default_personal_vk` block, Path 2 needs the wrapper to have minted an ingestion key (`sk-lw-…`) on first run. If neither shows up, re-run `langwatch login --device` and then `langwatch claude` again. `langwatch init-shell` prints the eval-able shell snippet showing exactly which env vars the wrapper injects.
**401 from the gateway (Path 1).** Your Virtual Key probably rotated. Re-run `langwatch login --device` or re-mint the Virtual Key from `/me` → Model providers.
**Cost shows \$0 even though traces land (Path 2).** Model alias in the span does not match a current entry in LangWatch's cost catalog. Check `gen_ai.request.model` on the span; current-gen identifiers (`claude-sonnet-4-6`, `claude-opus-4-7`, `claude-haiku-4-5`) match. Legacy aliases (`claude-3-5-sonnet-20241022`) silently return NULL cost.
**Self-hosted: app starts but `/me` is empty.** You probably signed up with the wrong provider. `npx @langwatch/server` only enables email + password by default. Sign up with that.
For deeper failure modes see [CLI debug](/docs/ai-governance/cli-debug) and [Ingestion Templates](/docs/ai-governance/ingestion-templates).
## Per-repo telemetry with plain `claude` (no wrapper)
Use this when you have both work and personal repos on the same machine, want telemetry on for specific repos only, run plain `claude` (no wrapper), want the configuration auto-applied per repo at launch with no leak to personal repos.
This is a **delivery method**, not a third billing path — it works under either Path 1 or Path 2's billing model. Instead of the `langwatch claude` wrapper injecting environment variables at spawn time, Claude Code reads them from `.claude/settings.json` in your project root at launch. The LangWatch-specific wiring connects to the **project** OTLP endpoint (`/api/otel/v1/traces`). For why the project endpoint is the correct home for Claude Code's own usage telemetry (versus the governance IngestionSource plane), see [Choosing the right OTel endpoint](/docs/observability/trace-vs-activity-ingestion). For how Claude Code's `env` block works and its settings-precedence rules, see the [Claude Code settings reference](https://code.claude.com/docs/en/settings) — this section documents only the LangWatch wiring.
A repo with no `.claude/settings.json` `env` block, run with plain `claude`, emits zero telemetry to LangWatch.
### Get your project key
The key you need is a standard LangWatch project API key (`sk-lw-…`). Mint it at [app.langwatch.ai/authorize](https://app.langwatch.ai/authorize) — the same self-serve page that produces `LANGWATCH_API_KEY` in the quick-start guide.
Minting requires a live device session. If the mint returns 401, re-run `langwatch login --device` to refresh it. Once minted, **ingestion does not need a live session** — the key authenticates the OTLP endpoint standalone; your `claude` sessions keep sending traces even after the device session expires.
An `ik-lw-` write-only key (obtainable via the governance REST endpoint) also authenticates the project OTLP endpoint, but `sk-lw-` is the documented self-serve path.
### The two-file recipe
Commit `.claude/settings.json` with the non-secret flags and keep the bearer token **plus the `CLAUDE_CODE_ENABLE_TELEMETRY` enable flag** in a gitignored `.claude/settings.local.json`. Telemetry is **off by default**: the enable flag lives only in the local file, so a fresh clone with just the committed `settings.json` (and no `settings.local.json`) never attempts to export. This matters because the committed flags include `OTEL_LOG_USER_PROMPTS` (prompt text); raw API bodies (`OTEL_LOG_RAW_API_BODIES`) are kept off in committed config as the highest-risk flag and opted into locally only when needed. None of this content ships until the repo owner opts in locally by adding the enable flag. `settings.local.json`'s `env` merges per-key with `settings.json`'s `env`, so the local enable flag combines with the committed flags rather than replacing them.
**`.claude/settings.json`** (commit this):
```json theme={null}
{
"env": {
"OTEL_LOG_USER_PROMPTS": "1",
"OTEL_LOG_TOOL_DETAILS": "1",
"OTEL_LOG_TOOL_CONTENT": "1",
"OTEL_LOG_RAW_API_BODIES": "0",
"OTEL_TRACES_EXPORTER": "otlp",
"OTEL_LOGS_EXPORTER": "otlp",
"OTEL_METRICS_EXPORTER": "otlp",
"OTEL_EXPORTER_OTLP_PROTOCOL": "http/json",
"OTEL_EXPORTER_OTLP_ENDPOINT": "https://app.langwatch.ai/api/otel",
"OTEL_RESOURCE_ATTRIBUTES": "project.repo=my-repo-name,cost_center=my-team"
}
}
```
For self-hosted (`npx @langwatch/server`), replace the endpoint with `http://localhost:5560/api/otel`. The SDK auto-appends `/v1/traces`, `/v1/logs`, `/v1/metrics` — never write the per-signal path yourself.
**`.claude/settings.local.json`** (gitignore this — add `.claude/settings.local.json` to `.gitignore`):
```json theme={null}
{
"env": {
"CLAUDE_CODE_ENABLE_TELEMETRY": "1",
"OTEL_EXPORTER_OTLP_HEADERS": "Authorization=Bearer sk-lw-…",
"OTEL_RESOURCE_ATTRIBUTES": "project.repo=my-repo-name,cost_center=my-team,enduser.id=you@example.com"
}
}
```
**`OTEL_RESOURCE_ATTRIBUTES` is not merged across files — the higher-precedence file fully replaces it.** `settings.local.json` wins over `settings.json`, so if you set `OTEL_RESOURCE_ATTRIBUTES` in both, the local file's value completely replaces the committed one. Carry all three attributes (`project.repo`, `cost_center`, `enduser.id`) together in the local file, or `project.repo` is silently dropped from every span.
### Verify
Run `claude` for at least one turn, then send a test trace or inspect the OTLP response. Real success requires **two conditions** to both be true:
1. The response body contains `"Trace received successfully."` (not just HTTP 200).
2. `partialSuccess.rejectedSpans` equals `0` over a **non-empty** body (at least one span submitted).
A bare HTTP 200 is not proof — an empty payload returns `{"message":"No traces to process"}` with 200, and a malformed span returns `rejectedSpans:1` with 200. Both are silent failures.
View confirmed traces in `/traces` and cost attribution in `/me`.
`langwatch ingest list` will be **empty** for this path — that is expected. `ingest list` surfaces governance IngestionSources only (the `lw_is_` plane); project-plane traces never create an IngestionSource. Verify via `/traces` and `/me`, not `ingest list`.
### Gotchas
**Claude Code reads `settings.json` `env` at launch.** A session already running when you add or change the `env` block emits nothing until you restart `claude`. If telemetry is missing after editing the file, exit and relaunch.
**`.gitignore` covering all of `.claude/` silently swallows the committed `settings.json`.** Some repos ignore the entire `.claude/` directory for privacy. That prevents `git add` from staging `settings.json`, so teammates never inherit the telemetry flags — yet local telemetry still works for you (the file is present on disk), so you won't notice. Fix: either `git add -f .claude/settings.json` to force-track it, or — if you want the file tracked by default — fix the `.gitignore` itself. A bare `!.claude/settings.json` negation is a no-op here, because git won't descend into an excluded directory to re-include a file under it. You have to un-ignore the directory first, then re-ignore the secret files:
```gitignore theme={null}
.claude/
!.claude/ # un-ignore the dir so specific files can be re-included
.claude/settings.local.json # re-ignore the secret (personal/token) file
.claude/*.lock # re-ignore other previously-covered files (e.g. scheduled_tasks.lock)
```
After this, `git check-ignore .claude/settings.json` reports it is no longer ignored (so it commits), while `settings.local.json` stays ignored (so your token is safe).
**Shared key vs key per repo.** One `sk-lw-` key can serve any number of repos — attribution rides on the `project.repo` resource attribute, not the key itself. However, revoking a shared key (app/dashboard only — no CLI revoke) kills telemetry for all repos using it. If you need isolated blast radius, mint a separate key per repo.
**Telemetry is scoped to the launch directory, not the git repository identity.** Claude Code resolves `.claude/settings.json` by walking up from the working directory at launch — so starting from a subdirectory still works via walk-up. A git worktree of the same repo is a separate directory tree; its gitignored `settings.local.json` does not carry over from the main worktree, so telemetry silently won't apply in the worktree unless you re-wire it there. `project.repo` is a hand-set label in `OTEL_RESOURCE_ATTRIBUTES` — it is not derived from the git remote or any git metadata.
## What you can do with this
Whichever path you walked, the data is now sitting on `/me` and `/traces`. Some things you can do with it that Claude Code does not give you on its own:
### Find expensive sessions
`/traces` is the right surface for this: filter by cost, sort, drill into any session to see exactly what was sent and what came back. Useful when one session burns through an unexpected amount of context, or when you want to audit a whole day of agent activity.
### Audit cache hit ratio
The trace metadata includes `cache_creation_tokens` and `cache_read_tokens` separately. Anthropic prompt caching reads at roughly 0.1x and writes at roughly 1.25x of the regular input rate, so the split is the difference between expensive and cheap turns. If your cache\_read ratio is low, your prompts are probably changing the cacheable prefix between turns.
### See what the agent actually sent
You can read every prompt the agent issued, including the long system prompt and any tool definitions it injected.
### Set a personal budget
`/me` → **Settings** → **Personal budget**. Set a monthly cap.
* **Path 1**: the gateway enforces it. Requests fail with `budget_exceeded` once you cross.
* **Path 2**: alerts at 80% and 100%. Claude Code calls keep flowing; Anthropic does not let the receiver gate them.
### Have the agent improve itself off its own traces
Point Claude Code (or any agent) at LangWatch's [skills directory](https://langwatch.ai/docs/skills/directory) so it can reach into its own past traces, find where it wasted tokens or made the wrong call, and update its own behaviour. The [LangWatch MCP](https://langwatch.ai/docs/integration/mcp) does the same thing through the MCP protocol.
### Use the same wrapper for other CLIs
Same pattern works for the other agent CLIs you might be running. The wrapper picks gateway vs OTLP ingestion based on whether a Virtual Key is on file.
| Command | With Virtual Key | Without Virtual Key |
| -------------------- | --------------------------------------------------------- | ----------------------------------------------------------------------------------------------------------------------------------------------------------------------------------------------------------------------------------------------------------------------------------------------------------------------------------------- |
| `langwatch claude` | gateway via `ANTHROPIC_BASE_URL` + `ANTHROPIC_AUTH_TOKEN` | OTLP via `CLAUDE_CODE_ENABLE_TELEMETRY` + an ingestion key on `OTEL_EXPORTER_OTLP_HEADERS="Authorization=Bearer sk-lw-…"` + the four `OTEL_LOG_*` unlock knobs (`USER_PROMPTS`, `TOOL_DETAILS`, `TOOL_CONTENT`, `RAW_API_BODIES`) so user prompt text, tool I/O content, and full api\_response\_body assistant text all land on the wire |
| `langwatch codex` | gateway via `OPENAI_BASE_URL` + `OPENAI_API_KEY` | OTLP via `[otel]` block in `~/.codex/config.toml` |
| `langwatch gemini` | gateway via `GOOGLE_GEMINI_BASE_URL` + `GEMINI_API_KEY` | OTLP (gen\_ai.\* native) |
| `langwatch opencode` | gateway via `OPENAI_*` + `ANTHROPIC_*` env pairs | OTLP (opencode 1.14 emits structural spans only; tokens / model / cost wait on upstream `gen_ai.*` adoption) |
## Privacy
Everything you mint here is scoped to your personal project. If you signed in via a shared org workspace, switch to your personal workspace before running `langwatch login` so the wrapper binds to the right account; the workspace picker is at the top of the sidebar.
For self-hosted (`npx @langwatch/server`), nothing leaves your machine. Postgres, ClickHouse, and Redis all bind to localhost.
## Troubleshooting
**Device login approval fails with "AI-tools (device) login needs governance enabled" (self-hosted).** Your server runs a LangWatch version that ships governance off by default. Update it (`npx @langwatch/server@latest`) or set `RELEASE_UI_AI_GOVERNANCE_ENABLED=1` in `~/.langwatch/.env` and restart the server, then re-run `langwatch login --device`.
**Nothing in Recent activity after 30 seconds.** Confirm the wrapper spawned with the right env. Open `~/.langwatch/config.json`: Path 1 needs a `default_personal_vk` block, Path 2 needs the wrapper to have minted an ingestion key (`sk-lw-…`) on first run. If neither shows up, re-run `langwatch login --device` and then `langwatch claude` again. `langwatch init-shell` prints the eval-able shell snippet showing exactly which env vars the wrapper injects.
**401 from the gateway (Path 1).** Your Virtual Key probably rotated. Re-run `langwatch login --device` or re-mint the Virtual Key from `/me` → Model providers.
**Cost shows \$0 even though traces land (Path 2).** Model alias in the span does not match a current entry in LangWatch's cost catalog. Check `gen_ai.request.model` on the span; current-gen identifiers (`claude-sonnet-4-6`, `claude-opus-4-7`, `claude-haiku-4-5`) match. Legacy aliases (`claude-3-5-sonnet-20241022`) silently return NULL cost.
**Self-hosted: app starts but `/me` is empty.** You probably signed up with the wrong provider. `npx @langwatch/server` only enables email + password by default. Sign up with that.
For deeper failure modes see [CLI debug](/docs/ai-governance/cli-debug) and [Ingestion Templates](/docs/ai-governance/ingestion-templates).