> ## Documentation Index
> Fetch the complete documentation index at: https://langwatch.ai/docs/llms.txt
> Use this file to discover all available pages before exploring further.
# Tracking Time to First Token (TTFT)
> Capture time to first token on your LLM spans with the LangWatch Python SDK, automatically or manually, and monitor streaming latency with p95 comparisons.
Time to First Token (TTFT) measures how long your users wait between sending a request and seeing the first piece of the streamed answer. For streaming LLM applications it is usually a better proxy for perceived speed than total duration: a response can take 20 seconds to finish and still feel instant if the first token arrives in 300ms.
LangWatch captures TTFT per LLM span, rolls it up to the trace, and surfaces it across the product:
 ## Automatic capture
If your instrumentation already emits any of the signals below, TTFT shows up without any extra code:
| Source | Signal |
| ----------------------------------- | ----------------------------------------------------------------------- |
| OpenLLMetry / OpenLIT instrumentors | `llm.content.completion.chunk` / `First Token Stream Event` span events |
| OTel GenAI semconv emitters | `gen_ai.server.time_to_first_token` span attribute (milliseconds) |
| Vercel AI SDK | `ai.response.msToFirstChunk` span attribute |
| LangWatch SDKs | `timestamps.first_token_at` on the span (see below) |
When more than one LLM span in a trace reports a TTFT, the trace-level value is the smallest one, the first token the user could have seen.
## Setting TTFT manually
If you handle streaming yourself, capture the timestamp of the first chunk and pass it through `update(timestamps=...)`. The value is the **unix epoch timestamp in milliseconds at which the first token arrived**, not the elapsed duration:
```python theme={null}
import time
import langwatch
from openai import OpenAI
client = OpenAI()
@langwatch.span(type="llm")
def stream_completion(prompt: str) -> str:
span = langwatch.get_current_span()
span.update(model="openai/gpt-5-mini", input=prompt)
first_token_at = None
chunks = []
stream = client.chat.completions.create(
model="gpt-5-mini",
messages=[{"role": "user", "content": prompt}],
stream=True,
)
for chunk in stream:
if first_token_at is None:
first_token_at = round(time.time() * 1000) # epoch milliseconds
if chunk.choices and chunk.choices[0].delta.content:
chunks.append(chunk.choices[0].delta.content)
span.update(
output="".join(chunks),
timestamps={"first_token_at": first_token_at},
)
return "".join(chunks)
@langwatch.trace()
def main():
return stream_completion("Tell me about LangWatch")
```
LangWatch computes TTFT as `first_token_at - started_at`. You don't need to set `started_at` or `finished_at`, those fall back to the span's own start and end times.
Assigning to the dict directly, e.g. `langwatch.get_current_span().timestamps["first_token_at"] = ...`, does **not** work. The timestamps are only exported to the underlying OpenTelemetry span when they go through `update(timestamps=...)`.
### If you already have the duration
When your code measures the elapsed time instead of the wall-clock timestamp, report it through either of these equivalents:
```python theme={null}
span = langwatch.get_current_span()
# Option A: OTel GenAI semconv attribute, duration in milliseconds
span.set_attributes({"gen_ai.server.time_to_first_token": ttft_ms})
# Option B: LangWatch metrics field, duration in milliseconds
span.update(metrics={"first_token_ms": ttft_ms})
```
### REST API
If you send spans through the [REST API](/docs/integration/rest-api) instead of the SDK, set `first_token_at` (epoch milliseconds) in the span's `timestamps` object:
```json theme={null}
{
"type": "llm",
"span_id": "span-123",
"timestamps": {
"started_at": 1718886000000,
"first_token_at": 1718886000800,
"finished_at": 1718886004200
}
}
```
## Where TTFT shows up
### Traces table column
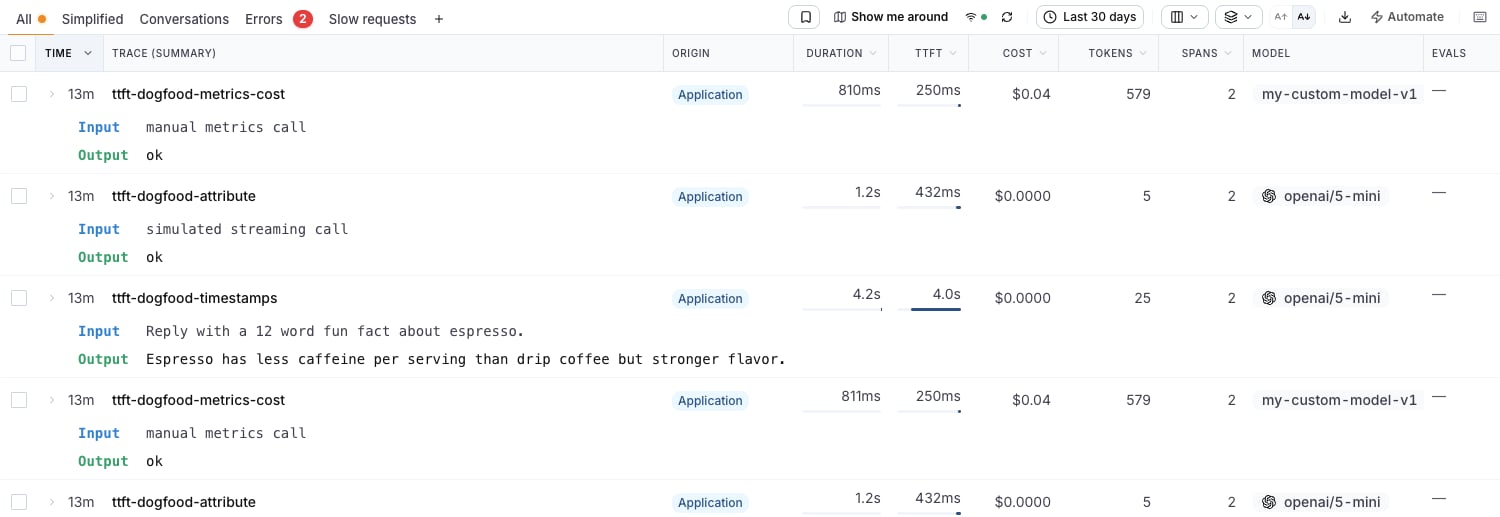
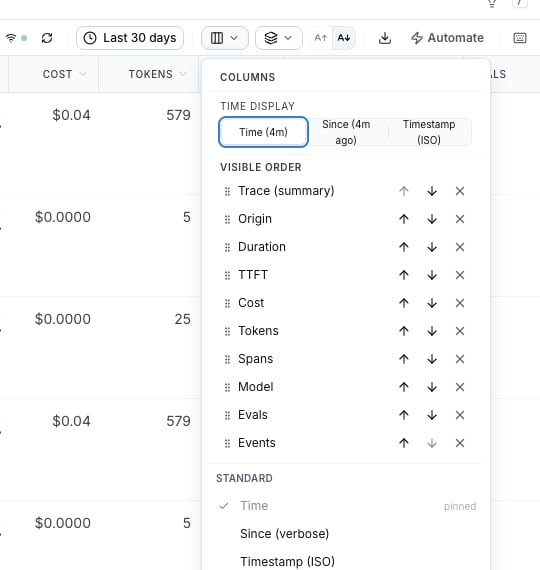
On the Traces page, open the columns picker (the columns icon in the toolbar) and enable **TTFT**. The column behaves like the Duration column: each cell shows the value plus an inline bar scaled to the 95th percentile of the visible page, so one slow outlier doesn't flatten every other row. Rows at or above the page's TTFT p95 render a full red bar.
## Automatic capture
If your instrumentation already emits any of the signals below, TTFT shows up without any extra code:
| Source | Signal |
| ----------------------------------- | ----------------------------------------------------------------------- |
| OpenLLMetry / OpenLIT instrumentors | `llm.content.completion.chunk` / `First Token Stream Event` span events |
| OTel GenAI semconv emitters | `gen_ai.server.time_to_first_token` span attribute (milliseconds) |
| Vercel AI SDK | `ai.response.msToFirstChunk` span attribute |
| LangWatch SDKs | `timestamps.first_token_at` on the span (see below) |
When more than one LLM span in a trace reports a TTFT, the trace-level value is the smallest one, the first token the user could have seen.
## Setting TTFT manually
If you handle streaming yourself, capture the timestamp of the first chunk and pass it through `update(timestamps=...)`. The value is the **unix epoch timestamp in milliseconds at which the first token arrived**, not the elapsed duration:
```python theme={null}
import time
import langwatch
from openai import OpenAI
client = OpenAI()
@langwatch.span(type="llm")
def stream_completion(prompt: str) -> str:
span = langwatch.get_current_span()
span.update(model="openai/gpt-5-mini", input=prompt)
first_token_at = None
chunks = []
stream = client.chat.completions.create(
model="gpt-5-mini",
messages=[{"role": "user", "content": prompt}],
stream=True,
)
for chunk in stream:
if first_token_at is None:
first_token_at = round(time.time() * 1000) # epoch milliseconds
if chunk.choices and chunk.choices[0].delta.content:
chunks.append(chunk.choices[0].delta.content)
span.update(
output="".join(chunks),
timestamps={"first_token_at": first_token_at},
)
return "".join(chunks)
@langwatch.trace()
def main():
return stream_completion("Tell me about LangWatch")
```
LangWatch computes TTFT as `first_token_at - started_at`. You don't need to set `started_at` or `finished_at`, those fall back to the span's own start and end times.
Assigning to the dict directly, e.g. `langwatch.get_current_span().timestamps["first_token_at"] = ...`, does **not** work. The timestamps are only exported to the underlying OpenTelemetry span when they go through `update(timestamps=...)`.
### If you already have the duration
When your code measures the elapsed time instead of the wall-clock timestamp, report it through either of these equivalents:
```python theme={null}
span = langwatch.get_current_span()
# Option A: OTel GenAI semconv attribute, duration in milliseconds
span.set_attributes({"gen_ai.server.time_to_first_token": ttft_ms})
# Option B: LangWatch metrics field, duration in milliseconds
span.update(metrics={"first_token_ms": ttft_ms})
```
### REST API
If you send spans through the [REST API](/docs/integration/rest-api) instead of the SDK, set `first_token_at` (epoch milliseconds) in the span's `timestamps` object:
```json theme={null}
{
"type": "llm",
"span_id": "span-123",
"timestamps": {
"started_at": 1718886000000,
"first_token_at": 1718886000800,
"finished_at": 1718886004200
}
}
```
## Where TTFT shows up
### Traces table column
On the Traces page, open the columns picker (the columns icon in the toolbar) and enable **TTFT**. The column behaves like the Duration column: each cell shows the value plus an inline bar scaled to the 95th percentile of the visible page, so one slow outlier doesn't flatten every other row. Rows at or above the page's TTFT p95 render a full red bar.
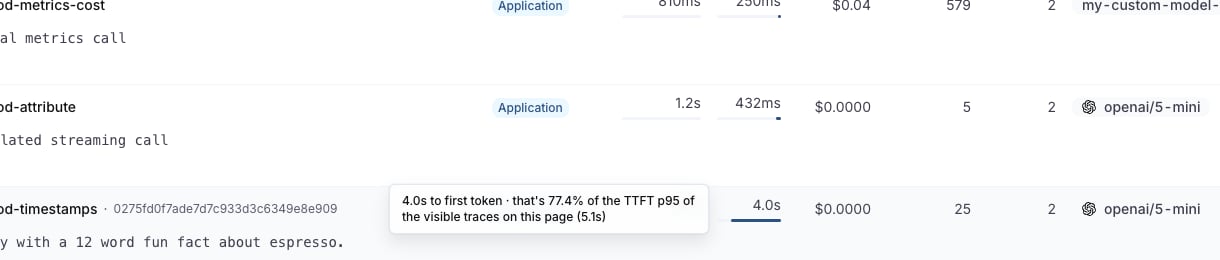
 Hovering a cell shows how that trace compares against the page's TTFT p95:
 The column is sortable, so you can order by TTFT to chase your slowest streaming starts.
### Trace details
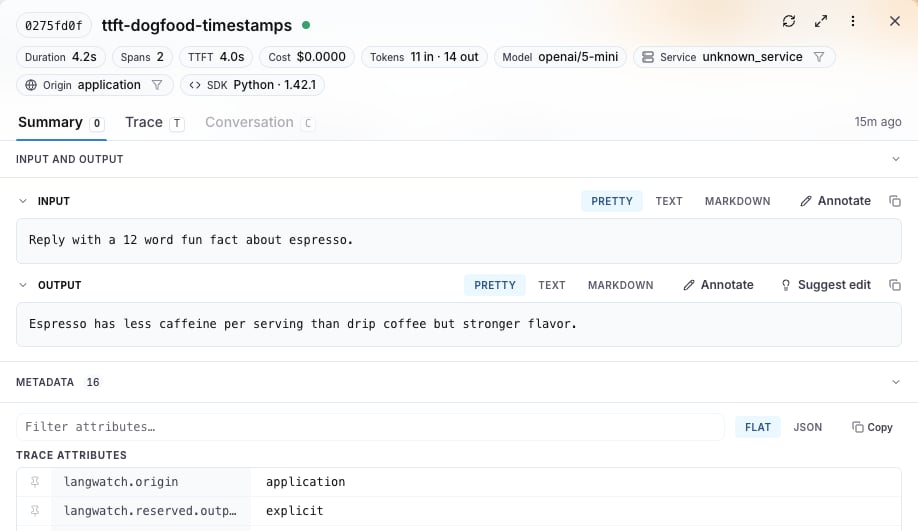
The trace drawer shows a TTFT pill in the header next to duration, cost, and tokens:
The column is sortable, so you can order by TTFT to chase your slowest streaming starts.
### Trace details
The trace drawer shows a TTFT pill in the header next to duration, cost, and tokens:
 ### Analytics
In **Analytics > LLM Metrics** you get time-to-first-token graphs with the usual aggregations (median, p90, p95, p99), and you can build custom graphs on the same metric for dashboards and alerting.
## Troubleshooting
* **TTFT shows "—" in the table**: the trace has no LLM span reporting any of the signals above. For non-streaming calls this is expected, there is no "first token" moment distinct from the response itself.
* **Value looks wrong by orders of magnitude**: check the units. `first_token_at` is an epoch timestamp in milliseconds; `gen_ai.server.time_to_first_token` and `first_token_ms` are durations in milliseconds.
* **You set timestamps but nothing shows**: make sure the values go through `span.update(timestamps=...)` rather than mutating `span.timestamps` in place.
### Analytics
In **Analytics > LLM Metrics** you get time-to-first-token graphs with the usual aggregations (median, p90, p95, p99), and you can build custom graphs on the same metric for dashboards and alerting.
## Troubleshooting
* **TTFT shows "—" in the table**: the trace has no LLM span reporting any of the signals above. For non-streaming calls this is expected, there is no "first token" moment distinct from the response itself.
* **Value looks wrong by orders of magnitude**: check the units. `first_token_at` is an epoch timestamp in milliseconds; `gen_ai.server.time_to_first_token` and `first_token_ms` are durations in milliseconds.
* **You set timestamps but nothing shows**: make sure the values go through `span.update(timestamps=...)` rather than mutating `span.timestamps` in place.