> ## Documentation Index
> Fetch the complete documentation index at: https://langwatch.ai/docs/llms.txt
> Use this file to discover all available pages before exploring further.
# Observability & Tracing
> Monitor, debug, and optimize your LLM applications with comprehensive observability and tracing capabilities
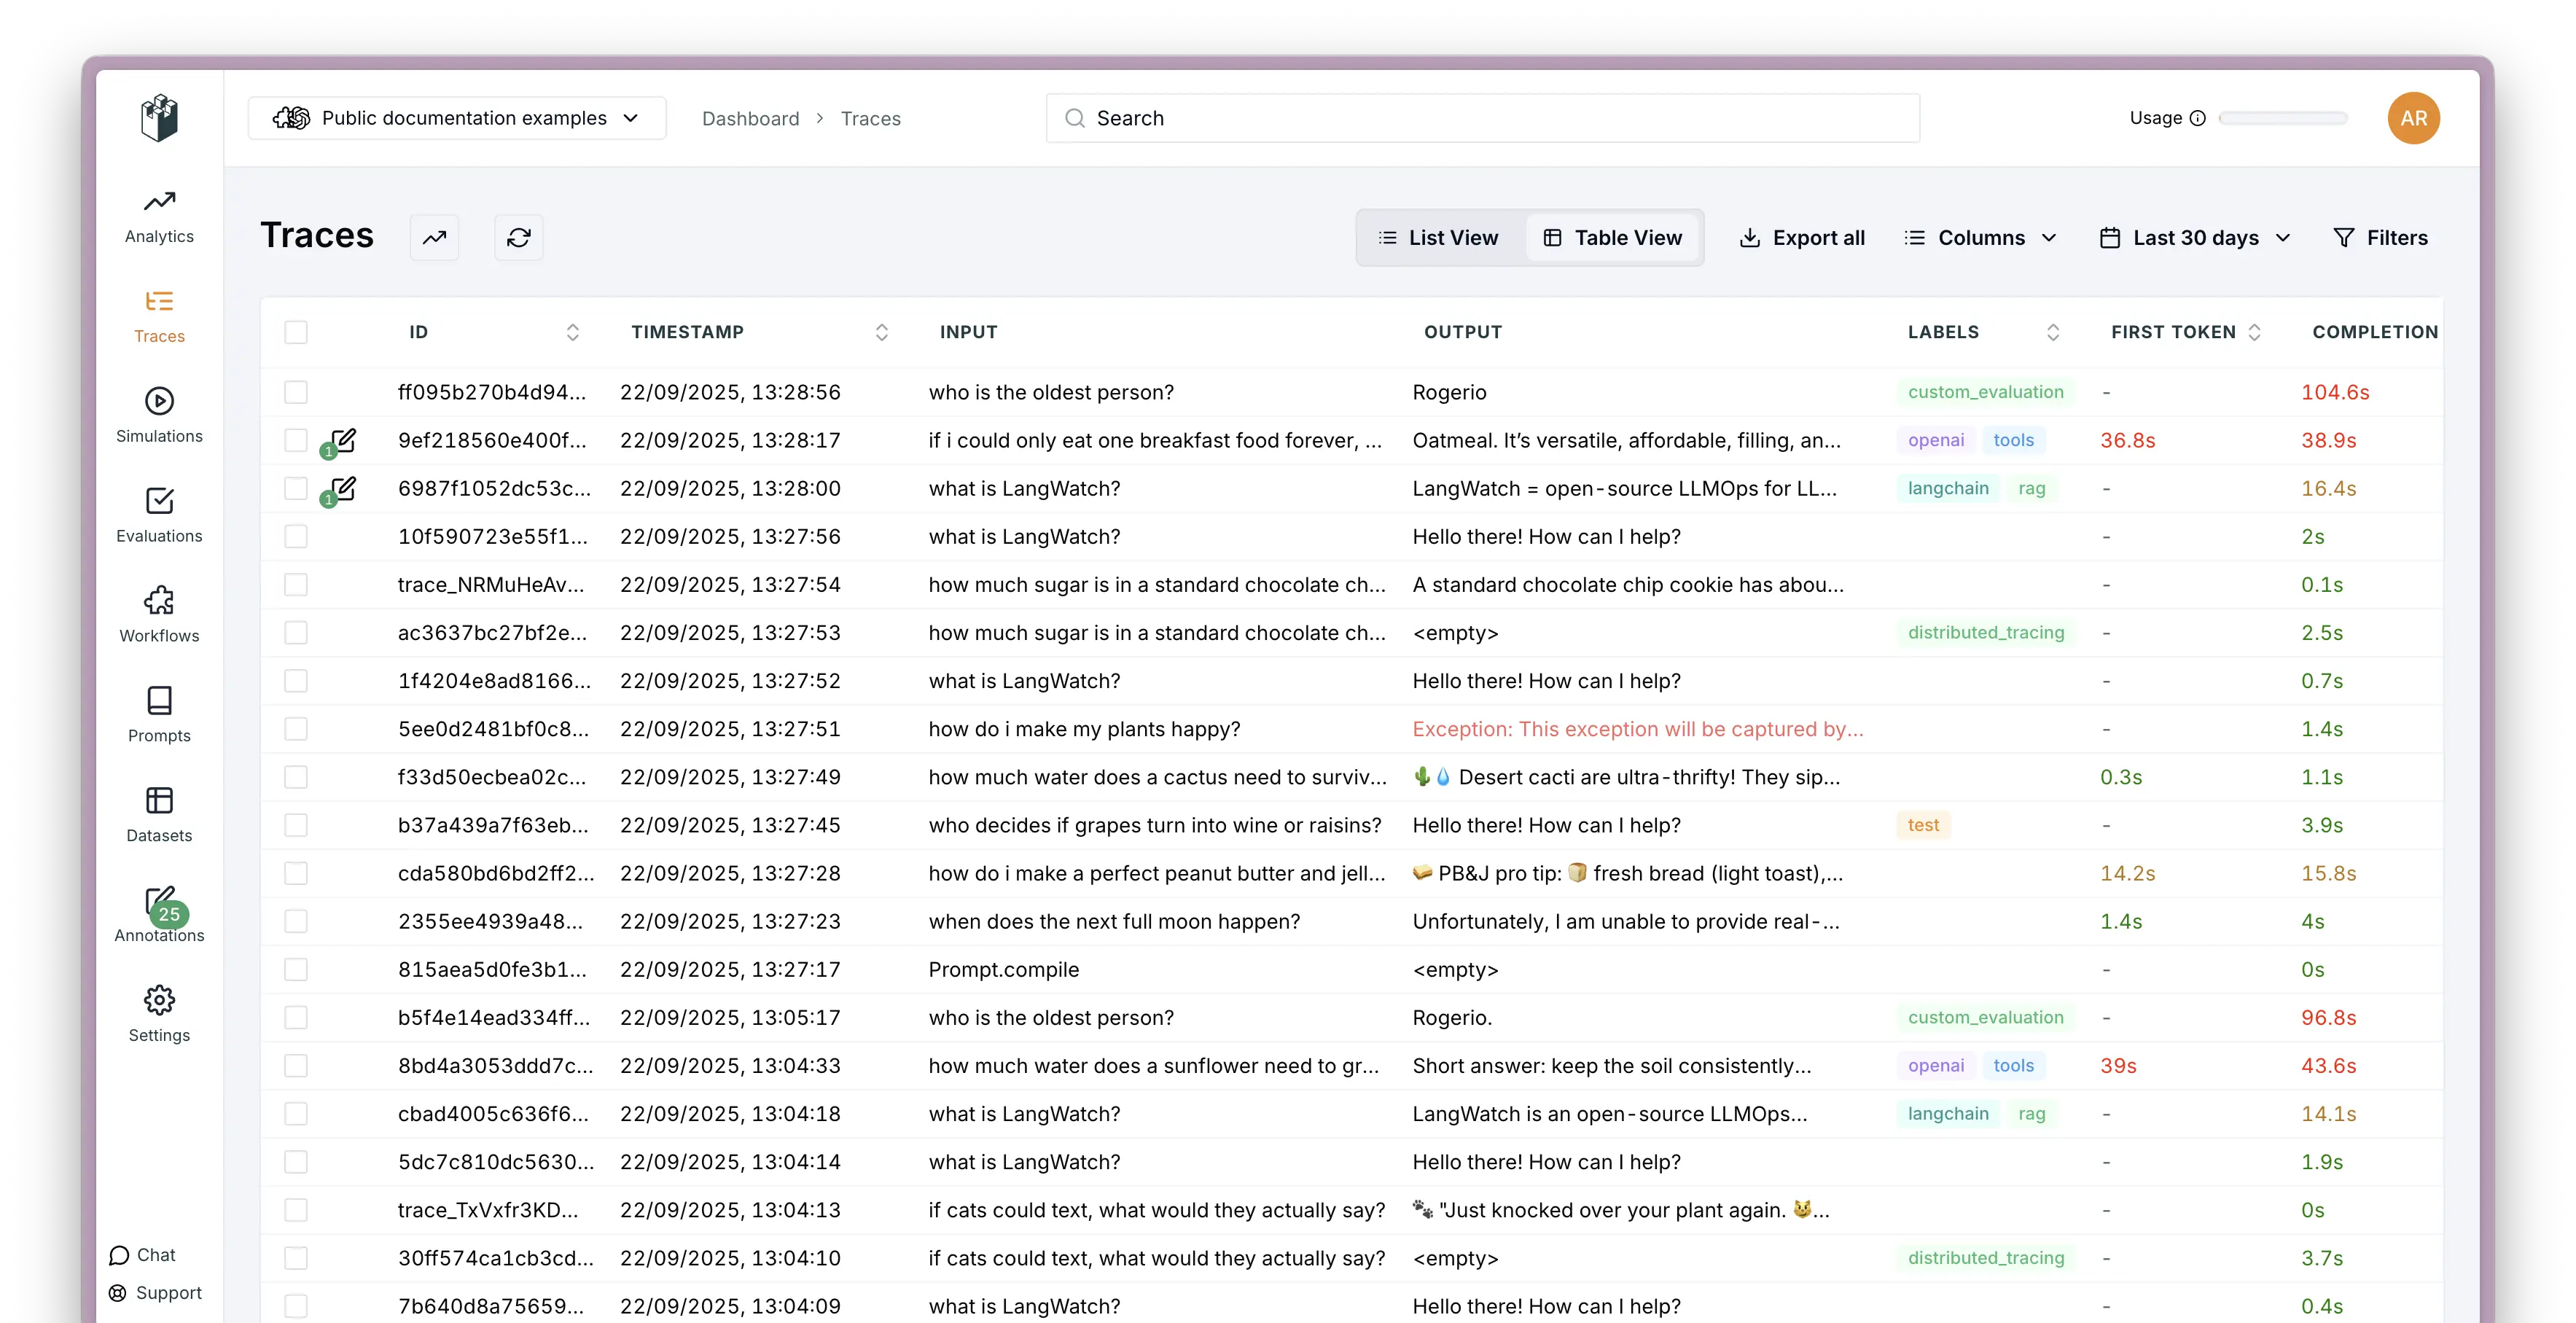
See what's happening inside your LLM applications. LangWatch tracks every interaction, helps you debug issues, and shows you how your AI systems actually work in production.
 ## Core Features
## How it works
Add a few lines to your code and LangWatch starts tracking everything:
1. **Add the SDK** - Drop in a few lines of code to your existing app
2. **We track everything** - Automatically captures all your LLM calls and interactions
3. **See it live** - Watch what's happening in real-time through the dashboard
4. **Debug easily** - Click into any trace to see exactly what went wrong
## Get started
Pick your language and start tracking:
## Core Features
## How it works
Add a few lines to your code and LangWatch starts tracking everything:
1. **Add the SDK** - Drop in a few lines of code to your existing app
2. **We track everything** - Automatically captures all your LLM calls and interactions
3. **See it live** - Watch what's happening in real-time through the dashboard
4. **Debug easily** - Click into any trace to see exactly what went wrong
## Get started
Pick your language and start tracking: