> ## Documentation Index
> Fetch the complete documentation index at: https://langwatch.ai/docs/llms.txt
> Use this file to discover all available pages before exploring further.
# Operations Console
> Monitor, manage, and debug your LangWatch event-sourcing pipeline from a single pane of glass
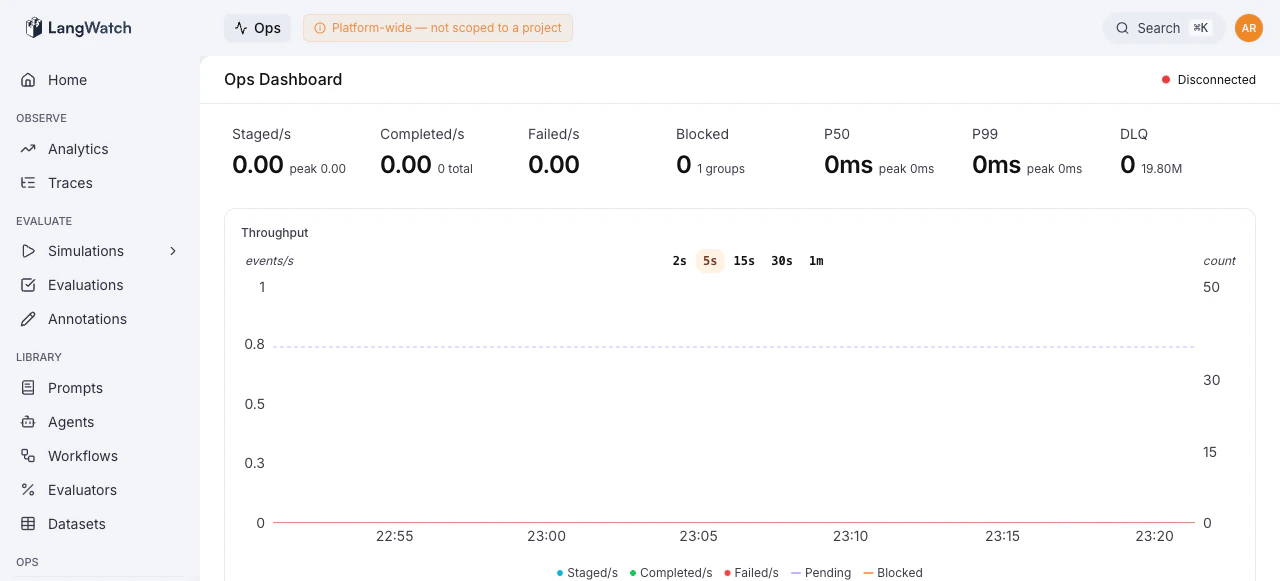
The **Ops Console** (`/ops`) is a platform-wide operations interface built for teams running LangWatch on their own infrastructure. It gives operators real-time visibility into the event-sourcing pipeline, queue health, processing throughput, error clusters, and the tools to act on problems without touching the database or restarting pods.
 ## When to Use Ops
| Scenario | Where to go |
| ---------------------------------------------- | ------------------------------------------------------------------------------------------------------------ |
| Traces aren't appearing in the UI | [Dashboard](/docs/self-hosting/ops/dashboard): check Staged/s and Failed/s rates |
| Processing is stuck | [Queue Management](/docs/self-hosting/ops/queue-management): inspect blocked groups and error clusters |
| A deployment broke a projection | [Projection Replay](/docs/self-hosting/ops/projection-replay): replay affected projections from a known-good date |
| Need to debug a specific trace or aggregate | [Deja View](/docs/self-hosting/ops/dejaview): time-travel through the event stream |
| Want to test trace ingestion against a project | [The Foundry](/docs/self-hosting/ops/foundry): build and send synthetic traces |
| Failed jobs need reprocessing | [Queue Management](/docs/self-hosting/ops/queue-management): redrive from the DLQ |
## Feature Overview
Real-time throughput, latency, error rates, and pipeline health at a glance. Powered by Server-Sent Events with automatic polling fallback.
Error groups, blocked queues, dead letter queue redriving, draining, and pipeline pause/unpause controls.
Rebuild projection state by replaying events from ClickHouse. Supports bulk replay across tenants, single-aggregate debugging, and dry runs.
Time-travel debugger for event-sourced aggregates. Inspect the full event history and compute any projection's state at any point in time.
Interactive trace playground for building, visualizing, and sending synthetic traces to any project. Useful for testing ingestion pipelines and reproducing issues.
## Access Control
The Ops Console uses two dedicated permissions, separate from project-level RBAC:
| Permission | Grants |
| ------------ | --------------------------------------------------------------------------------------- |
| `ops:view` | Read-only access to all dashboards, metrics, and search |
| `ops:manage` | Write access, unblock groups, drain queues, pause pipelines, start replays, redrive DLQ |
These are platform-wide permissions, not scoped to a specific project. Users without `ops:view` are redirected away from `/ops` routes.
See [Access Control (RBAC)](/docs/platform/rbac) for details on assigning permissions.
## Architecture Context
The Ops Console sits on top of LangWatch's event-sourcing pipeline:
```mermaid theme={null}
graph LR
Ingest["Trace Ingestion"] -->|"commands"| Redis["Redis Queues"]
Redis -->|"consume"| Workers["Workers"]
Workers -->|"events"| CH["ClickHouse"]
Workers -->|"projections"| CH
Ops["Ops Console"] -.->|"reads"| Redis
Ops -.->|"reads"| CH
Ops -.->|"actions"| Redis
```
* **Commands** enter Redis queues from the ingestion API
* **Workers** consume commands, emit events, and update projections in ClickHouse
* The **Ops Console** reads queue state from Redis and event history from ClickHouse, and can issue control actions (unblock, drain, pause, replay) back to the queues
## When to Use Ops
| Scenario | Where to go |
| ---------------------------------------------- | ------------------------------------------------------------------------------------------------------------ |
| Traces aren't appearing in the UI | [Dashboard](/docs/self-hosting/ops/dashboard): check Staged/s and Failed/s rates |
| Processing is stuck | [Queue Management](/docs/self-hosting/ops/queue-management): inspect blocked groups and error clusters |
| A deployment broke a projection | [Projection Replay](/docs/self-hosting/ops/projection-replay): replay affected projections from a known-good date |
| Need to debug a specific trace or aggregate | [Deja View](/docs/self-hosting/ops/dejaview): time-travel through the event stream |
| Want to test trace ingestion against a project | [The Foundry](/docs/self-hosting/ops/foundry): build and send synthetic traces |
| Failed jobs need reprocessing | [Queue Management](/docs/self-hosting/ops/queue-management): redrive from the DLQ |
## Feature Overview
Real-time throughput, latency, error rates, and pipeline health at a glance. Powered by Server-Sent Events with automatic polling fallback.
Error groups, blocked queues, dead letter queue redriving, draining, and pipeline pause/unpause controls.
Rebuild projection state by replaying events from ClickHouse. Supports bulk replay across tenants, single-aggregate debugging, and dry runs.
Time-travel debugger for event-sourced aggregates. Inspect the full event history and compute any projection's state at any point in time.
Interactive trace playground for building, visualizing, and sending synthetic traces to any project. Useful for testing ingestion pipelines and reproducing issues.
## Access Control
The Ops Console uses two dedicated permissions, separate from project-level RBAC:
| Permission | Grants |
| ------------ | --------------------------------------------------------------------------------------- |
| `ops:view` | Read-only access to all dashboards, metrics, and search |
| `ops:manage` | Write access, unblock groups, drain queues, pause pipelines, start replays, redrive DLQ |
These are platform-wide permissions, not scoped to a specific project. Users without `ops:view` are redirected away from `/ops` routes.
See [Access Control (RBAC)](/docs/platform/rbac) for details on assigning permissions.
## Architecture Context
The Ops Console sits on top of LangWatch's event-sourcing pipeline:
```mermaid theme={null}
graph LR
Ingest["Trace Ingestion"] -->|"commands"| Redis["Redis Queues"]
Redis -->|"consume"| Workers["Workers"]
Workers -->|"events"| CH["ClickHouse"]
Workers -->|"projections"| CH
Ops["Ops Console"] -.->|"reads"| Redis
Ops -.->|"reads"| CH
Ops -.->|"actions"| Redis
```
* **Commands** enter Redis queues from the ingestion API
* **Workers** consume commands, emit events, and update projections in ClickHouse
* The **Ops Console** reads queue state from Redis and event history from ClickHouse, and can issue control actions (unblock, drain, pause, replay) back to the queues