Four Refactors and a Funeral: Migrating a Live System to Event Sourcing
LangWatch is open source. Every commit hash in this post is real and clickable. You can see exactly how we got from A to B, including the detours, nightmares, all nighters, and occasional rapid dip into insanity.
 Alex Forbes-Reed · April 20, 2026 · Developer findings
Four Refactors and a Funeral
If you read Part 1, you know what our event sourcing system gives us. 300x faster, features in afternoons, retroactive data improvements. All very sexy.
This post is about what came before. Five months of building an event processing system in production, starting with something that worked at low scale and iterating it into something that handles 6,000 events/sec. Four meaningful refactors, each one a response to something production taught us that we couldn't have learned any other way (well, that's what we tell ourselves anyway). Also a commit with the message "actually use async inserts" which will haunt us professionally for years.
And of course, LangWatch is open source. Every commit hash in this post is real and clickable. You can see exactly how we got from A to B, including the detours, nightmares, all nighters, and occasional rapid dip into insanity.
Our core flow
One span arrives from your SDK. From that single event, the system has to:
-
Summarise the trace (fold all spans into one view)
-
Store the raw span (append to columnar storage)
-
Update your browser in real time (pub/sub to SSE)
-
Trigger evaluations (did the LLM say something batshit?)
-
Track billing (per project, per day)
-
Track SDK versions (are you on the latest? maybe that's why you have bugs)
All of that, and for every event. Events for the same trace must be processed in order, different traces process in parallel. One dodgy trace from one customer absolutely cannot hold up the entire platform, entire customer, or even some side effects of that trace.
Here's how it actually flows:
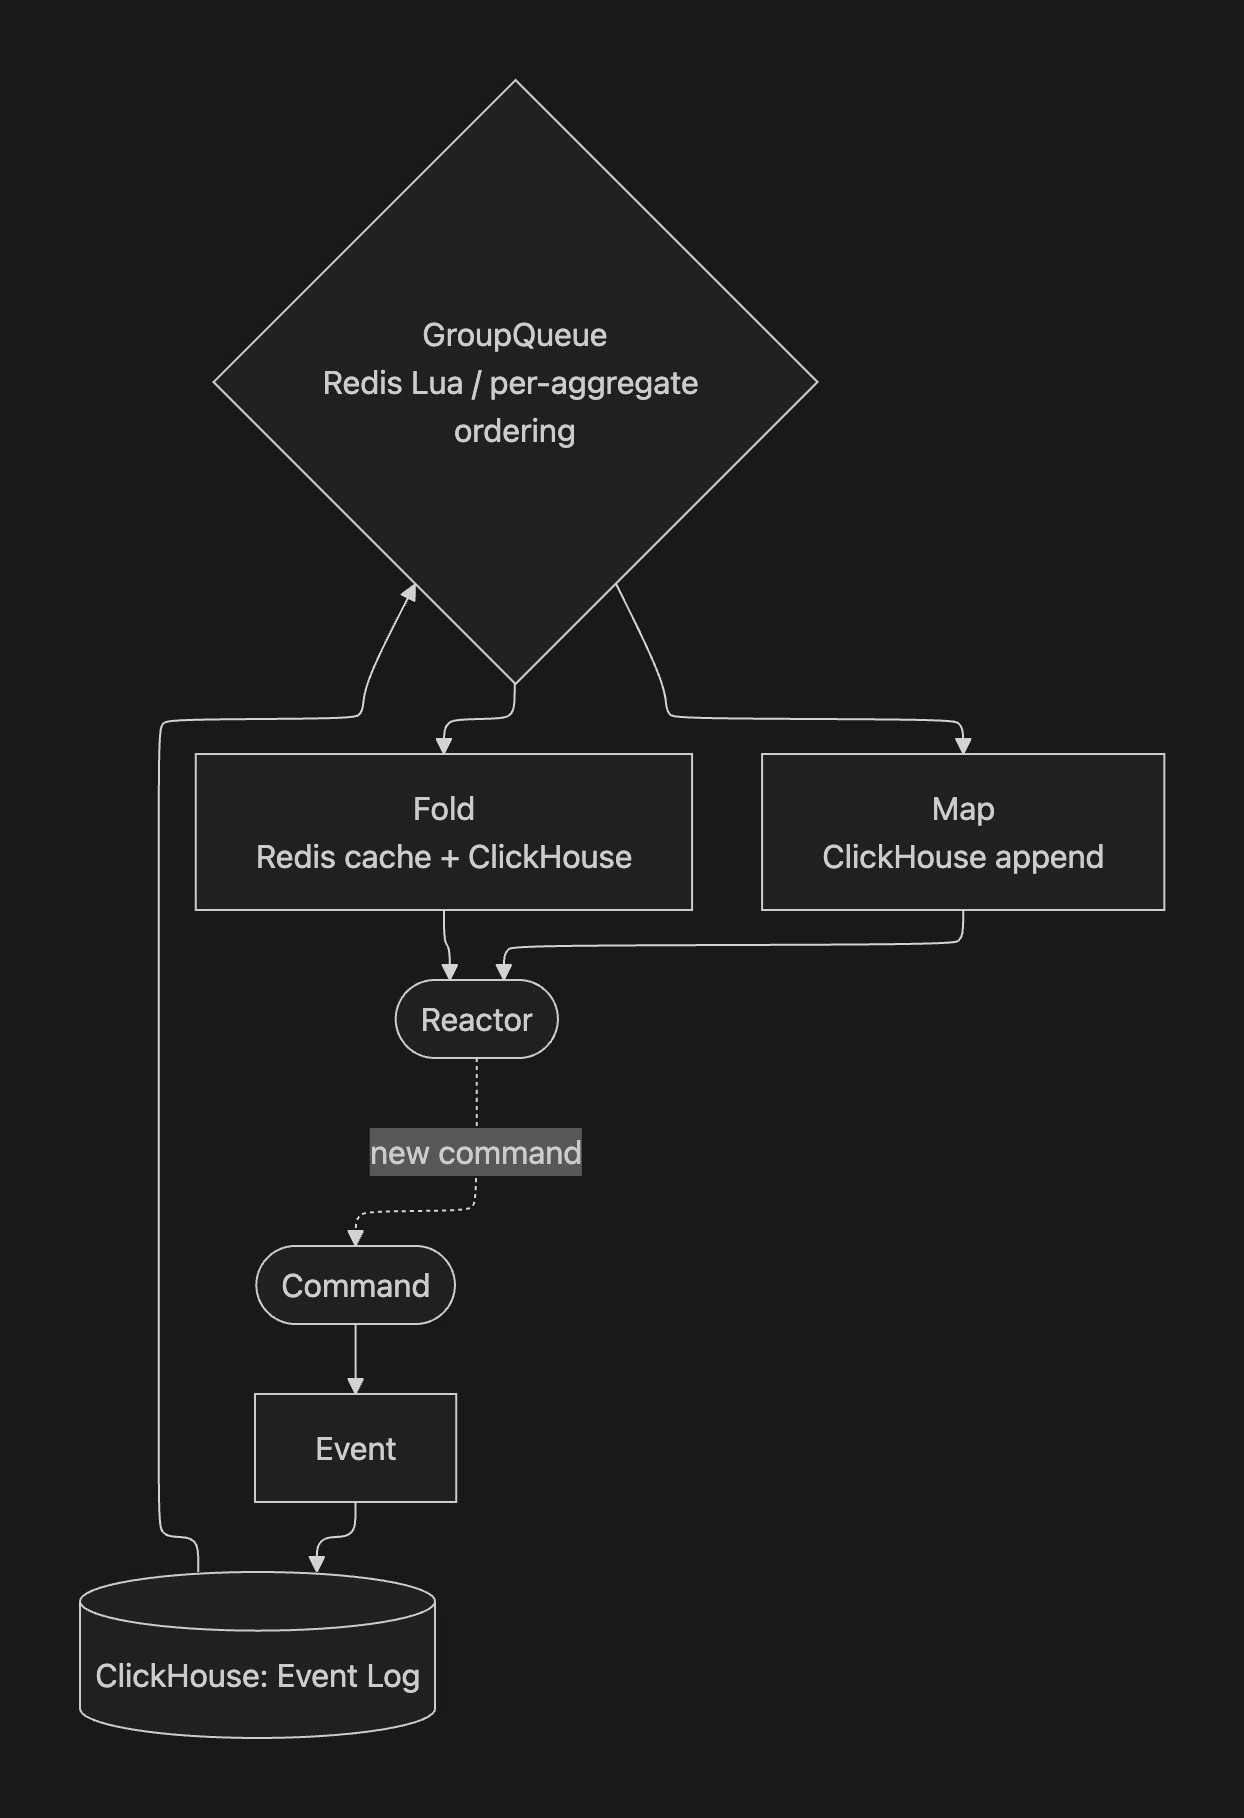
A trace arrives, the fold summarises it, and the reactor triggers an evaluation - which is itself a new command that flows through its own pipeline. The GroupQueue sits between the event store and projections, guaranteeing per-aggregate ordering while processing different aggregates in parallel.
One span in. Trace summary, span storage, live browser update, evaluation trigger, billing, SDK tracking all fan out from a single event. Everything flows through the same global GroupQueue with per-aggregate ordering.
What actually kept us up at night wasn't the throughput or the ordering guarantees. It was keeping behaviour consistent between the old system and the new one during the migration period. Customers should have no idea anything changed under them. Silent cutover or don't bother. We don't want to take the lazy migration downtime windows from those that need them.
First iteration - Checkpoint Shenanigans
November 2025 ·
1e327c88e
Initial event processing system. Checkpoints, distributed locks, full event replays.
We built an event processing system designed for the scale we had at the time. Checkpoint stores tracking the last-processed event ID per processor. Distributed SETNX locks in Redis to prevent concurrent updates. Full event replays on every projection update. Timer-based retries.
About 7,000 lines. Its own ClickHouse table (processor_checkpoints), its own Redis cache layer, its own validation system that verified ordering before processing. Over-built for a problem we didn't fully understand yet. A monument to premature abstraction.
Worked fine at five events per second, but when we started stress testing we realised this was not only a dead end, but a mummified one.
November 28 ·
19eeecfd9
"event sourcing 2, electric boogaloo" - yes, that's the actual commit message. We regret nothing. And no, sorry, we aren't hiring right now.
The funeral
February 12, 2026 ·
f0c5cbaab
6-8 uncached ClickHouse
*FINAL*queries per span. 100-640ms each. BullMQ queue depth: climbing.
Each span hitting processor_checkpoints (343K rows). The maths: 50-100 spans/sec x 6-8 queries x 100-640ms each. Queue backing up. Processing latency in minutes. Not a good look for a real-time platform.
We slapped a Redis cache on the checkpoint reads. Bought us a few hours. The architecture still required 6 database round-trips per event, and caching one of those reads doesn't change the fact that the whole design was too chatty for the throughput we needed.
That Redis cache lived for one day. Not because it was bad, but because the next morning brought a better idea.
Per-aggregate ordering without distributed locks
February 13, 2026 ·
693adf75e
Distributed locks replaced with atomic Redis Lua queue grouping.
After a good nights sleep, with fresh eyes we noticed the next thing: distributed locks are solving the wrong problem. We don't need mutual exclusion. We need ordered delivery per aggregate with parallelism across aggregates. Very, very different things.
We decided to move to a custom group queue implementation in Redis, using Lua scripts. Redis Lua scripts that atomically stage, dispatch, and complete jobs per aggregate group. All state transitions inside a single Lua eval, and Redis even gives you atomicity for free. No lock expiry timers, and no "what if the holder dies" recovery, no consensus protocol. A beautiful win for simplicity.
-- Simplified: atomically pick the next job for a group
local staged = redis.call("ZRANGEBYSCORE", groupJobsKey, "-inf", "+inf", "LIMIT", 0, 1)
if #staged == 0 then
    redis.call("ZREM", readyKey, groupId)
    return nil
end
local jobId = staged[1]
redis.call("ZREM", groupJobsKey, jobId)
redis.call("SET", activeKey, jobId)
return jobId
Thousands of groups processing in parallel. Same aggregate strictly ordered. If a group exhausts retries, it gets blocked individually. Not the entire queue, not other customers, just that one aggregate. Requires operator action to unblock (more on the tooling we built for this later).
The concurrency tuning that followed:
| Date | Concurrency | Notes |
|---|---|---|
| Feb 13 | 20 | Conservative. Fresh wounds. |
| Feb 24 | 40 | Seems fine. |
| Feb 27 | 120 | Why not. |
| Mar 1 | 300 | We're flying mate. |
| Mar 2 AM | 500 | Full send. |
| Mar 2 PM | 100 | Right, let's make this configurable. |
Two weeks from cautious to reckless to "never discuss the 500 incident again."
Fold, map, react
February 15, 2026 ·
c2b808bbf
~7,000 lines removed. Checkpoint system deleted entirely.
The old "event handlers" were doing three different jobs in one messy abstraction. Accumulating state, transforming events, triggering side effects. All of which are established patterns in event sourcing, so let’s adopt rather than re-invent. We split it into three primitives that each do exactly one thing.
Fold projections accumulate state. Load current state, apply the new event, store the result. Left fold, state lives in ClickHouse.
const traceSummaryFold: FoldProjection<TraceSummaryState, SpanReceivedEvent> = {
  init: () => ({ spans: [], totalCost: 0, totalDuration: 0 }),
  apply: (state, event) => ({
    ...state,
    spans: [...state.spans, event.payload.span],
    totalCost: state.totalCost + (event.payload.span.cost ?? 0),
    totalDuration: Math.max(state.totalDuration, event.payload.span.duration),
  }),
};
Map projections are stateless. One event in, one record out. Full parallelism. Span storage is a map: normalise the event, append to stored_spans.
Reactors are side effects that fire after a fold succeeds. If the fold fails, reactor never fires. Evaluation trigger only dispatches if the trace summary actually stored. No half-states.
The fold state itself becomes the resume point. This means we can avoid having a checkpoint table, and separate tracking. If the system crashes mid-flight, next event loads last stored fold state and carries on with no need for additional orchestration or storage. The 7,000 lines we removed were all checkpoint/lock/validation infrastructure that stopped being necessary once the fold/map split existed.
Declarative, TypeSafe, Gorgeous: a pipeline definition
This is what the trace processing pipeline actually looks like when you wire it all together:
export function createTraceProcessingPipeline(deps: TraceProcessingPipelineDeps) {
  return definePipeline<TraceProcessingEvent>()
    .withName("trace_processing")
    .withAggregateType("trace")

    // Fold: accumulate spans into a trace summary
    .withFoldProjection("traceSummary", new TraceSummaryFoldProjection(deps.traceSummaryFold))

    // Maps: stateless per-event writes
    .withMapProjection("spanStorage", new SpanStorageMapProjection(deps.spanStorageMap))
    .withMapProjection("logRecordStorage", new LogRecordStorageMapProjection(deps.logRecordStorageMap))
    .withMapProjection("metricRecordStorage", new MetricRecordStorageMapProjection(deps.metricRecordStorageMap))

    // Reactors: fire after traceSummary/spanStorage projection succeeds
    .withReactor("traceSummary", "originGate", deps.originGateReactor)
    .withReactor("traceSummary", "evaluationTrigger", deps.evaluationTriggerReactor)
    .withReactor("traceSummary", "traceUpdateBroadcast", deps.traceUpdateBroadcastReactor)
    .withReactor("traceSummary", "projectMetadata", deps.projectMetadataReactor)
    .withReactor("traceSummary", "simulationMetricsSync", deps.simulationMetricsSyncReactor)
    .withReactor("traceSummary", "experimentMetricsSync", deps.experimentMetricsSyncReactor)
    .withReactor("spanStorage", "spanStorageBroadcast", deps.spanStorageBroadcastReactor)

    // Commands: the entry points
    .withCommand("recordSpan", RecordSpanCommand)
    .withCommand("assignTopic", AssignTopicCommand)
    .withCommand("resolveOrigin", ResolveOriginCommand)
    .withCommand("addAnnotation", AddAnnotationCommand)
    .build();
}
One pipeline. One fold, three maps, seven reactors, four commands. These are the ingredients needed to create the perfect trace processing pipeline. Adding a new feature means adding one more .withReactor() or .withMapProjection() call. We have six pipelines total, currently: traces, evaluations, experiments, simulations, suite runs, and billing.
TypeScript does a lot of heavy lifting here
We lean on generics pretty aggressively. The pipeline builder accumulates type information as you chain methods, so by the time you call .build(), TypeScript knows exactly what projections exist, what commands are registered, and what payload types they accept.
A few things the compiler catches for us:
You can't attach a reactor to a projection that doesn't exist. The .withReactor() method constrains its first argument to the union of fold and map names already registered on that builder. Write .withReactor("nonexistent", ...) and TypeScript rejects it at compile time.
Command payloads are typed end-to-end. Each .withCommand("recordSpan", RecordSpanCommand) accumulates the name and payload type into a union. After registration, pipeline.commands.recordSpan is typed as (data: RecordSpanData) => Promise<void>. Pass the wrong shape and it fails at compile time.
Event types are closed unions. Each pipeline is parameterised with a discriminated union:
type TraceProcessingEvent =
  | SpanReceivedEvent
  | TopicAssignedEvent
  | LogRecordReceivedEvent
  | OriginResolvedEvent
  | AnnotationAddedEvent;
You can't send an evaluation event into the trace pipeline. The generic <TraceProcessingEvent> on definePipeline flows through to every fold, map, and reactor definition. Wrong event type = compile error.
Fold state threads through the entire chain. FoldProjectionDefinition<State, Event> ensures init() returns State, apply() accepts and returns State, and the store reads/writes State. Different shape from what the store expects? Compile error.
Branded types for domain primitives. TenantId isn't just a string:
export const TenantIdSchema = z
  .string()
  .trim()
  .min(1, "[SECURITY] TenantId must be a non-empty string")
  .brand<"TenantId">();
It's string & { __brand: "TenantId" }. You can't pass a plain string where a TenantId is expected without going through validation. Compile-time enforcement of tenant isolation.
Projections type the store interface too. A fold projection's store must implement get() and store() for the exact state type. A map projection's store must implement append() for the exact record type. The ClickHouse stores handle the translation between TypeScript types and ClickHouse's column types (PascalCase columns, codec hints, nullable handling), but the type boundary is at the store interface. If ClickHouse returns something that doesn't match the expected state shape, you find out at the store layer, not three layers up in a reactor.
The result: when you wire up a new pipeline, TypeScript guides you through it. Missing a handler? Compile error. Wrong state shape? Compile error. Wrong payload? Compile error. It's a second pair of eyes that never gets tired and never approves a dodgy PR out of politeness.
The 1970 incident
The type system catches a lot. It does not, however, catch you returning 0 from an init() function for a date field.
Our fold projections start with an initial state. For trace summaries, that includes timestamps. The init() function was returning 0 for date fields (a reasonable TypeScript default for "no value yet"). ClickHouse stores that as 1970-01-01. Which is fine, until you remember our partitioning: PARTITION BY toYearWeek(OccurredAt).
Suddenly we had merge parts being created in the 1970 partition. Our TTL policy says anything older than 30 days goes to cold storage on S3. 1970 is considerably older than 30 days. So these parts were immediately getting shipped off to S3 the moment they were written.
Then the next fold event arrives for that aggregate, tries to read the state back, and ClickHouse has to fetch it from S3. What was a 0.3ms Redis cache hit (or a 100ms local ClickHouse read) became a multi-second S3 retrieval. For every single new trace until the fold state got a real timestamp.
The fix was straightforward: init() returns the current timestamp instead of zero. But the incident taught us that ClickHouse's partitioning, TTL policies, and storage tiers interact in ways that TypeScript can't protect you from. Your type system might be perfect and your data can still end up on another continent.
Reactors killed the outbox star ☢️
If you've built event-driven systems before, you've probably wrestled with the outbox pattern. Write state + "things to do next" in one transaction, poll the outbox, execute entries. Works, but polling is grim and that's another table to look after.
Reactors give the same guarantee without the polling. Projection router dispatches reactors inline after a successful fold store. Each reactor gets its own group queue job with hierarchical keys (so it can't block the fold for the same aggregate), its own dedup, its own retry.
February 24 ·
35017cb76
Billing meter was dispatching BullMQ jobs from inside a map projection. Quietly committing crimes.
Replaced it with a reactor on the billing fold. Side effect fires after state is persisted. Not during. Not maybe. After.
April 6 ·
b4377cd4e
BullMQ fully dead. Scenario execution, evaluation dispatch, all replaced by reactors.
One less piece of infrastructure. One less thing to page about. One less dashboard to check at 3am (though we built quite a good dashboard for the event sourcing system itself, more on that later).
One queue, two roles, no cups
February 27 ·
00795de77
Per-pipeline queues collapsed into single global queue. CQRS formalised.
Trace processing, evaluations, experiments, simulations: all had their own queues. Each needing separate concurrency config, monitoring, scaling. Silly.
Single global queue with typed job routing. And with that came the CQRS split:
// Web process: dispatch commands only
const app = createApp({ role: "web" }); // consumerEnabled=false

// Worker process: consume projections and reactors
const app = createApp({ role: "worker" });
Web processes stage jobs in Redis but never consume them. Workers do the actual event processing. Scale them independently. When a group gets stuck or a reactor is misbehaving, you can see exactly what's happening in the queue inspector (again, more on our ops tooling next time).
The migration: dual-write, migrate, flag, switch
The subtitle of this post says "migrating a live system." Here's how we actually did that without customers noticing.
Phase 1: dual-write. Every incoming event writes to both the old Elasticsearch-based system AND the new event sourcing pipeline. Both systems process the same data, produce the same outputs. The old system still serves all reads. The new system writes into ClickHouse but nobody's looking at it yet.
Phase 2: verify. Compare outputs. Are the trace summaries identical? Are evaluations triggering the same way? Are the billing numbers matching? This is the boring bit that takes the longest. You find edge cases. Timezone handling. Null vs undefined. Fields that the old system populated implicitly that the new system needs to handle explicitly.
Phase 3: migrate. Once we knew the new data was going in correctly, we migrated the old elastic search code over, converting into events, and building projections. This took days, elastic search was very very unhappy.
Phase 4: feature flag per project. A read flag on each project that switches which backend the API queries from. Roll it out to internal projects first, then a few friendly customers, then gradually everyone. If something's wrong, flip the flag back. Instant rollback, no deployment needed.
Phase 5: turn off the old write path. Once all projects are reading from the new system and everything's been stable for a few weeks, remove the dual-write. The old code becomes dead code. Delete it.
The whole process took about six weeks from first dual-write to full cutover. The bit that took the longest wasn't the code. It was building confidence that the new system produced identical behaviour. Every discrepancy needed investigating. Some were bugs in the old system that we'd never noticed, some were bugs introduced by the dual writing process itself. I would say that process was not as smooth as we had planned…
ClickHouse as an event store
We'd been on Elasticsearch. It worked, in the way that using a hammer on a screw works if you're determined enough. ES is built for full-text search and document retrieval. We were using it for time-series analytics, high-throughput event ingestion, and aggregation queries. It was telling us, politely but firmly, to sod off and use something else.
ClickHouse was a deliberate choice:
Columnar storage and time-series queries. Analytics dashboards need to scan millions of rows across a handful of columns. ClickHouse does this obscenely fast. The dashboards went from "please wait" to instant.
Storage policies and tiered TTL. ClickHouse has built-in storage policies that let you offload data to S3 once it goes cold. Completely transparent to queries. We can set TTL per customer, so enterprise plans with longer retention just work without separate infrastructure.
Append-only writes. Event sourcing is appending immutable facts. ClickHouse's MergeTree engine is built for this workload. It's absurdly good at appending. We need some special handling for fold projections (ReplacingMergeTree deduplicates older versions in the background), but that's straightforward.
The event_log table is plain MergeTree(). Append-only. Events are facts. Write once, never touch.
Projection tables use ReplacingMergeTree(VersionColumn). Fold writes a new row with a higher version, ClickHouse deduplicates eventually. Just INSERT. Database handles the rest.
CREATE TABLE trace_summaries (
    TenantId String CODEC(ZSTD(1)),
    TraceId String CODEC(ZSTD(1)),
    LastUpdatedAt DateTime64(3) CODEC(Delta(8), ZSTD(1)),
    TotalDurationMs Int64 CODEC(Delta(8), ZSTD(1)),
    SpanCount UInt32 CODEC(ZSTD(1)),
    -- ...
) ENGINE = ReplacingMergeTree(LastUpdatedAt)
PARTITION BY toYearWeek(OccurredAt)
ORDER BY (TenantId, TraceId)
ORDER BY starts with TenantId. Every table. No exceptions. Tenant isolation as the primary sort key means queries hit contiguous data on disk.
Partitioning: weekly for most tables, monthly for billing. Without the partition key in your WHERE clause, ClickHouse scans everything including cold storage on S3. 100ms queries become 1-2 seconds. We found this out when our analytics helper was filtering on CreatedAt (insertion time) instead of OccurredAt (the actual partition key). Looked correct. Performed terribly.
The async insert situation
March 1, 2026 ·
745a1a83c
Commit message: "actually use async inserts"
I wish I could tell you this was some deep ClickHouse configuration subtlety, or at least some config merge mess causing inconsistent behaviour, however reality is often much less exciting.
We had wait_for_async_insert: 1 in our client settings. This tells ClickHouse to "Wait for the async insert to complete before returning." What we didn't have: async_insert: 1. The flag that enables async inserts. The actual feature. Nice one, i’ll go start updating my CV i guess.
We will never live this down, frankly we shouldn't. And well, thanks to git (and our most gracious humility…) we can’t.
The replica consistency crisis
March 27-29, 2026 · three days, four attempts
Trace summaries randomly resetting to empty. No error. No crash. Just gone.
Fold projections read current state from ClickHouse before applying the next event. With async inserts and multiple replicas, reads could hit a node that hadn't replicated the previous write yet. Stale read, apply event on top of empty state, store that. Silently losing every field set by earlier events.
Intermittent, the best kind of bug to investigate. This was thankfully caught quite quickly once we started looking for the culprit, although it was still extremely difficult to debug due to the init being used seemingly randomly. We do now however store the last known event id on every projection, which provides both a guarantee on data writes, as well as a nice debug path for us to follow in the future.
Attempt 1 ·
a3c5009ce·*select_sequential_consistency*
Force replicas to confirm they're caught up before reads. Result: 10-14 second latency. Absolutely not.
Attempt 2 ·
d2203b436· Quorum writes
*insert_quorum=2. Writes replicate to two nodes before returning. Better. Slow. Doesn't generalise.*
Attempt 3 ·
70179fbe0· Primary replica routing
Route fold reads/writes to same node. Env var naming in one commit:
*CLICKHOUSE_MASTER_URL*(loaded),*CLICKHOUSE_WRITE_URL*(unclear),*CLICKHOUSE_PRIMARY_REPLICA_URL*(fine, ship it, it's late).
The fix ·
6b3d058f3· Redis write-through cache
109 lines. 0.3ms reads. 133x faster than hitting ClickHouse.
The RedisCachedFoldStore. Here's the sequence for a fold step:
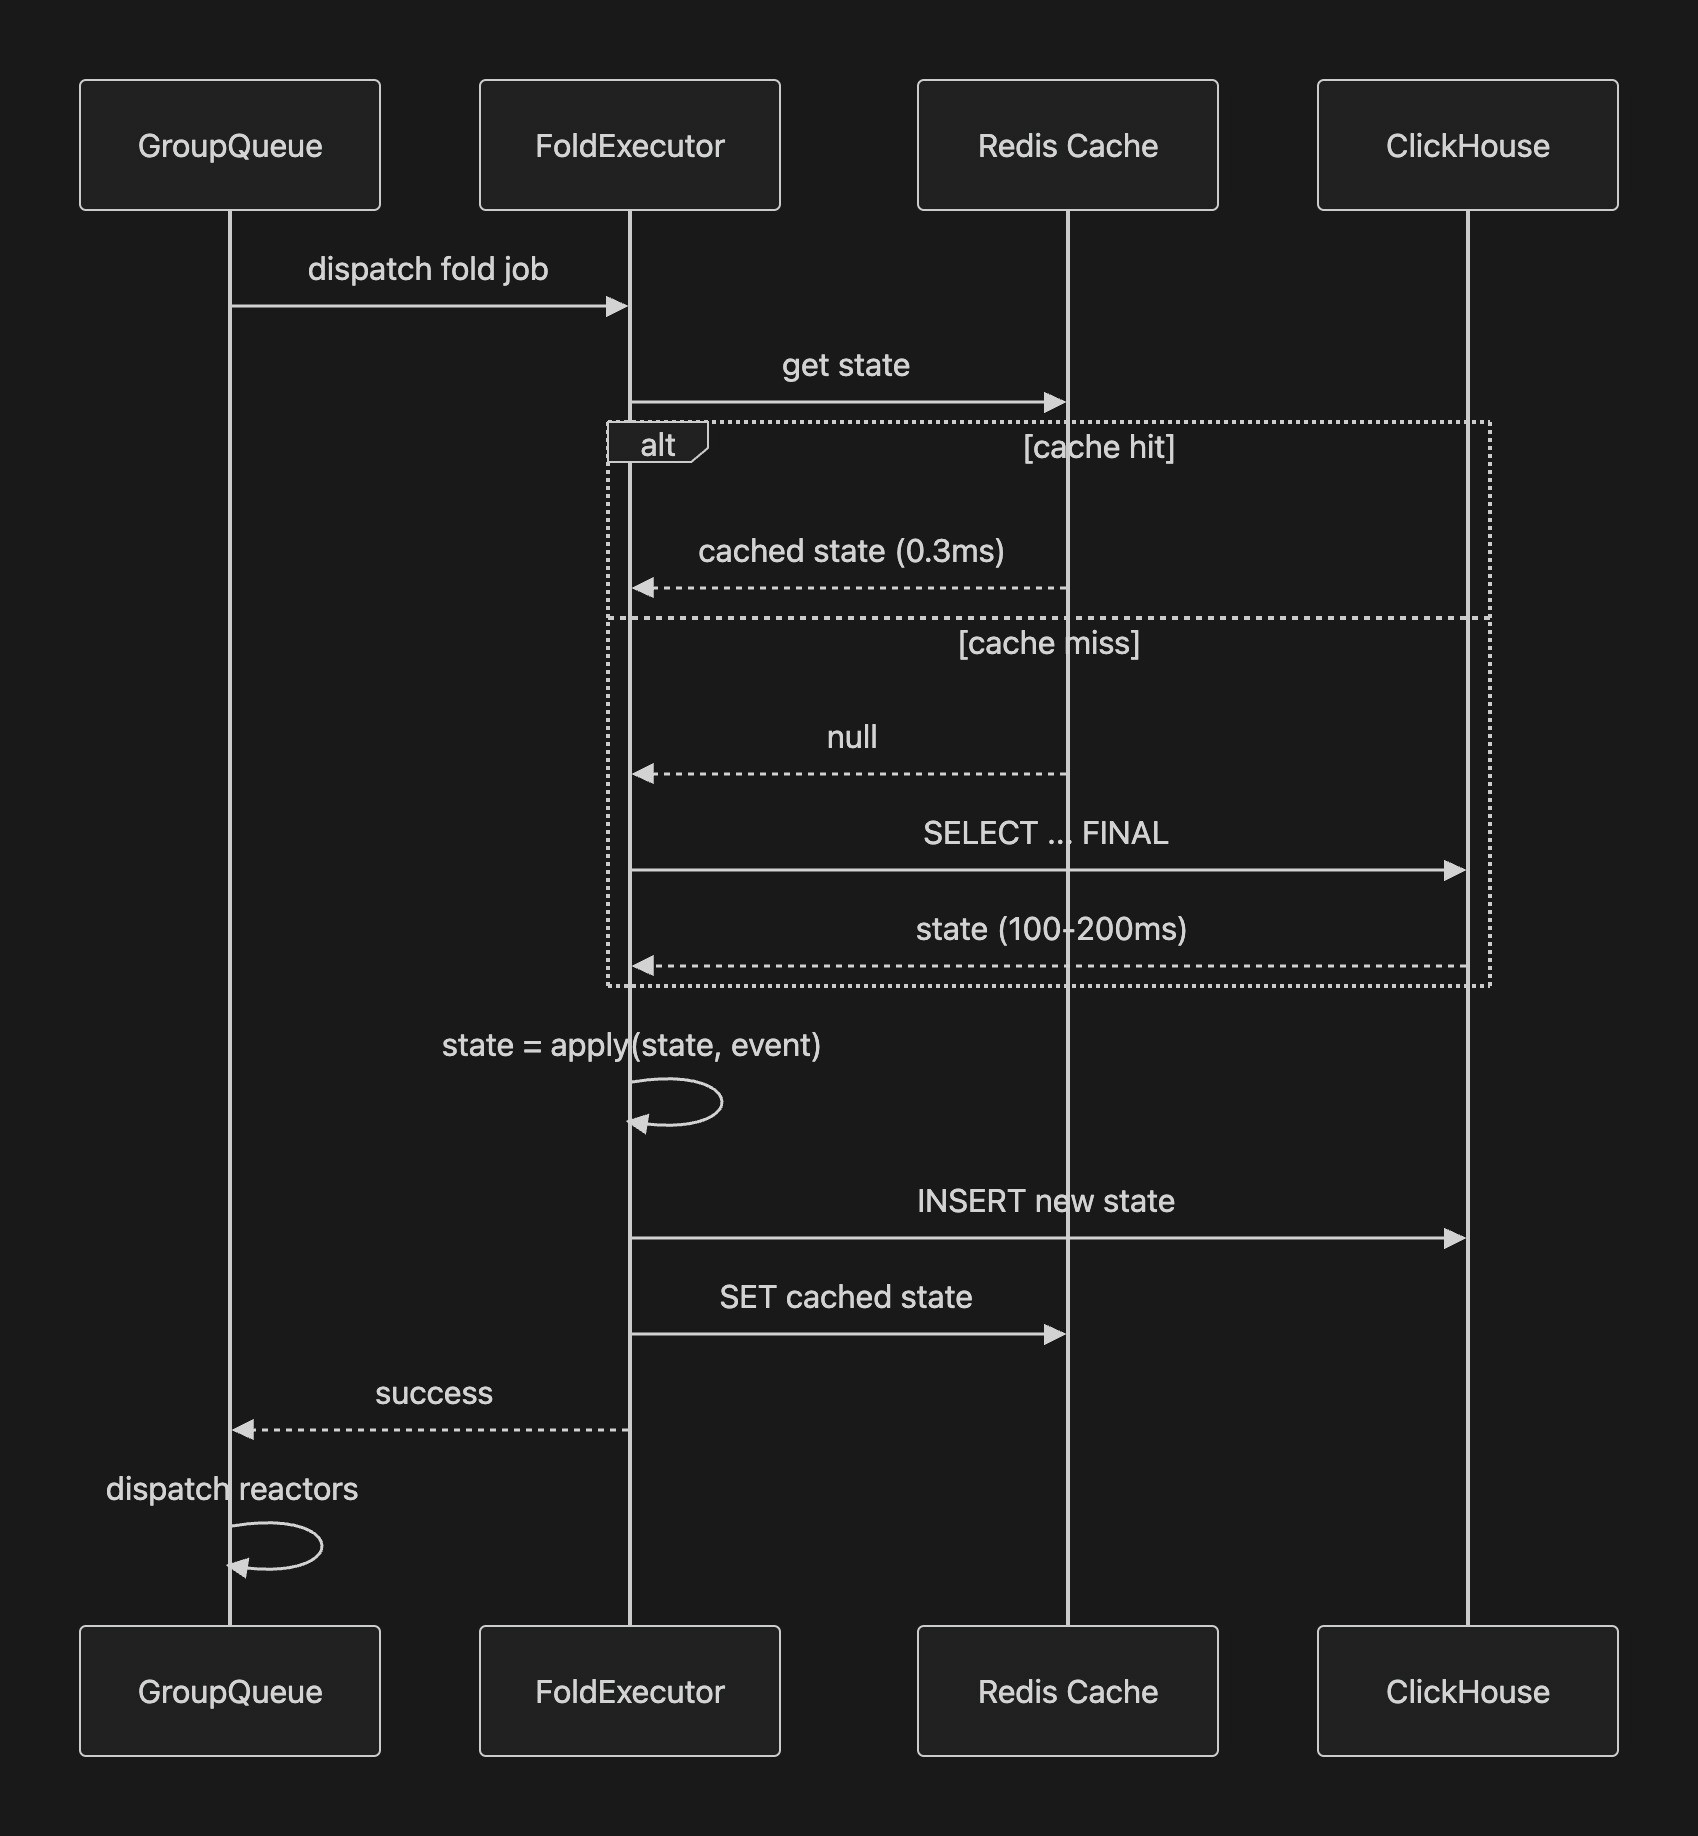
get() hits Redis first, falls back to ClickHouse on miss. store() writes ClickHouse first (throws on failure), then Redis.
async get(key: FoldKey): Promise<State | undefined> {
  const cached = await this.redis.get(this.redisKey(key));
  if (cached) return JSON.parse(cached);
  const state = await this.innerStore.get(key);
  if (state) await this.redis.set(this.redisKey(key), JSON.stringify(state));
  return state;
}
Per fold step: ~200ms down to ~1.5ms (133x). Six-span trace: ~1.2s down to ~9ms. Also flipped wait_for_async_insert from 1 to 0, letting ClickHouse batch INSERTs. Parts-per-trace: 6 down to 1.
Took us three days to arrive at something that's obvious in hindsight. Although to be honest, a lot of that time was a lively discussion between myself and our glorious leader CTO, about wether it was correct to have this layer. Strong opinions, ideally loosely held.
When things go wrong
Well done for making it this far though, i wouldn’t wish this much reading of something i’d written on my worse enemy. But here you are, and as you’ve come this far i can assume you’re in the targeted technical audience, so i know what you’re wanting to know next… what happens on failure?
The group queue has three outcomes for any job: complete, retry, or block.
Retry uses exponential backoff. First failure retries after 1 second. Then 2, 4, 8, up to a configurable maximum. Each retry re-stages the job in Redis with an incremented attempt counter and a delay score. The group stays active, other jobs for that aggregate wait behind the retry.
Block happens when a job exhausts all retry attempts. The group gets removed from the ready set. No more jobs dispatch for that aggregate. But crucially, only that aggregate blocks. Every other group in the system continues processing normally. One bad trace cannot take down the platform.
Blocked groups require operator intervention. You inspect the failed job (what event, what error, what state), fix the underlying issue (deploy a code fix, correct bad data, whatever), then unblock the group. Processing resumes from where it stopped. The tooling for this is... a whole separate blog post.
We also classify errors. Transient ClickHouse errors (connection timeouts, replica lag) are marked recoverable and always retry. Application errors (malformed event, schema violation) block immediately because retrying won't help.
April 6 ·
9bb6d575a· Classify transient ClickHouse errors as recoverable to prevent group blocking.
Before this commit, a ClickHouse timeout would exhaust retries and block the group. After: it retries indefinitely with backoff until ClickHouse recovers. Small change, big difference in production resilience.
The group queue keeps evolving
Continuously tuned since February. The more interesting production learnings:
March 10 ·
88c9b9cb0· Score flattening + random offset
We'd been using sqrt(pendingCount) for priority scores. Trace groups had scores of 8-42, evaluation groups sat at 1. Evaluations starved. Replaced sqrt with flat 1. Pure round-robin.
Same commit: ten workers all scanning the ready set from index 0, all fighting over the same top 600 groups. Random start offset per worker. Throughput roughly tripled.
March 11 ·
4e56e0f46· Hierarchical group keys
Keys became ${tenantId}/${jobPath}/${domainKey}. Job path mirrors the pipeline tree: fold/traceSummary/reactor/evaluationTrigger. A slow reactor gets its own position. Can't block the fold for the same aggregate. Before this, one hanging evaluation would block all trace processing for that tenant.
April 6 ·
2b505a126· Re-fold on out-of-order events
Late-arriving spans (clock skew, network delays). When an event arrives with occurredAt earlier than what we've already processed, the executor reloads all events and replays the fold from init(). Brute force, correct by construction.
Replay: making old data retroactively better
Part 1 mentioned that we can replay your entire history through new logic. Here's how that actually works.
Say we improve the trace summary fold. Better cost calculation, smarter input extraction, whatever. In a traditional system, that improvement only applies to new data. Old traces are stuck with the old logic forever.
With event sourcing, the raw events are the source of truth. The projections are derived views that can always be rebuilt. So we built a replay system.
April 2 ·
657faf726· Projection replay CLI with pause-based drain and batch writes.
The replay process:
-
Pause live processing for the target projection. New events still get stored in the event log, they just queue up.
-
Drain any in-flight jobs for that projection. Wait for them to complete.
-
Replay from the event log. Load all historical events for the relevant aggregate type, feed them through the updated projection logic in batches (5,000 events per batch, 20 concurrent aggregates).
-
Resume live processing. The queued events now process through the new logic too.
The result: every trace in the system gets the benefit of the improvement, not just new ones. Customers don't need to re-send anything. Their historical data just gets better.
We use this for bug fixes too. Find a fold bug that's been producing slightly wrong cost calculations for two weeks? Fix the fold, replay the affected projection, done. No "sorry, your old data is wrong forever" conversations.
April 16 ·
de1234ba5· Map projection replay with marker-based deferral.
Map projections got their own replay path shortly after. Same idea: pause, drain, replay, resume. Different mechanism because maps are stateless (just re-transform and re-append rather than re-fold).
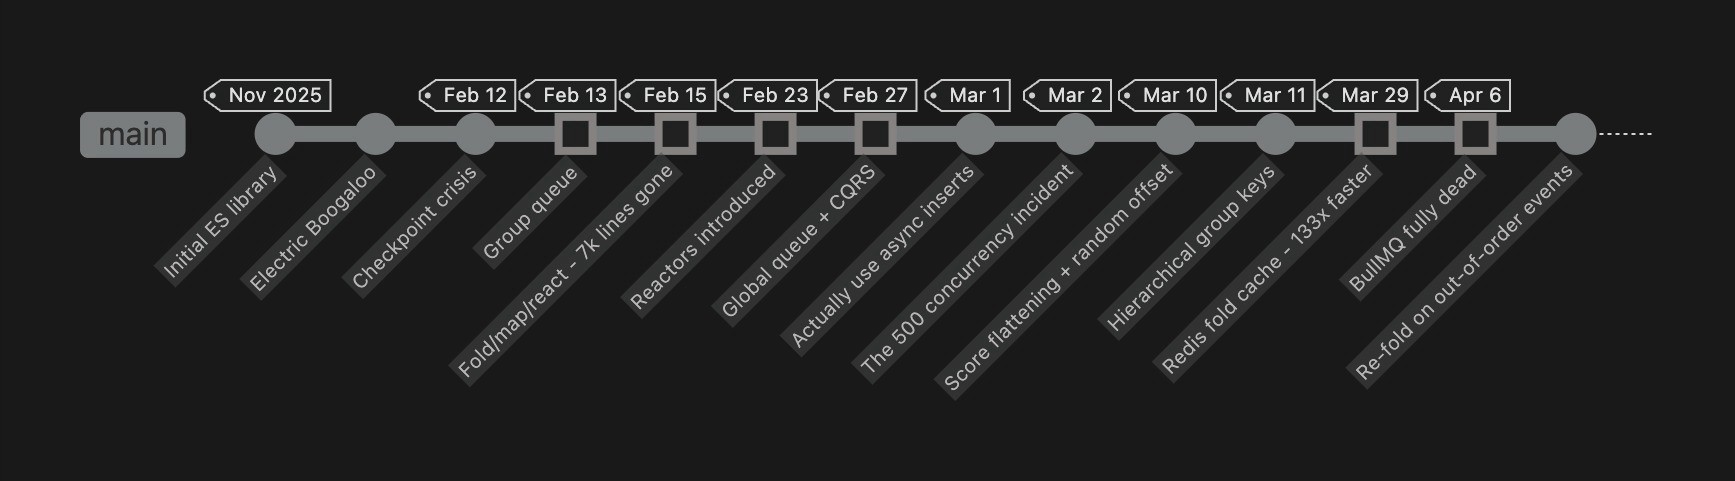
The commit trail
For the git archaeologists:
| Date | Hash | What happened |
|---|---|---|
| Nov 17, 2025 | 1e327c88e | First event sourcing library. |
| Nov 28, 2025 | 19eeecfd9 | "Electric boogaloo" rewrite |
| Feb 12, 2026 | f0c5cbaab | Checkpoint crisis. |
| Feb 13 | 693adf75e | Group queue. |
| Feb 15 | c2b808bbf | Fold/map/react. 7,000 lines gone. |
| Feb 23 | b0048b8df | Reactors. Dual-write begins. |
| Feb 27 | 00795de77 | Global queue. CQRS. |
| Mar 1 | 745a1a83c | "Actually use async inserts" |
| Mar 2 | 999c3ed25 | The 500 concurrency incident |
| Mar 10 | 88c9b9cb0 | Score flattening, random offset |
| Mar 11 | 4e56e0f46 | Hierarchical group keys |
| Mar 29 | 6b3d058f3 | Redis fold cache. 133x faster. |
| Apr 6 | b4377cd4e | BullMQ fully dead. |
| Apr 6 | 2b505a126 | Re-fold on out-of-order events |
The current system is about a third of the size of the first version and handles 300x the throughput.
Signing off
The codebase is at github.com/langwatch/langwatch under src/server/event-sourcing/. Lua scripts, fold stores, reactor dispatch, pipeline definitions. Commit hashes above are real. Go judge our git history, we can take it.
Next up: ops tooling. We built an internal tool called Skynet (now rolled into the app as the operations dashboard) for real-time pipeline throughput, group queue inspection, failed job management, and replay controls. You cannot run one of these systems without seeing inside it. That post is about how we made it visible.
Put this into production with LangWatch.
Trace your agents, run evaluations, and turn failures into repeatable tests.
Frequently asked questions
- How do you migrate a live system to event sourcing without downtime?
- LangWatch used a five-phase approach: dual-write to both old and new systems, verify outputs match, migrate historical data, switch reads behind a per-project feature flag for instant rollback, then turn off the old write path.
- What are fold, map, and reactor projections?
- Folds accumulate state by applying each event, maps are stateless one-event-in one-record-out transforms, and reactors are side effects that fire only after a fold succeeds, which avoids half-states without an outbox table.
- How does the system guarantee per-aggregate ordering?
- A custom group queue built on atomic Redis Lua scripts gives strict ordering within each aggregate while processing thousands of aggregates in parallel, so one bad trace blocks only its own group, not the platform.
- Why move from Elasticsearch to ClickHouse?
- Elasticsearch is built for full-text search, but LangWatch needed time-series analytics, high-throughput ingestion, and aggregations. ClickHouse's columnar storage, append-only MergeTree engine, and tiered TTL fit event sourcing far better.