LLM observability: What is it and why it matters
What is LLM observability, and why is agent observability becoming critical for the future of AI systems?
 Manouk Draisma · August 14, 2025 · Integrations
Large Language Models (LLMs) have evolved from simple chatbots to complex, multi-step systems that search knowledge bases, call APIs, and make autonomous decisions. But this power creates new problems.
LLMs are probabilistic and unpredictable. Two identical inputs can produce different outputs. A single query might trigger multiple prompts, API calls, and reasoning steps. When something breaks, finding the cause becomes guesswork.
Traditional monitoring tells you something went wrong. LLM observability detects issues and gives you the data to debug them quickly so you can continuously improve quality.
What is LLM observability?
LLM observability is the practice of capturing, analyzing, and visualizing all signals from your AI system: prompts, context, responses, metadata, errors, latency, and evaluation metrics to fully understand how it behaves.
It answers the questions that matter:
-
Why did the model give this answer?
-
What context or tool call influenced the decision?
-
How is behavior changing over time?
-
Where are the bottlenecks or failure points?
LLM observability goes beyond simple logging. It provides structured visibility into the reasoning process, decision points, and data flows that determine AI system behavior. This visibility becomes essential as systems grow more complex and autonomous.
As agents become the default way to orchestrate AI, agent observability is emerging to handle the added complexity of autonomous workflows.
Why LLM observability matters
LLM applications’ complex architecture, non-deterministic behavior, and deployment challenges make observability a necessity, not a luxury. Most production LLM applications rely on complex, chained, or agentic calls to foundation models. Without observability, pinpointing the source of issues becomes guesswork, especially when problems are buried deep in multi-step pipelines.
1. Non-deterministic outputs
LLMs produce different answers to identical inputs based on context, temperature, or model updates. This unpredictability becomes dangerous in factual or regulated scenarios. Observability helps detect behavioral drift before users notice.
2. Complex pipelines
A single query passes through multiple prompts, retrieval calls, database lookups, tool executions, and model invocations. One failing step derails everything. Observability lets you trace requests end-to-end to locate failures quickly.
3. Compliance requirements
In finance, healthcare, and legal industries, hallucinations aren't embarrassing - they're compliance violations. Observability provides audit trails that explain exactly how decisions were made.
4. Security vulnerabilities
Prompt injection attacks can bypass safeguards and extract sensitive information. Without monitoring, these attacks go undetected. Observability identifies when and how prompts are being manipulated.
5. Prompt and response variance
Different users can receive vastly different responses to the same question that vary in accuracy, tone, and completeness. Observability measures these inconsistencies and provides data to improve reliability.
Core components of LLM observability
LLM observability captures four critical elements:
-
Traces & spans: Every prompt, tool call, and model invocation
-
Structured metadata: User context, input parameters, feature flags
-
Metrics: Latency, token usage, error rates, performance trends
-
Evaluations: Automated and human-in-the-loop checks for correctness, safety, and relevance
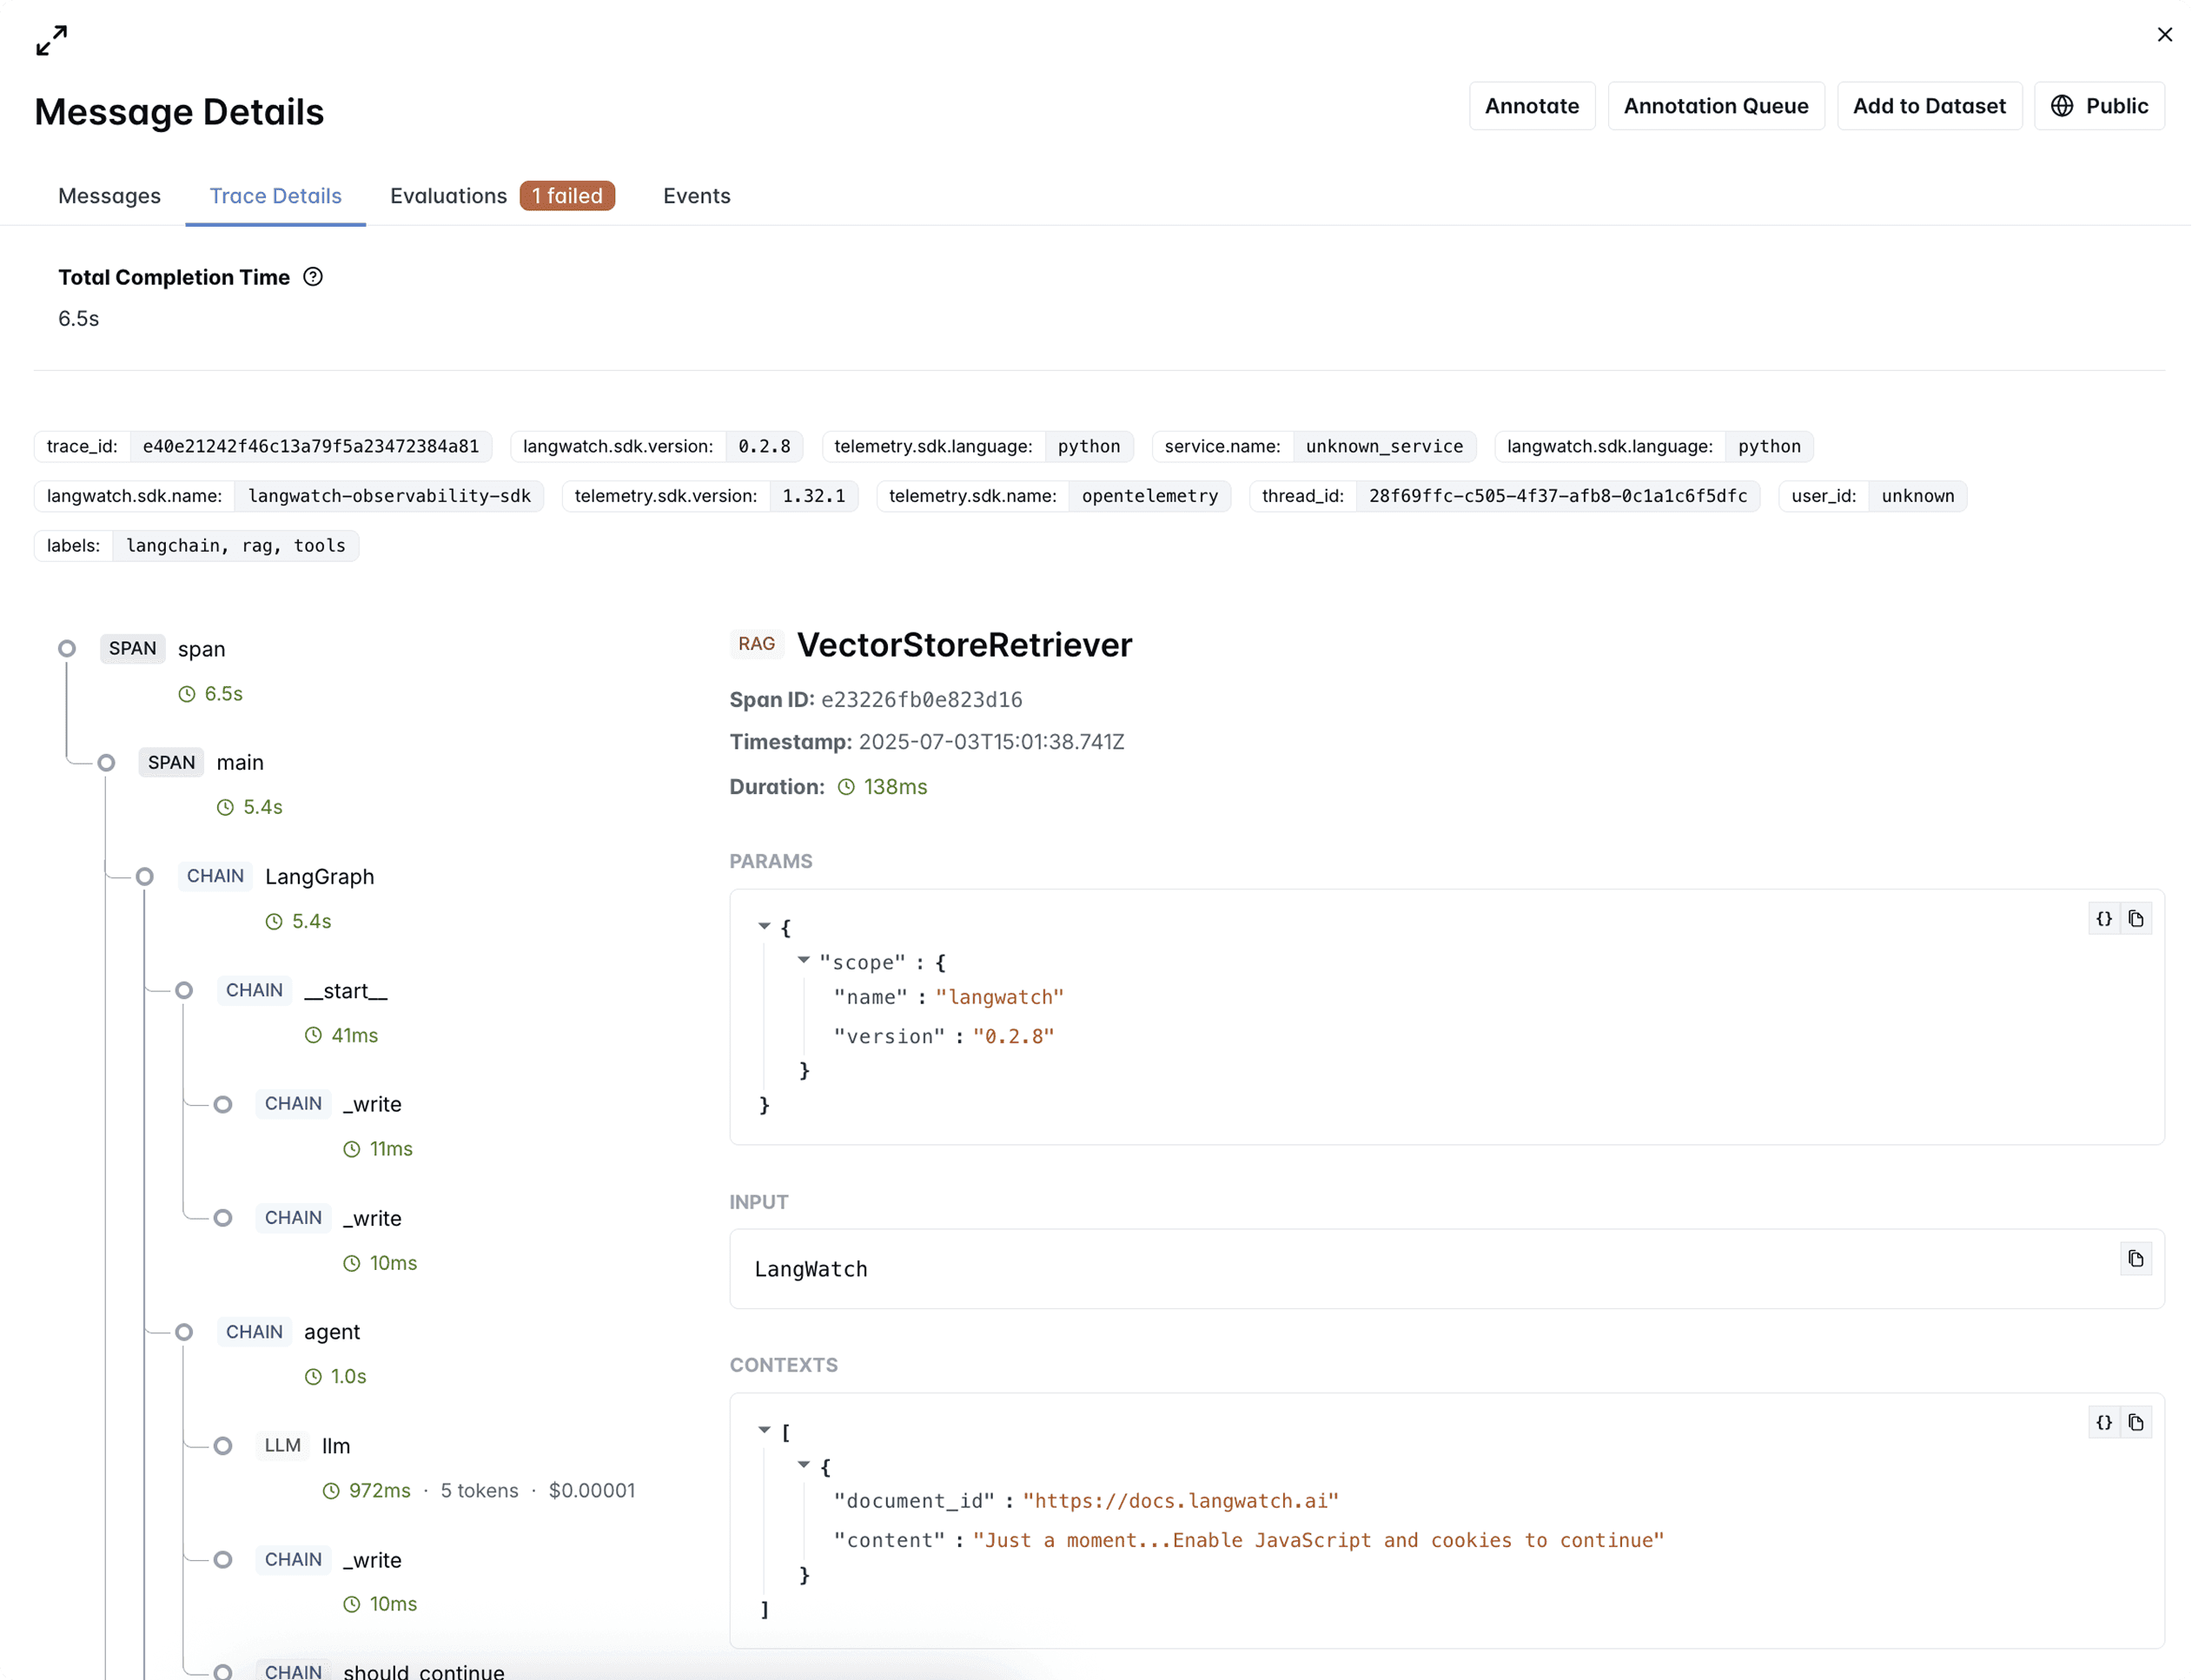
1. Traces and spans
When a request moves through your system, it follows a complex path. It calls models, queries databases, and chains through functions before producing output.
Tracing captures this entire journey, providing a step-by-step map of what happened.
A trace contains spans - time slices where specific operations run (LLM completion, database query, tool call).
A trace is made up of spans:
-
A span is a slice of time where a specific operation runs (an LLM completion, a database query, or a tool call).
-
Each span has timing data, structured logs, and attributes to add context.
For LLM systems, spans allow you to:
-
Analyze latency at each stage
-
Track cost tied to specific model calls
-
Link model outputs with downstream system performance
With traces and spans, debugging goes from guesswork to seeing exactly where and why something failed.
2. Instrumentation standards
Effective tracing requires proper instrumentation:
OpenTelemetry (OTel) - Industry standard for collecting application telemetry
OpenInference - Open-source framework for AI-specific telemetry, including prompts, completions, and reasoning steps
By integrating OpenInference with OTel, you can:
-
Gather detailed, structured traces across models, frameworks, and vendors
-
Export them to collectors and visualization tools
-
Standardize attributes so all your telemetry is consistent and searchable
LangWatch supports OTel and OpenInference natively. Whether you’re using LangChain, CrewAI, DSPy, or a custom framework, you get complete vendor-agnostic observability.
-
Business-driven observability
Technical visibility is only half the story. Business-driven observability connects telemetry with real outcomes:
-
Where do conversations break down?
-
When does user frustration build?
-
Which issues block task completion?
Combining tracing with evaluation helps teams filter for failing scenarios and focus on high-impact problems.
4. Evaluations: Systematic quality assessment
While traces show you what happened and metrics tell you how fast it happened, evaluations determine whether what happened was actually good.
Unlike traditional software testing with deterministic assertions, LLM evaluations assess probabilistic outputs where "correct" can vary significantly while still being valid.
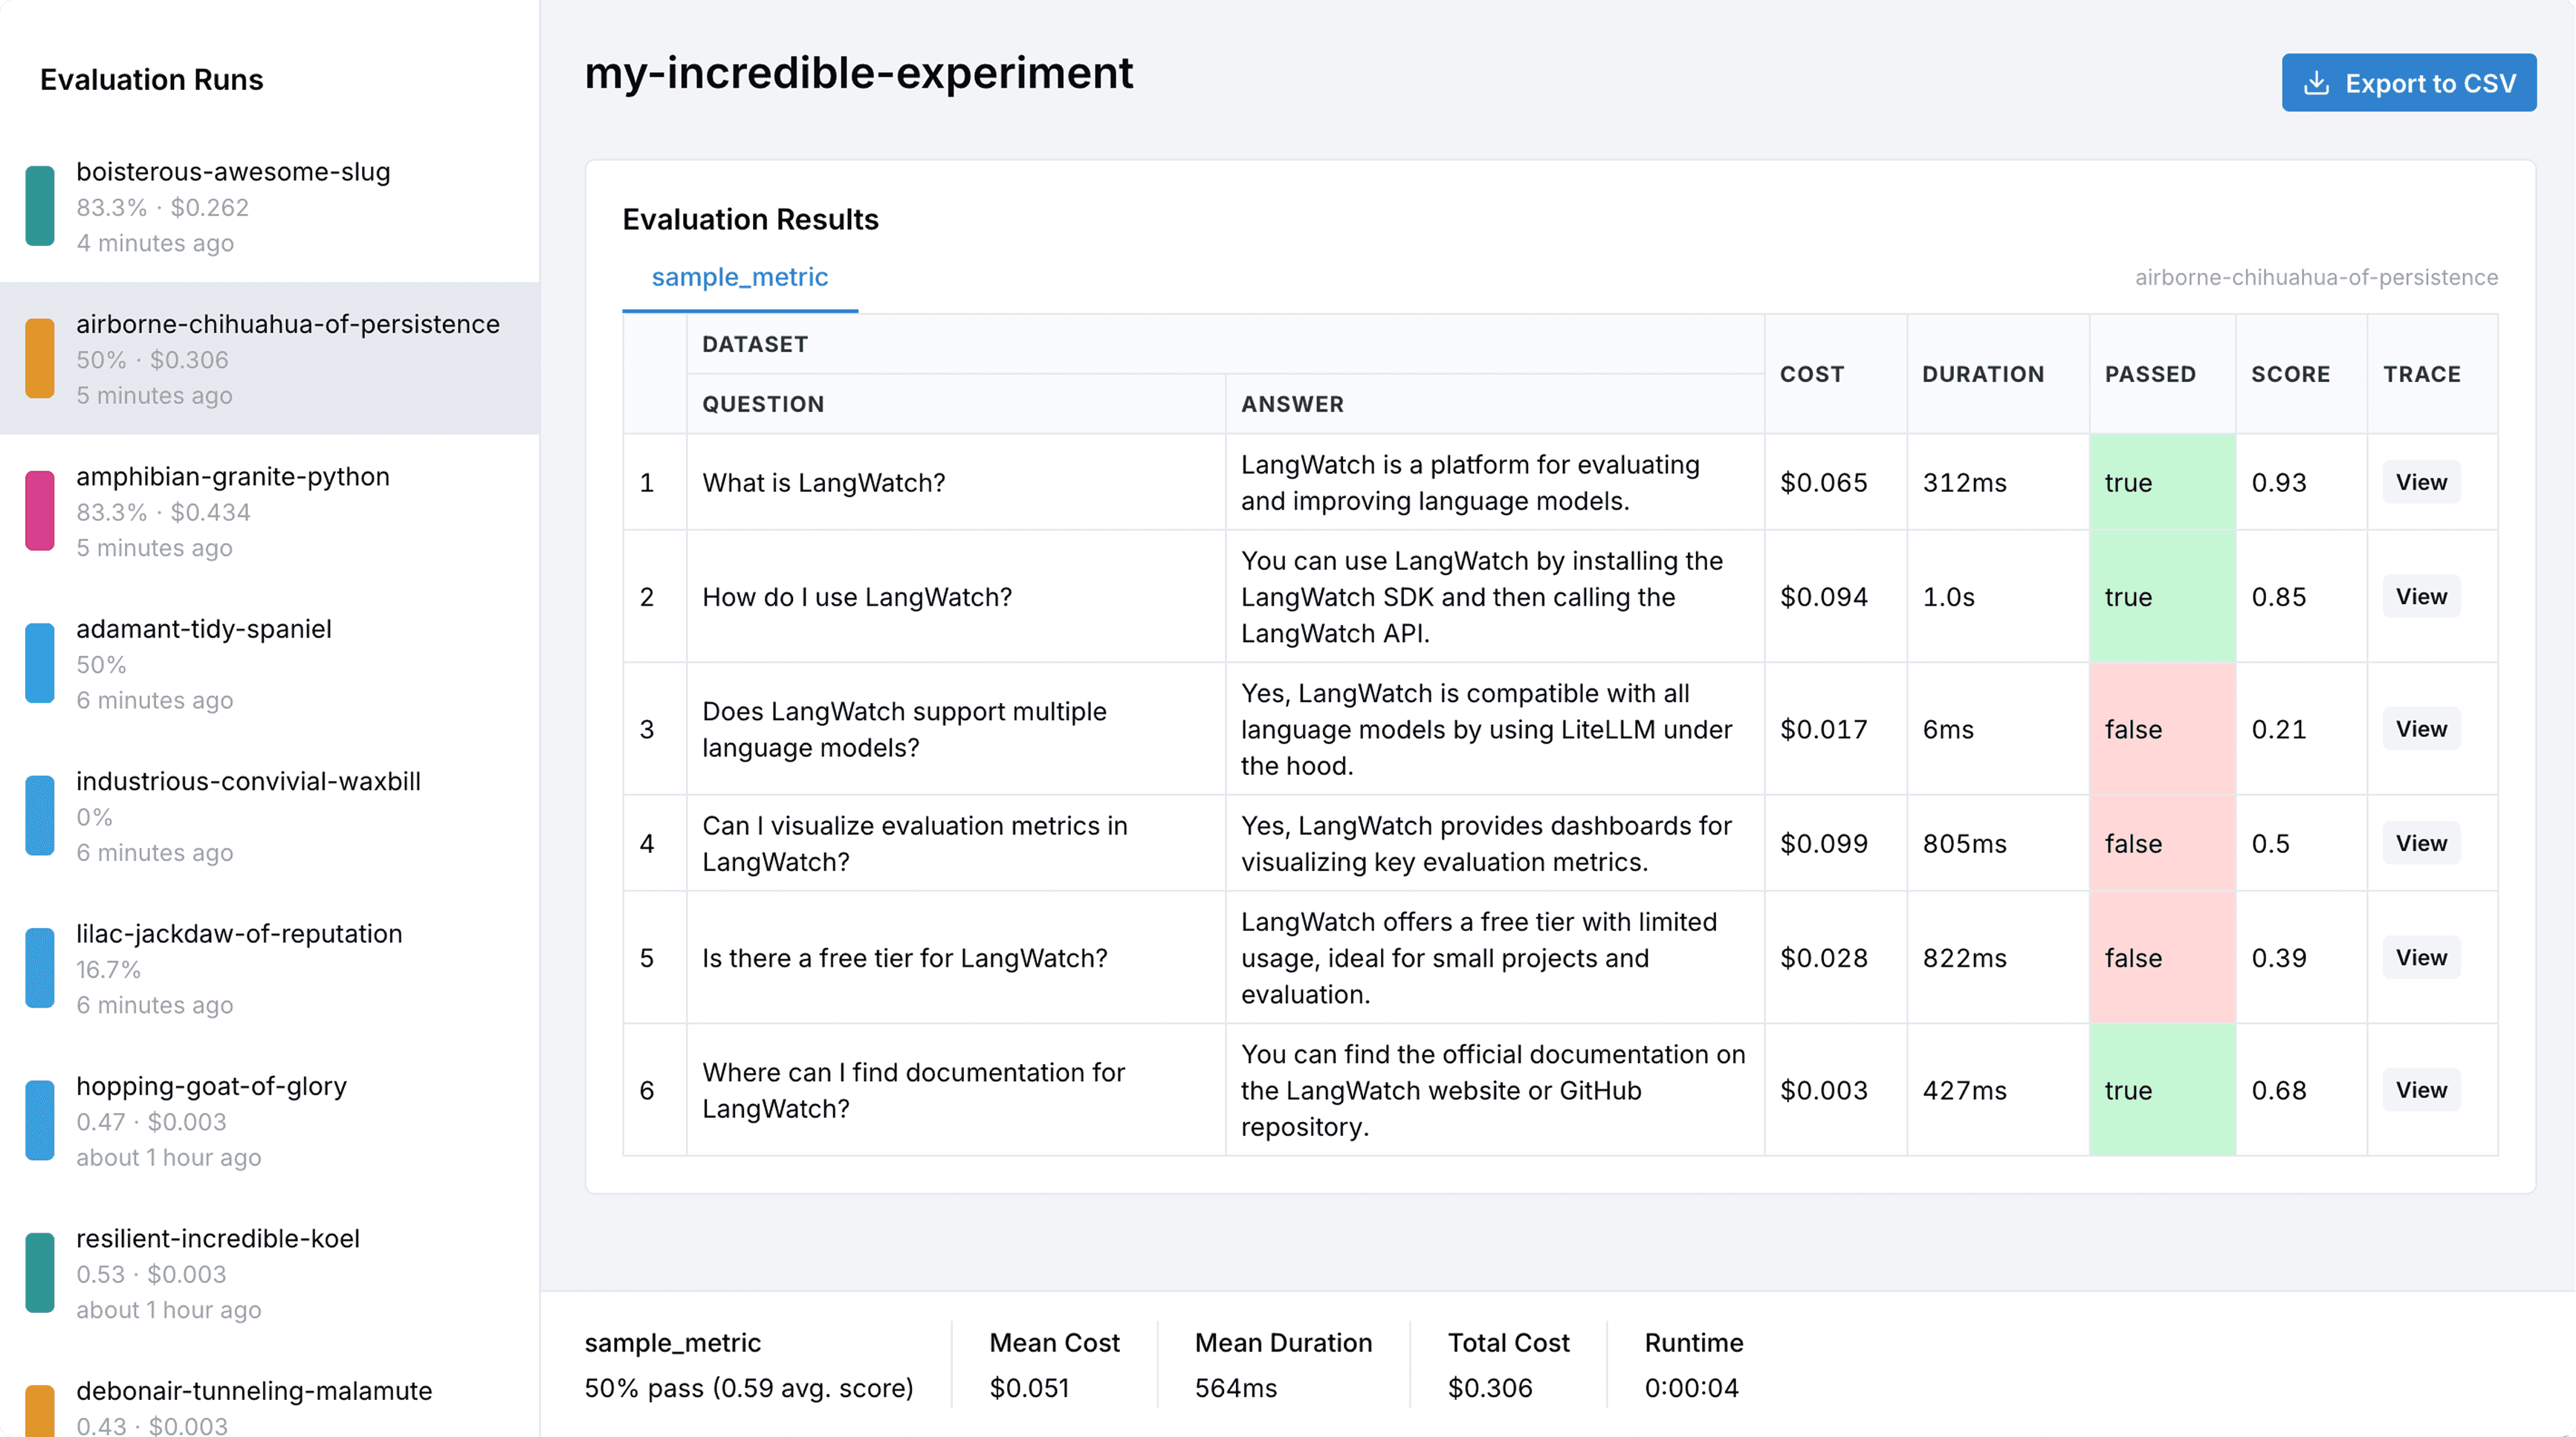
Evaluations include automated checks for factual accuracy, safety, and format compliance, business logic assessments for task completion and brand alignment, and human-in-the-loop reviews for contextual appropriateness and domain expertise.
Modern evaluation systems run continuously in production, providing real-time quality scoring, threshold monitoring, and trend analysis. They integrate with tracing data to enable span-level assessment and root cause analysis when quality issues emerge.
Agent observability: The next frontier
While LLM observability covers the entire AI stack, agent observability focuses on AI agents: systems that take autonomous actions, chain multiple tools, and follow dynamic execution paths.
Agents create new observability challenges:
-
Dynamic workflows: No two runs follow the same path
-
Hidden failures: Agents may "think" they succeeded while silently failing
-
Compound errors: Small early issues cascade through workflows
Agent observability adds:
-
Reasoning step tracing: Every decision, tool call, and retrieved fact
-
Workflow visualization: Understanding decision trees over time
-
Behavioral drift detection: Spotting when agents deviate
from expected patterns
-
Multi-modal support: Handling agents that process images, PDFs, and voice
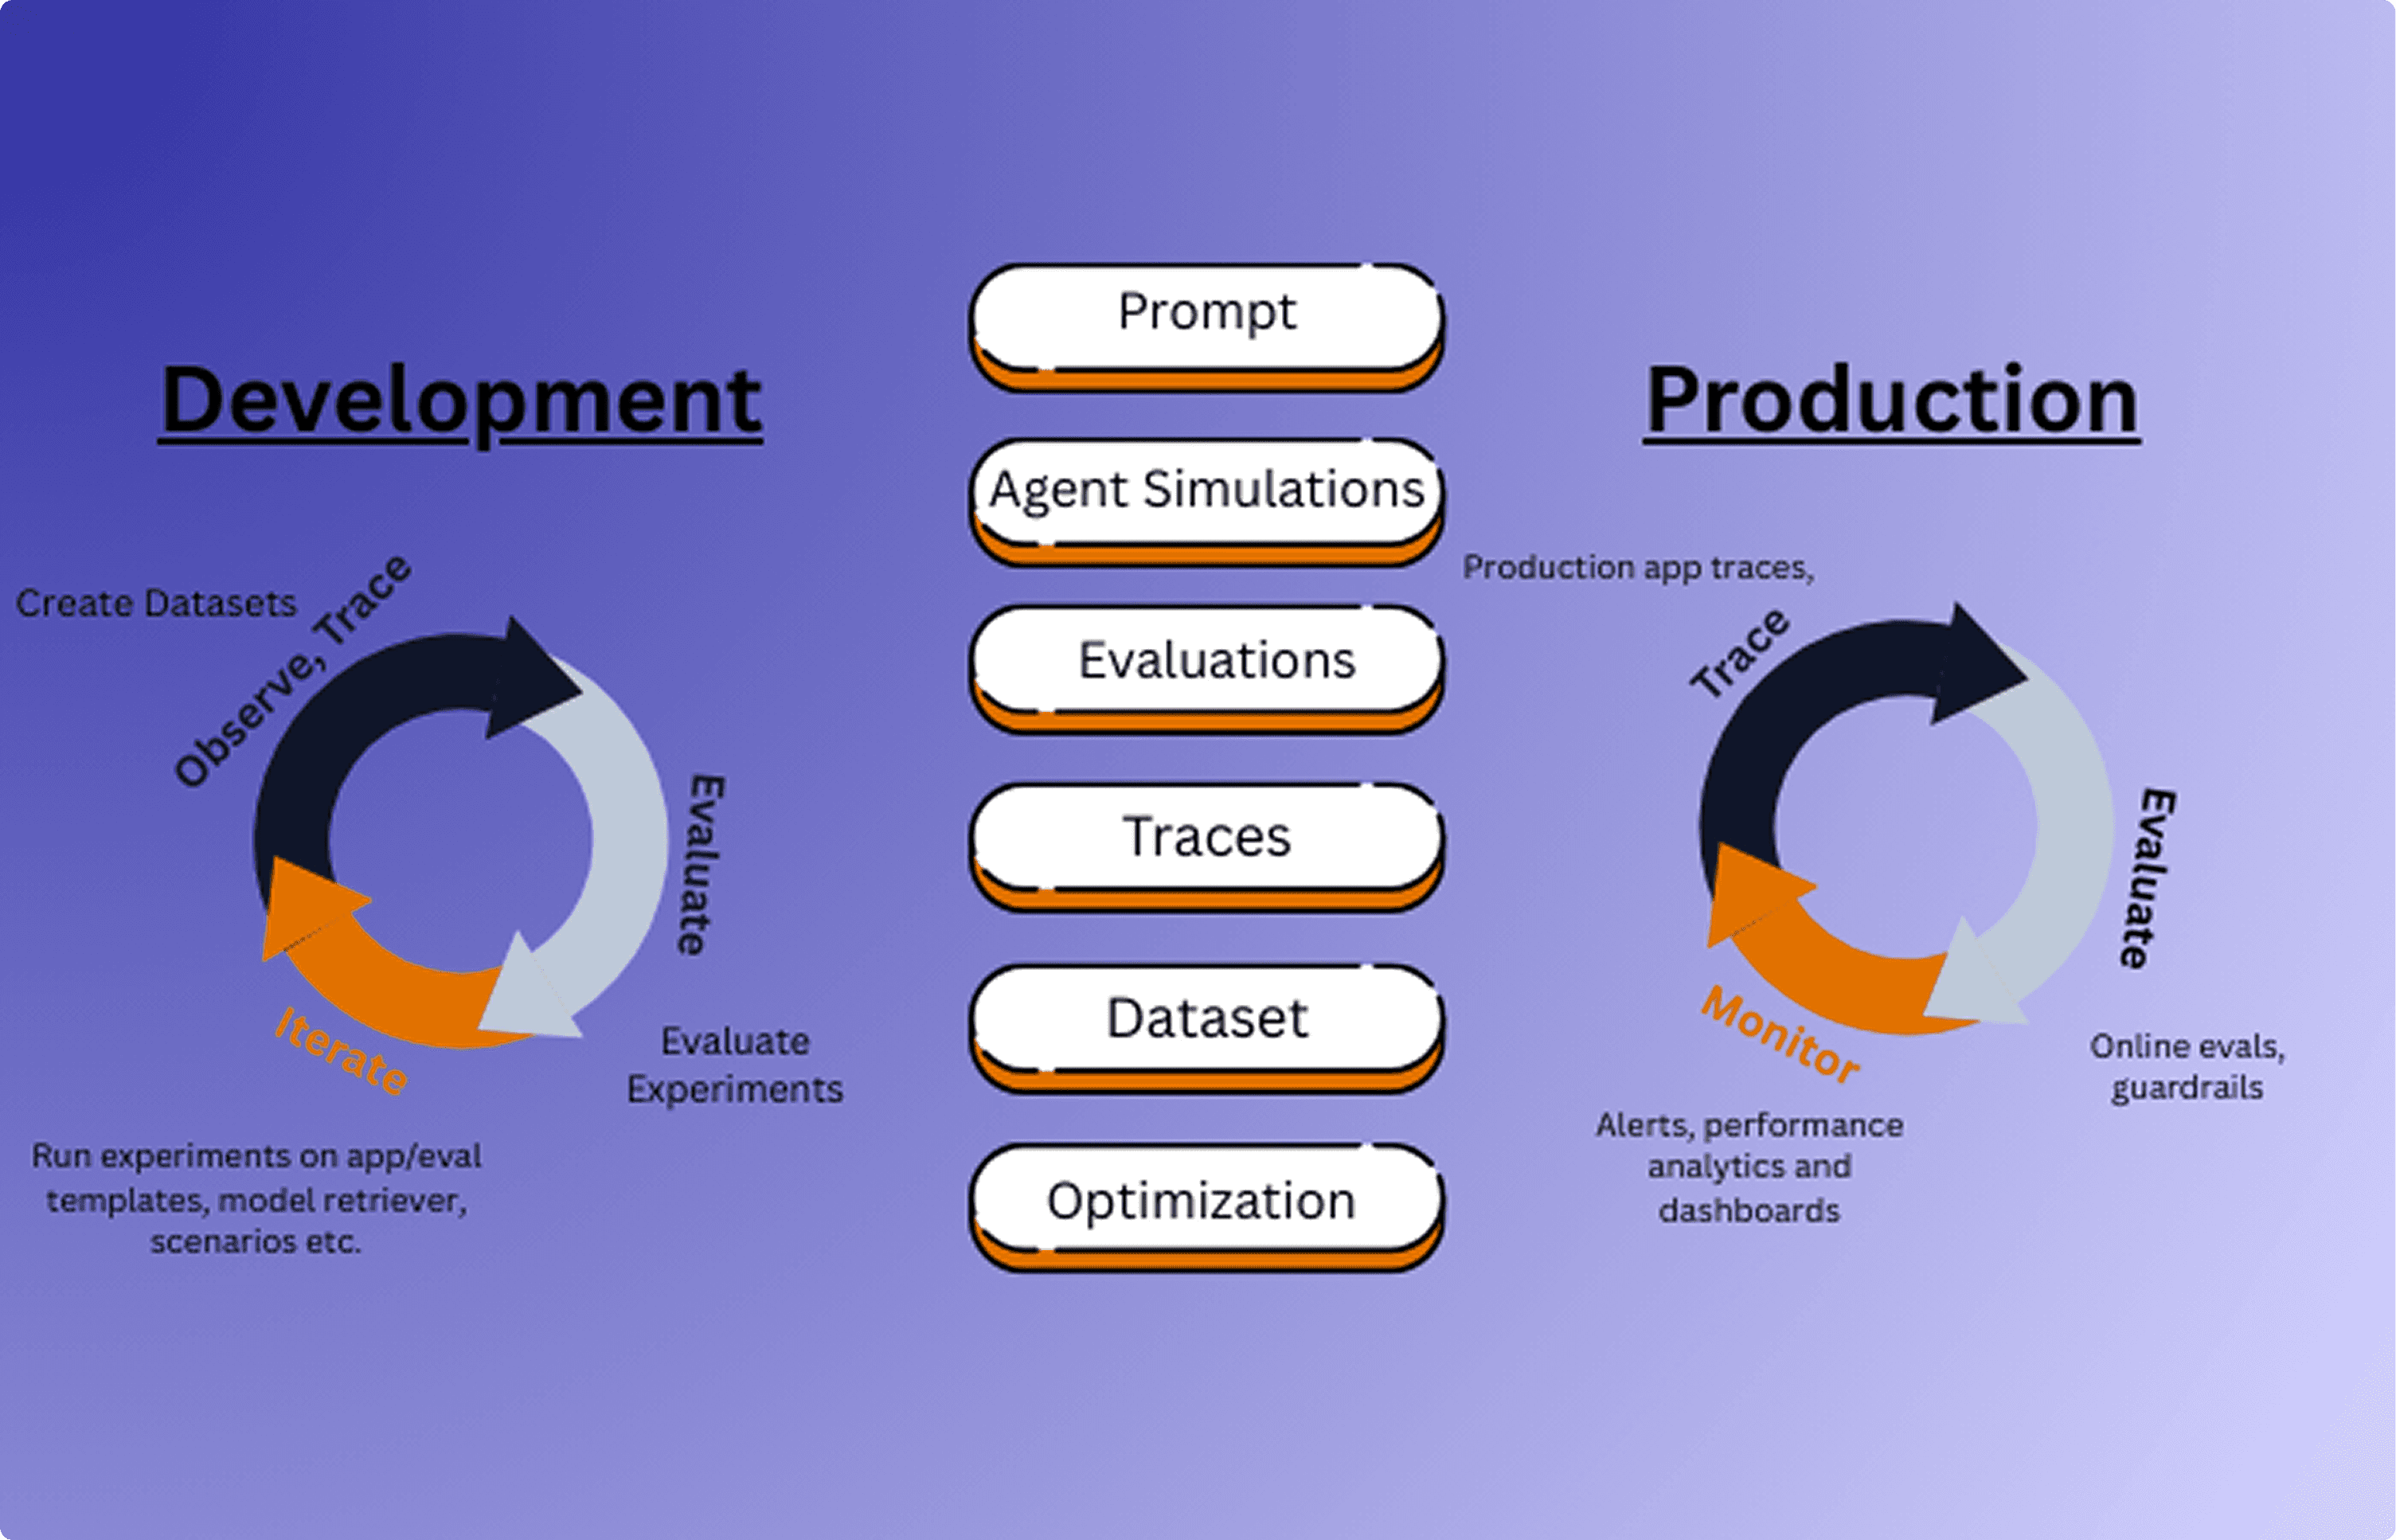
Alerting for development and production
Effective observability requires different alerting strategies for development and production environments, matching the pace and stakes of each context.
Development alerting: Speed and iteration
In development environments, speed matters more than formal processes. Teams need immediate feedback on quality issues without bureaucratic overhead. Effective development alerting might include:
-
Console integration: Failing evaluations are printed directly to development consoles with relevant context and debugging information
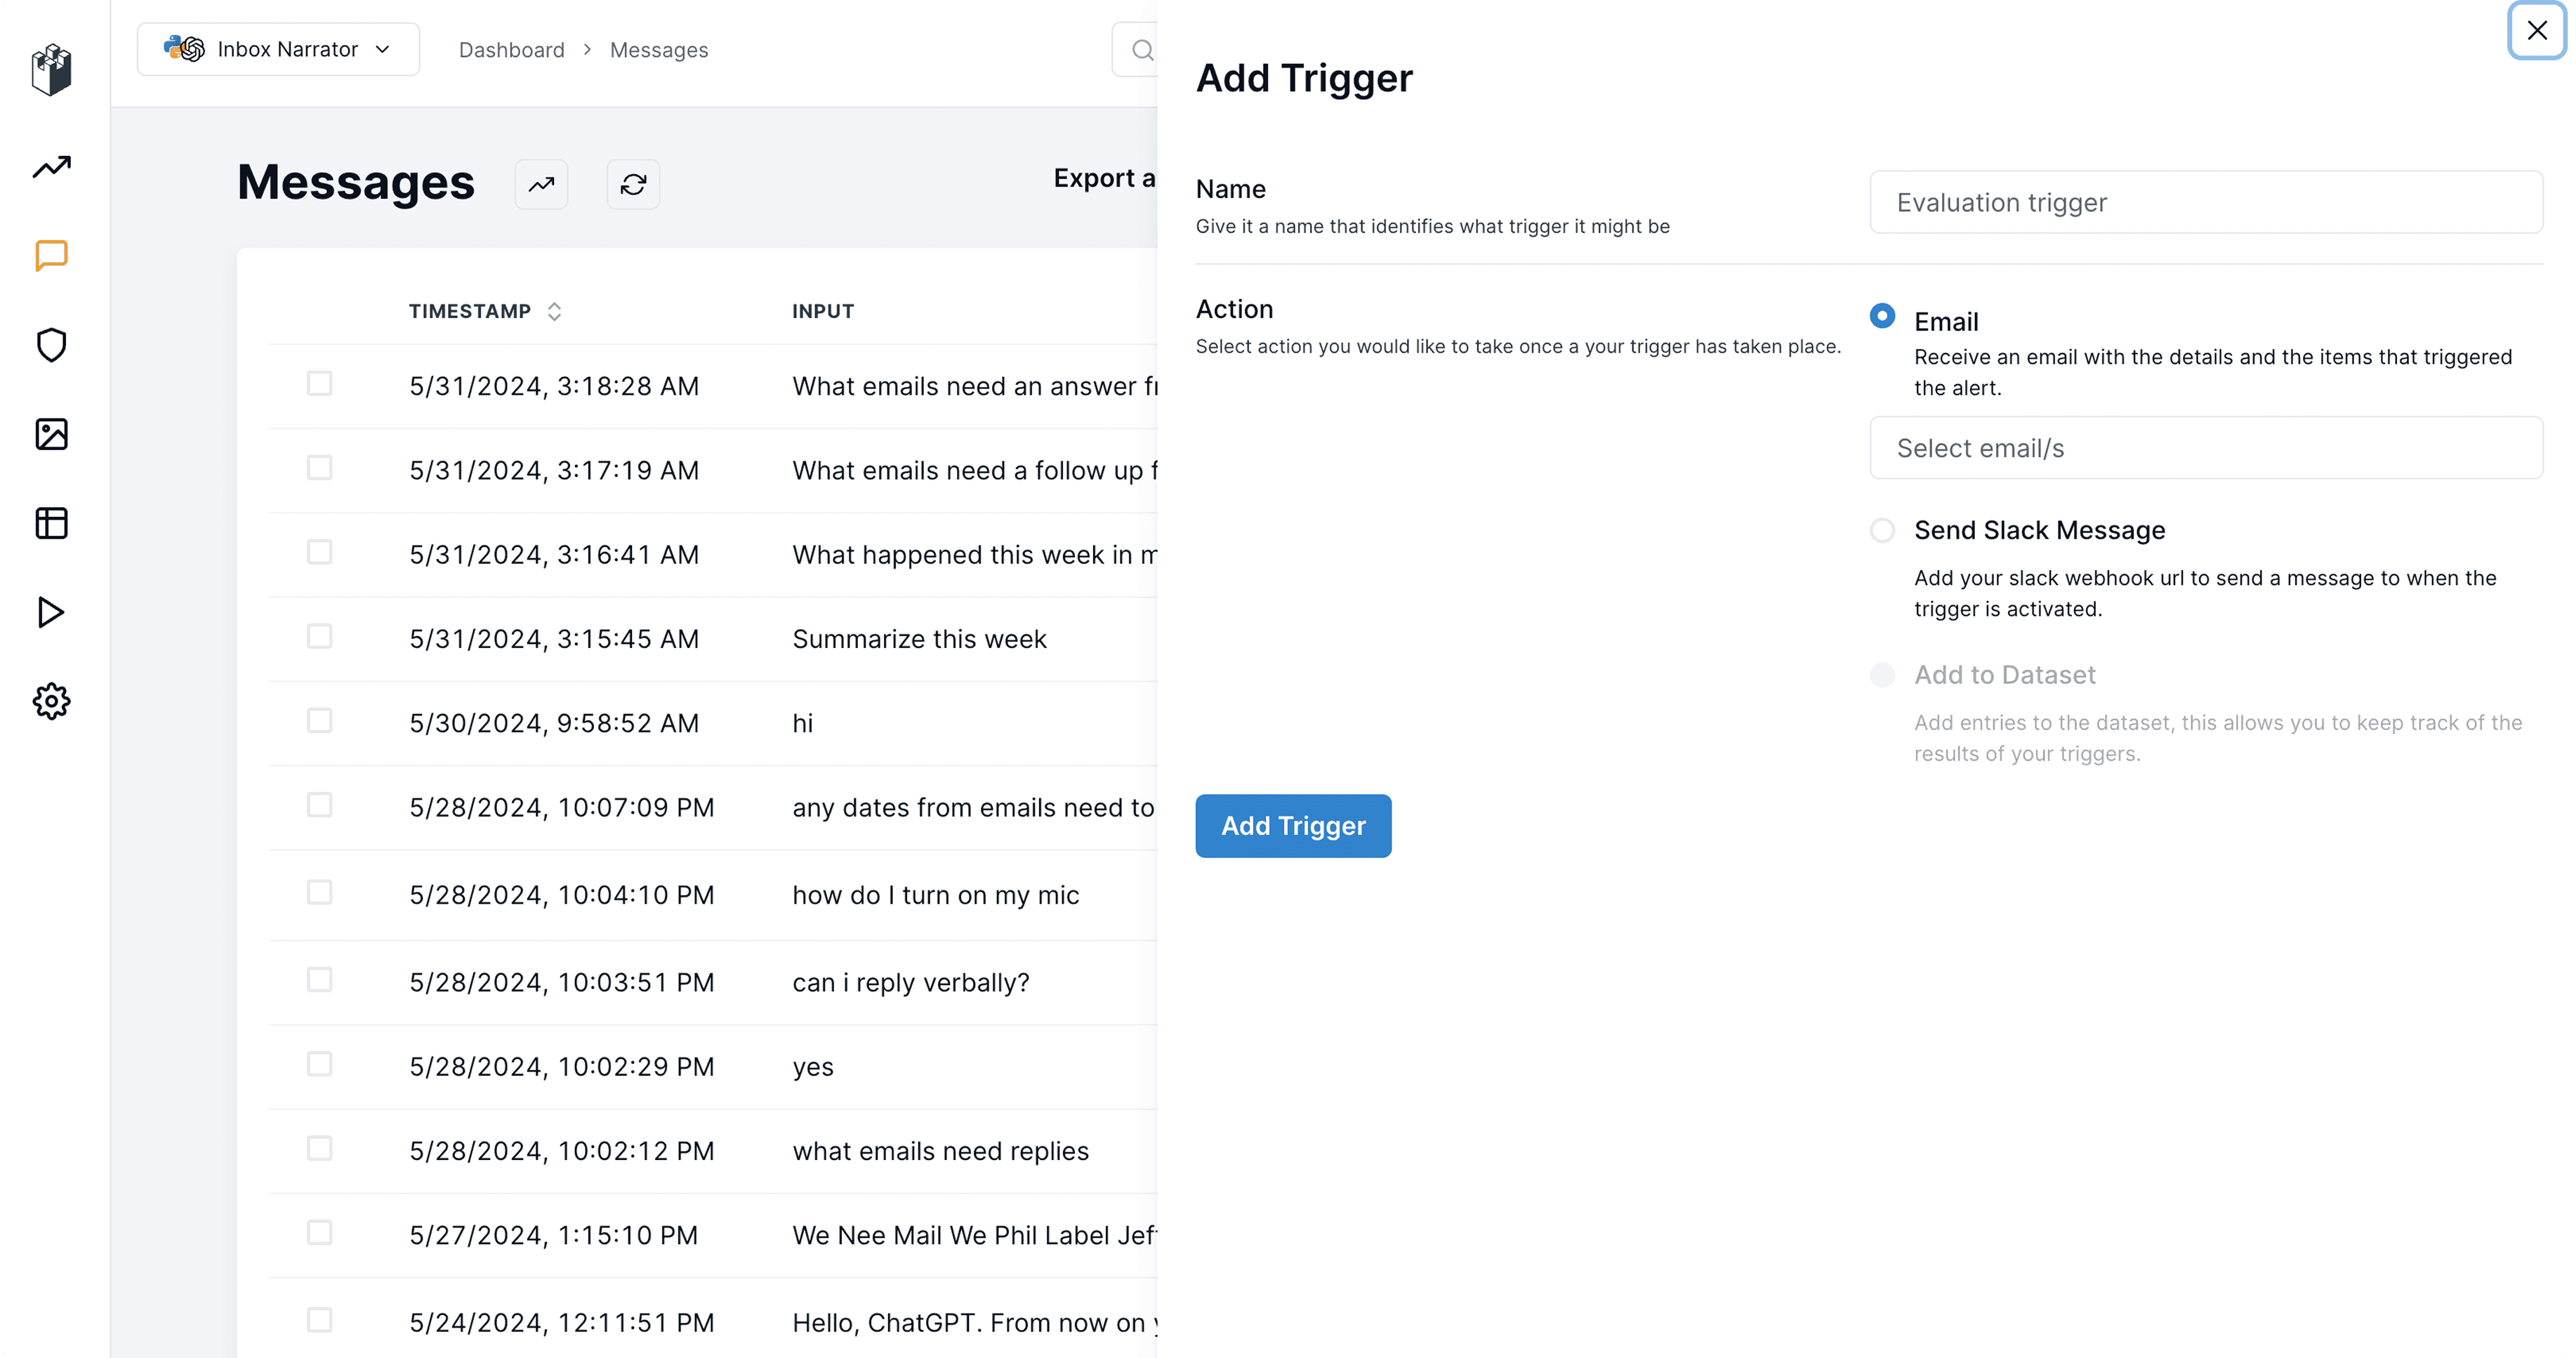
-
Instant notifications: Quick Slack or email alerts when specific trace properties indicate problems, allowing rapid iteration
-
Visual dashboards: Real-time dashboards that provide immediate visual feedback on model performance, quality metrics, and system behavior
-
Custom monitors: Lightweight monitoring of specific span properties or evaluation results that matter for current development work
The goal is to enable rapid iteration without drowning in noise or slowing down the dev process.
Production alerting: Scale and reliability
Production environments require structured, reliable alerting that matches enterprise operational requirements. This includes:
-
Threshold-based alerts: Automated notifications when evaluation metrics cross predefined thresholds, such as hallucination rates, safety scores, or user satisfaction metrics
-
Trend analysis: Alerts based on degrading trends rather than just absolute thresholds, catching gradual quality erosion before it becomes severe
-
Escalation procedures: Structured alert routing that ensures critical issues reach the right teams with appropriate urgency levels
-
Integration with operations: Connection with existing incident management, on-call rotations, and operational procedures
Because modern observability platforms integrate evaluations, trace metrics, and monitoring in unified systems, alerting becomes an active safety mechanism that maintains AI system performance rather than just recording what went wrong.
Choosing an LLM observability tool
LLM observability tools vary in capabilities. Some focus on basic logging, others provide comprehensive tracing and evaluation.
Key features to evaluate:
-
End-to-end tracing of complex workflows
-
Real-time metrics for latency, cost, and errors
-
Automated evaluation pipelines with human review options
-
Framework agnostic integration with OpenTelemetry support
-
Agent workflow replay and debugging capabilities
The right tool depends on your system complexity, compliance requirements, and team collaboration needs.
For teams building production AI systems, observability isn't optional; it's the foundation that enables reliable, debuggable, and improvable AI applications.
LangWatch for LLM observability
Most teams building production AI systems end up with fragmented observability - basic logging here, custom metrics there, manual evaluation processes that don't scale. The result is debugging sessions that take hours and quality issues that surface in production.
LangWatch consolidates tracing, metrics, and evaluation into a single platform with native OpenTelemetry support. You get complete request traces through complex AI workflows, real-time performance data, and automated quality checks without maintaining separate toolchains. The framework-agnostic approach means it works with LangChain, CrewAI, DSPy, custom agent implementations, or whatever you're building without requiring code changes or vendor lock-in.
For production deployments, this means faster debugging when things break, systematic quality monitoring instead of hoping for the best, and observability data that actually helps you improve system performance rather than just recording what happened.
Interested? Book a demo here.
Put this into production with LangWatch.
Trace your agents, run evaluations, and turn failures into repeatable tests.