Observability Framework Design for LLM Apps - The Complete LangWatch Guide
Understand observability framework architecture for LLM apps. Learn design principles and monitoring strategies
 Manouk Draisma · August 1, 2025 · Integrations
After months of prompt tuning, evaluation runs, red-teaming, and aligning your AI assistant or agent workflows, launch day has arrived. The model is in production, the infra is humming, and yet that creeping uncertainty remains:
-
Have we tested for every possible edge case?
-
Could a user find a way to exploit this system?
-
Is the AI really ready for messy, unpredictable, real-world interactions?
The reality is: no matter how comprehensive your pre-launch evaluations are, real-world usage will expose scenarios you didn’t anticipate. And without the right LLM observability framework in place, those gaps can become risks - or worse, customer-facing failures.
That’s where LangWatch comes in.
LangWatch provides end-to-end LLM observability, real-time guardrails, evaluations, and replayable (agent( scenarios so you can not only see what’s happening in production, but understand why, respond instantly, and continuously improve your models and agent workflows.
This guide will walk you through how to design a robust observability framework for LLM apps, what to monitor, how to debug complex pipelines, and how to integrate evaluations into your production loop - all powered by LangWatch.
What is LLM Observability?
To keep large language models (LLMs) performing accurately and aligned with your business goals, you need more than basic performance tracking - you need LLM observability tools. These platforms give you end-to-end visibility into how your models behave, helping you detect problems early, troubleshoot faster, and confidently scale your generative AI applications.
With the right observability solution, you can:
-
Monitor LLM performance in real time
-
Compare multiple models or prompts using A/B testing
-
Identify performance shifts before they affect users
-
Resolve errors at their root cause
-
Maintain reliability as you scale GenAI initiatives
This proactive approach ensures your AI systems deliver consistent, high-quality results while staying cost-efficient and aligned with compliance or safety standards.
LLM Monitoring vs. LLM Observability
LLM monitoring focuses on real-time tracking of metrics like response latency, error rates, cost per request, and usage trends. It’s essential for spotting sudden performance drops or anomalies in production.
LLM observability, on the other hand, goes beyond surface metrics. It combines logs, real-time evaluations, and traces to explain why a model behaves the way it does. This deeper insight helps AI engineers debug more effectively, optimize workflows, and prevent future issues.
What is LLM tracing?
LLM tracing is a core feature of observability platforms. It maps every step in the LLM pipeline, from the initial user prompt, through intermediate reasoning or API calls, to the final output. This granular view allows teams to:
-
Trace unexpected responses back to specific inputs
-
Identify bottlenecks in processing
-
Optimize chain-of-thought or multi-step reasoning
-
Verify that outputs meet quality and compliance requirements
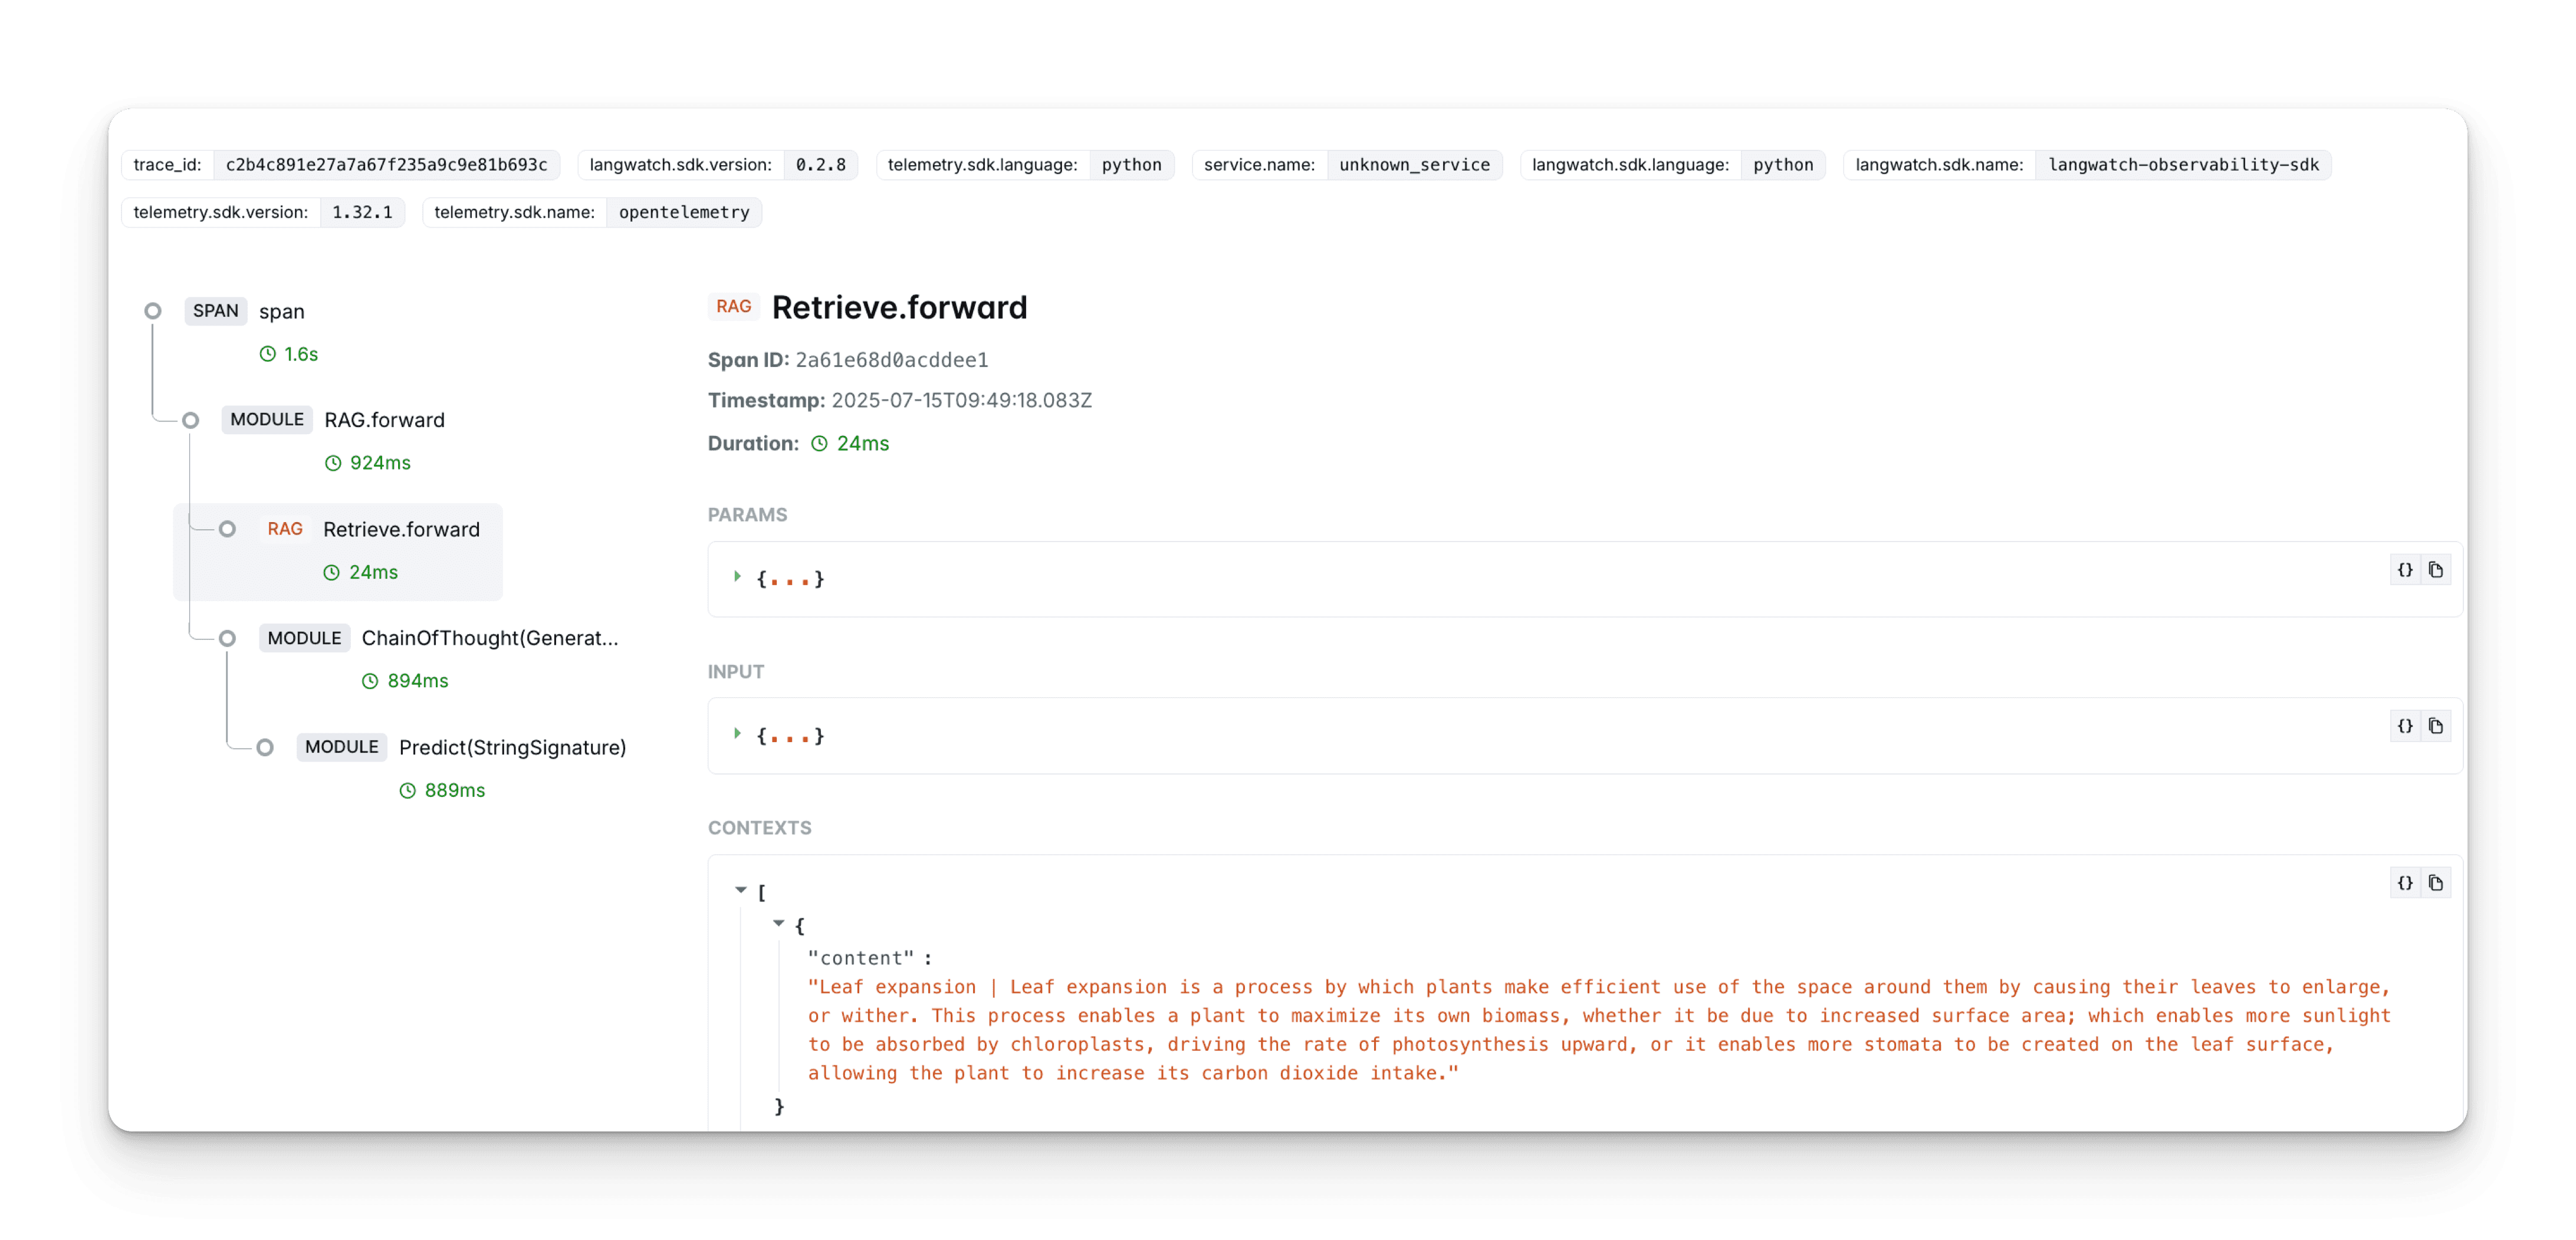
How LLM traces should look like
By integrating tracing with monitoring and observability, you create a complete feedback loop for continuous improvement.
Why observability is essential for LLM apps
LLM observability addresses some of the most critical challenges in building with AI - here’s what they are, and why choosing the right observability platform matters."
1. You will need to experiment, constantly
LLM and agent performance are dynamic and non-deterministic; that's why you’ll want to A/B test prompts, swap models, update retrieval sources, or modify an agent’s toolset before going to production. Without observability, it’s nearly impossible to compare results objectively or to replay real production scenarios to see how changes impact behavior.
-
LLM Debugging is harder than you think
LLM apps aren’t just “one model call.” They’re pipelines retrievers, knowledge bases, chains, multiple agents, third-party APIs, rerankers, and post-processing steps.
When something goes wrong, you need tracing that can tell you exactly:
-
Where the latency spike originated
-
Which component introduced hallucinations
-
Whether a tool failed silently or returned incomplete data
With so much at stake, visibility into these areas is essential to keep your system running efficiently, delivering accurate results, and avoiding costly bugs.
3. The possibilities (and edge cases) are infinite
You can prepare the most exhaustive evaluation dataset, but real users will always surprise you. They’ll ask unexpected questions, use adversarial prompts, or chain queries in ways you never anticipated. Because the range of possible queries is limitless, you can’t anticipate them all with complete certainty. LLM observability lets you automatically catch these unpredictable inputs and resolve the issues they trigger
4. Performance drift is real
LLM's change. Prompts evolve. APIs update. They are inherently non-deterministic, you won’t always get the same output from the same input. On top of that, state-of-the-art models are constantly evolving, especially when using third-party providers like OpenAI or Anthropic. This combination can lead to hallucinations and unexpected responses, even after deployment. Testing during development is vital, but it’s not enough, continuous monitoring is the only way to keep pace with unpredictable, ever-changing models."
5. LLM's can hallucinate
Hallucinations in LLM applications happen when models generate incorrect or misleading information, often in response to questions they can’t accurately answer. Rather than admitting uncertainty, they produce confident-sounding but fundamentally wrong responses. This behavior poses serious risks, especially in use cases where factual accuracy is critical and misinformation could have real consequences
The five pillars of an Observability Framework
Every serious LLM observability platform needs to deliver on five non-negotiable capabilities. These core pillars ensure you can monitor, troubleshoot, and improve AI applications effectively:
-
Real-Time output tracking - Capture every user request and model response, along with vital performance data such as latency, token usage, and cost.
-
Built-In Automated AI Testing - Continuously score and validate model outputs without manual intervention to catch errors early.
-
Precision Search & Filtering - Instantly locate problematic or low-quality responses by filtering against specific criteria.
-
End-to-End application visibility - Map and trace interactions between every component in your AI pipeline to uncover bottlenecks and bugs.
-
Integrated Human in the loop review - Enable experts to provide corrective feedback and define expected answers for flagged results
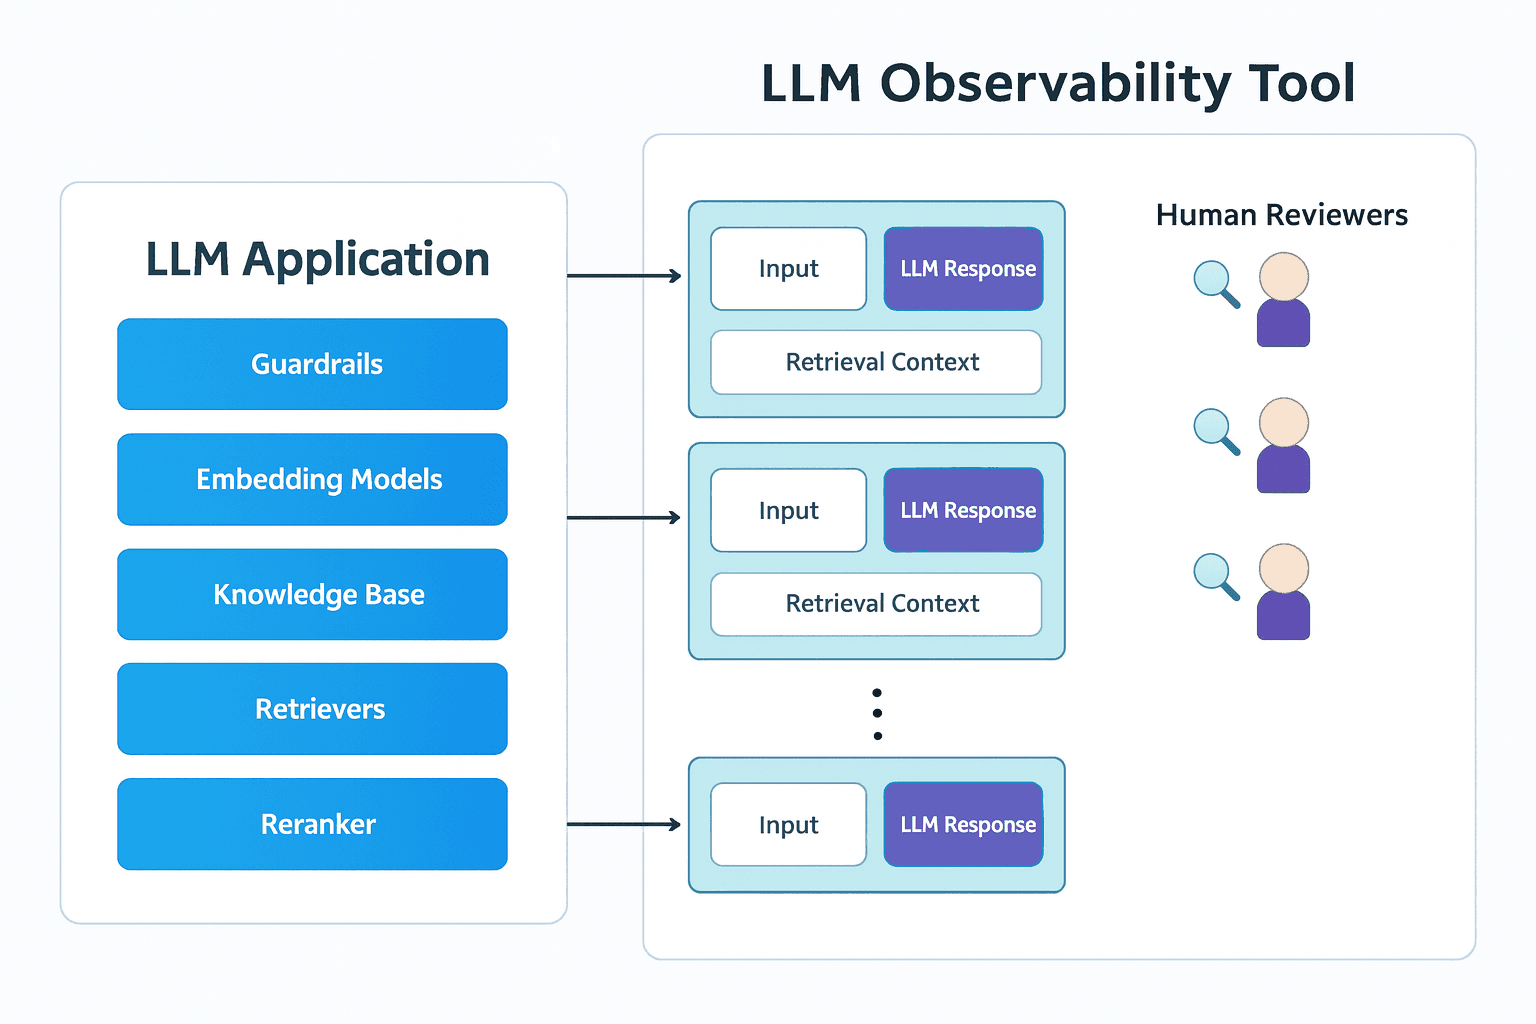
When these five pillars are in place, an LLM observability platform gives every stakeholder engineers and data scientists to human reviewers, subject matter experts, and executives a clear view of how the application is performing and where it can be improved
Response Monitoring
At the heart of effective LLM observability is response monitoring - the practice of capturing detailed information about every interaction between users and the model. A robust approach typically covers five key dimensions:
-
User and Session Linking - Tag responses with unique user IDs and conversation IDs to make it easy to audit specific interactions or follow entire conversation flows.
-
Hyperparameter Logging - Capture model settings like prompt templates, temperature, and model versions to compare performance across different configurations.
-
User Query - Model Output Mapping - Record every request alongside the exact model response. This pairing is the foundation for meaningful evaluations and represents the primary material domain that experts and reviewers will assess. In retrieval-augmented generation (RAG) systems, this also means storing the retrieved context.
-
Custom Data Capture - Allow for additional metadata collection tailored to your unique application needs, enabling deeper analysis for specialized use cases
-
Performance Metrics Tracking - Log essential performance data such as response latency, token consumption, and cost per interaction to maintain efficiency and control expenses.
2. Filtering and alerts
Powerful filtering tools are a must-have for quickly pinpointing and examining specific LLM outputs. While narrowing results to failed evaluations is a natural starting point, advanced filtering takes analysis much further. Imagine working with a RAG-based chatbot and needing to reproduce a particular situation. Filters could let you zero in on responses with a low Evaluation score, with negative feedback from the end-user or from a specific prompt or model, and sourced from retrieval context stored in the development database. By recreating the exact conditions of that interaction, you can investigate issues with precision and identify opportunities for improvement.
To maximize insight, filtering & alertsing can be applied in many ways:
-
By user, topic or conversation jistory - Isolate all outputs from a single user or an entire conversation to spot patterns, recurring issues, malicious use cases, or repeated topic-specific failures.
-
By LLM config - Compare outputs across variations in model, prompt templates, temperature, or other runtime settings to identify which configurations deliver the best results.
-
By contextual data - Go beyond hyperparameters and include environment-specific details, such as the knowledge base, retrieval source, or deployment stage that influenced the output.
-
By annotations - Filter according to reviewer scores, comments, or expected answers to gain an extra layer of quality assurance, double-check disputed outputs, or audit the reviewers themselves.
-
By failed Evaluation metrics - Focus on responses that did not meet defined performance thresholds, using them as a starting point for deeper investigation and targeted improvements.
Being able to filter through thousands or even millions of LLM responses with this level of precision ensures that you’re not just collecting data, but actively turning it into actionable insights and automatically building datasets from it. This means faster debugging, more reliable A/B testing, and the ability to prevent regressions before they impact users.
3. Automated Evaluations
Capturing every user query and the corresponding LLM output is fundamental for understanding model performance, but expecting human reviewers or domain experts to manually check each response simply doesn’t scale. Consider this: if your LLM-app daily responses / output of just over 1000 responses, that's 30,000 responses per month to review by human. No team can realistically inspect all of them.
This is where automated evaluations prove invaluable. They act as a first-pass quality filter, surfacing only the outputs that genuinely warrant human attention. Reviewers can then spend their time where it matters most investigating and resolving problematic cases instead of combing through everything.
Offline vs. real-time Evaluations
The way evaluations work changes drastically between development and live production environments.
-
Offline Evaluations, you can run tests with predefined parameters such as expected outputs or known retrieval contexts. This makes it possible to apply reference-based metrics like Answer Correctness that rely on having a “ground truth” for comparison. This stage is ideal for testing new prompts, pipelines, or model configurations before they’re deployed.
-
Real-time evaluations, evaluations must be performed on the fly there’s no guaranteed “correct” output to compare against. Reference-based metrics like Answer Correctness aren’t practical here, but other metrics still deliver valuable insights. In RAG workflows, for example, you can measure Answer Relevancy, Contextual Precision, Contextual Recall, Contextual Relevancy, and Faithfulness without needing ground-truth references. Most important when choosing the right framework is that they allow you to define your own evaluation criteria to match your application’s success metrics and build your own quality framework.
Why LangWatch leads in LLM Evaluations
LangWatch is built around the principle that evaluations are the foundation of safe, reliable LLM deployments. Instead of giving you an open-ended toolset and leaving you to figure it out, LangWatch guides you through designing the right evaluations for your specific use case, runs experiments across prompts/models/pipelines, and alerts you to regressions before they affect users.
With LangWatch, automated evaluations and advanced filtering work hand-in-hand, meaning you can instantly find, reproduce, and fix problematic outputs without sifting through a sea of irrelevant responses.
4. Application Tracing
When something goes wrong in a complex LLM workflow, knowing what failed isn’t enough you need to understand where and why it happened."
Application tracing in LangWatch gives you end-to-end visibility across your entire AI pipeline. Every step, from the initial user query to the final model output, is mapped and connected. Whether you’re dealing with a simple single-model call or a multi-step agent invoking multiple tools, LangWatch captures the full chain of events.
This visibility is invaluable for:
-
Pinpointing bottlenecks - Identify exactly where latency is creeping in.
-
Debugging failures - Trace errors back to the component, retrieval, or API call that caused them.
-
Version comparisons - See how a new model or prompt performs in the same workflow.
-
Optimizing pipelines - Use trace insights to restructure your process for efficiency and accuracy.
By providing this granular breakdown, LangWatch turns complex, black-box LLM behavior into a transparent, analyzable process, making root-cause analysis faster and more accurat with just one-line of code.
5. Human-in-the-Loop
Even the most advanced automated evaluations can’t replace human judgment in high-stakes applications."
LangWatch integrates human annotations directly into the evaluation loop, ensuring that outputs flagged as potentially problematic are reviewed by subject matter experts before any final decision or escalation.
Key capabilities include:
-
Custom reviewer workflows - Assign flagged responses to domain experts, customer support teams, or Product managers.
-
Expected output definitions - Allow reviewers to provide the correct or preferred answer for future comparisons and having an expected output als golden dataset.
-
Multi-reviewer validation - Gather multiple human opinions on the same output to resolve disputes or measure reviewer alignment.
-
Feedback capture - Store detailed human feedback alongside the LLM trace for context and future training data.
This approach blends automation with human oversight, ensuring that critical decisions - especially in regulated or sensitive environments - are backed by expert evaluation, not just model confidence scores.
Setting Up Observability with LangWatch
Integrating LangWatch takes just one API call per event async, so there’s no added latency. For example:
import langwatch

langwatch.monitor(
    event_name="Customer Support Agent",
    model="gpt-4",
    input="What’s your refund policy for EU customers?",
    response="Refunds are processed within 14 days as per EU regulations.",
    retrieval_context=["Policy document section 3.2"],
    conversation_id="conv-89423",
    hyperparameters={"temperature": 0.7},
    additional_data={"Agent": "Support", "Knowledge Base": "EU-Legal"}
)
From that single call, LangWatch captures:
-
The full interaction
-
Traces
-
All parameters & metadata
-
Evaluation scores (if configured)
-
User and human feedback
This means any future replay, debug, or A/B test starts with complete context.
Conclusion
A robust observability framework is not optional for serious LLM applications, it’s the safety net, control panel, and improvement engine that keeps your AI performing at its best.
With LangWatch, you get:
-
Full visibility into every request and response
-
Integrated evaluations both real-time and offline before going to prod.
-
Scenario replay agent testing for regression and experimentation
-
Distributed tracing across multi-agent and RAG pipelines
-
Real-time guardrails to block unsafe or low-quality outputs
-
Human-in-the-loop workflows for precision QA
All in a platform you can integrate in minutes.
📅 Book a live demo to see LangWatch in action, and get some Eval advice.
🚀 Start for free and instrument your first LLM workflow today.
Put this into production with LangWatch.
Trace your agents, run evaluations, and turn failures into repeatable tests.