

LLM metrics built for AI Engineers & Product Teams
Monitor what matters with Langwatch’s extensive LLM observability metrics
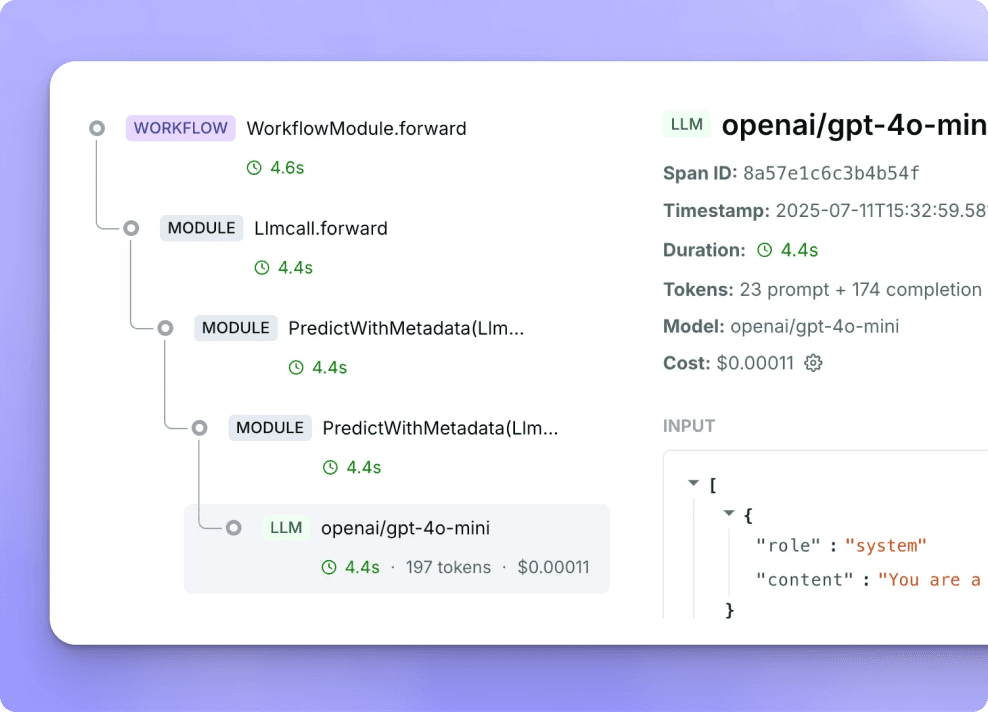
Prompt & Output Tracing
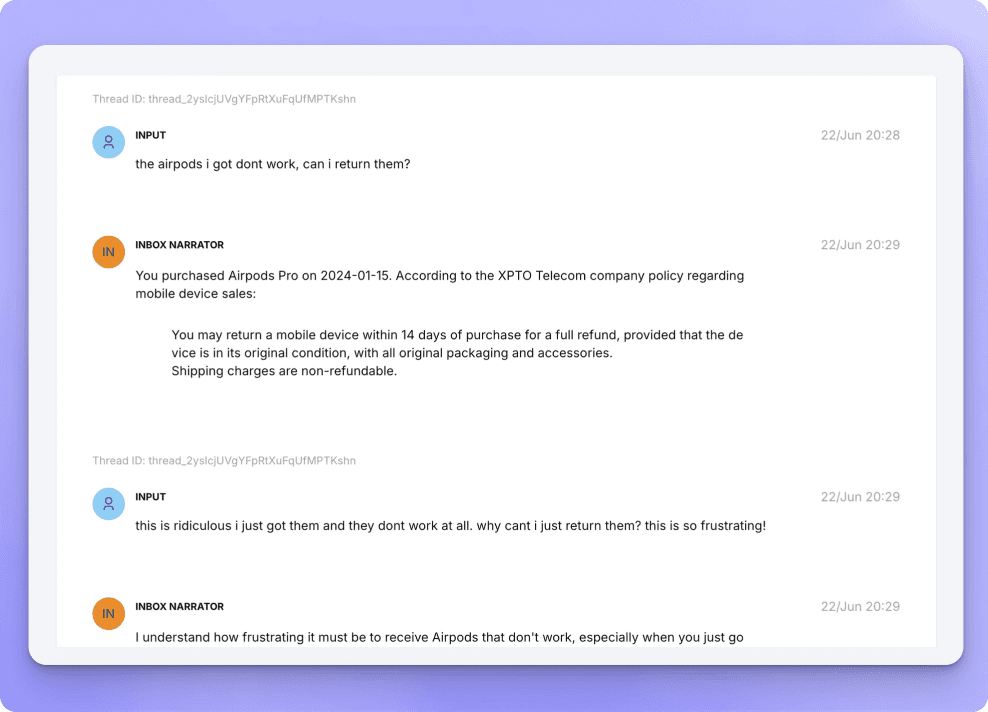
Capture the full lifecycle of every LLM call including inputs, outputs, retries, tool calling, and context variables. Automatically thread multi-turn agent conversations for complete traceability.
Metadata-Rich Logs
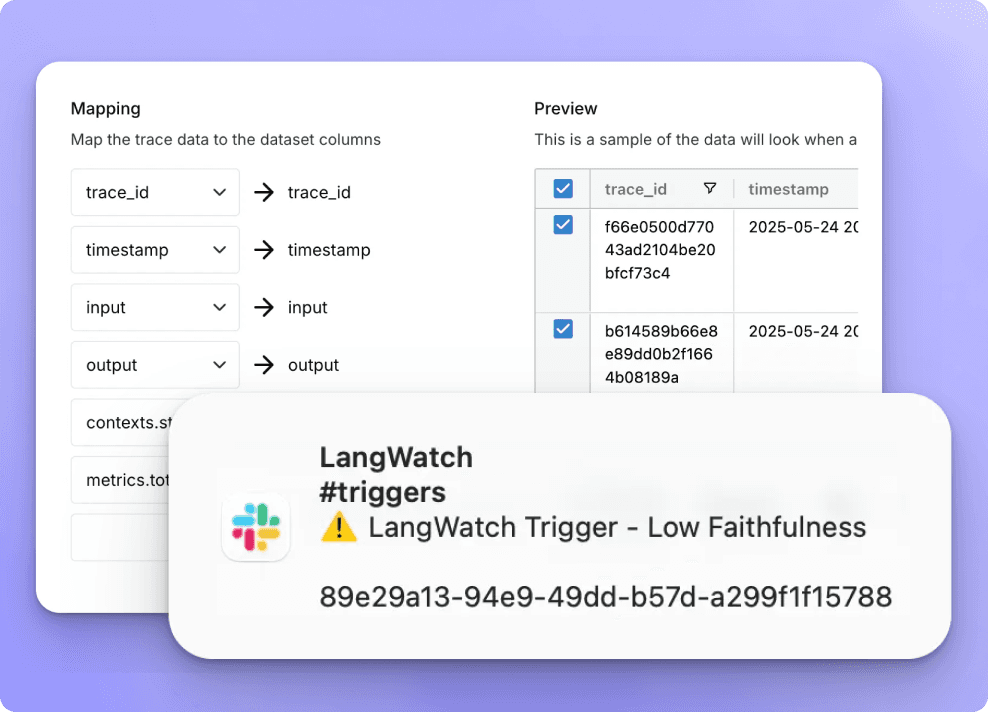
Attach user IDs, session context, features used, or any custom metadata for deeper filtering and analysis.
Latency, Errors & Alerting
Pinpoint slow generations, rate-limiting issues, and LLM-level failures. Trigger real-time alerts or evaluation workflows when behavior drifts or breaks expectations.
Framework-Agnostic & OTEL Native
Built with OpenTelemetry compatibility out of the box trace prompts, tool calls, and system behavior with no lock-in. Integrates with all major LLM frameworks, providers, and observability tools.
Token & Cost Tracking
Monitor input/output tokens and associated costs across 800+ models and providers. Visualize usage trends and optimize spend with custom dashboards and breakdowns.
User Journey & Analytics
Follow user flows across sessions and prompt chains. Measure engagement, segment behavior. All analytics/logs are exportable via API or webhook, enabling downstream analysis and reporting for management
Observability to debug, trace, and improve your AI agents and applications
Visualize your multi-step LLM interactions, log requests in real-time and pinpoint root cause of
Automatically collect, curate datasets and optimize your AI performance
Works across all LLM frameworks + No vendor lock-in.
Automatically tune prompts, selectors, and agents based on evaluation feedback.


