
Launching Claude Code usage tracking: see where your tokens go
Run npx langwatch claude once and every session lands in LangWatch: per-session cost, cache reads and writes as separate token classes, every tool call as a span, and a replay of your whole terminal session.
 Manouk Draisma · July 31, 2026 · Product Releases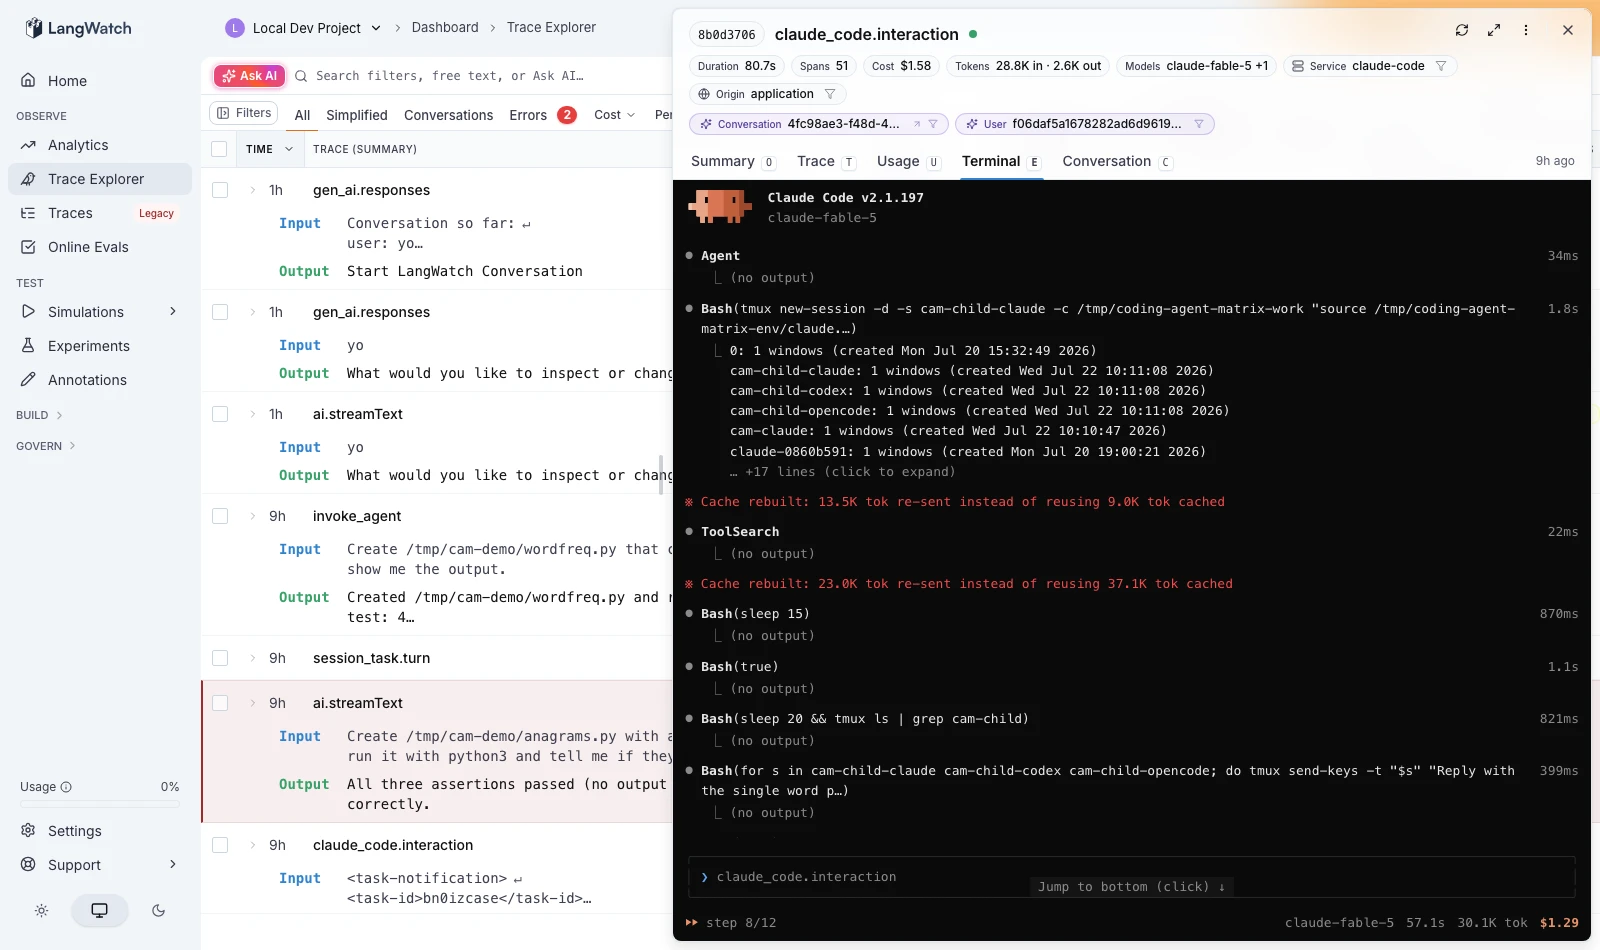
Today we are launching Claude Code usage tracking on LangWatch. Run npx langwatch claude once, and every session lands in your LangWatch project: what it cost, which tokens were cache reads and which were fresh, every bash command, skill and MCP call as a span with a duration, and a full reproduction of your terminal session, replayable in the UI.
It is free for individual use, and the same command works for Codex, Gemini CLI, and opencode.
The terminal, replayed
A Claude Code session leaves a lot behind, and almost all of it disappears with your terminal history. The Terminal tab keeps the whole thing: you scrub through the session step by step, see each tool's output as it happened, and the cache-rebuild warnings are marked inline right where they hit you. It is the session you remember, kept.
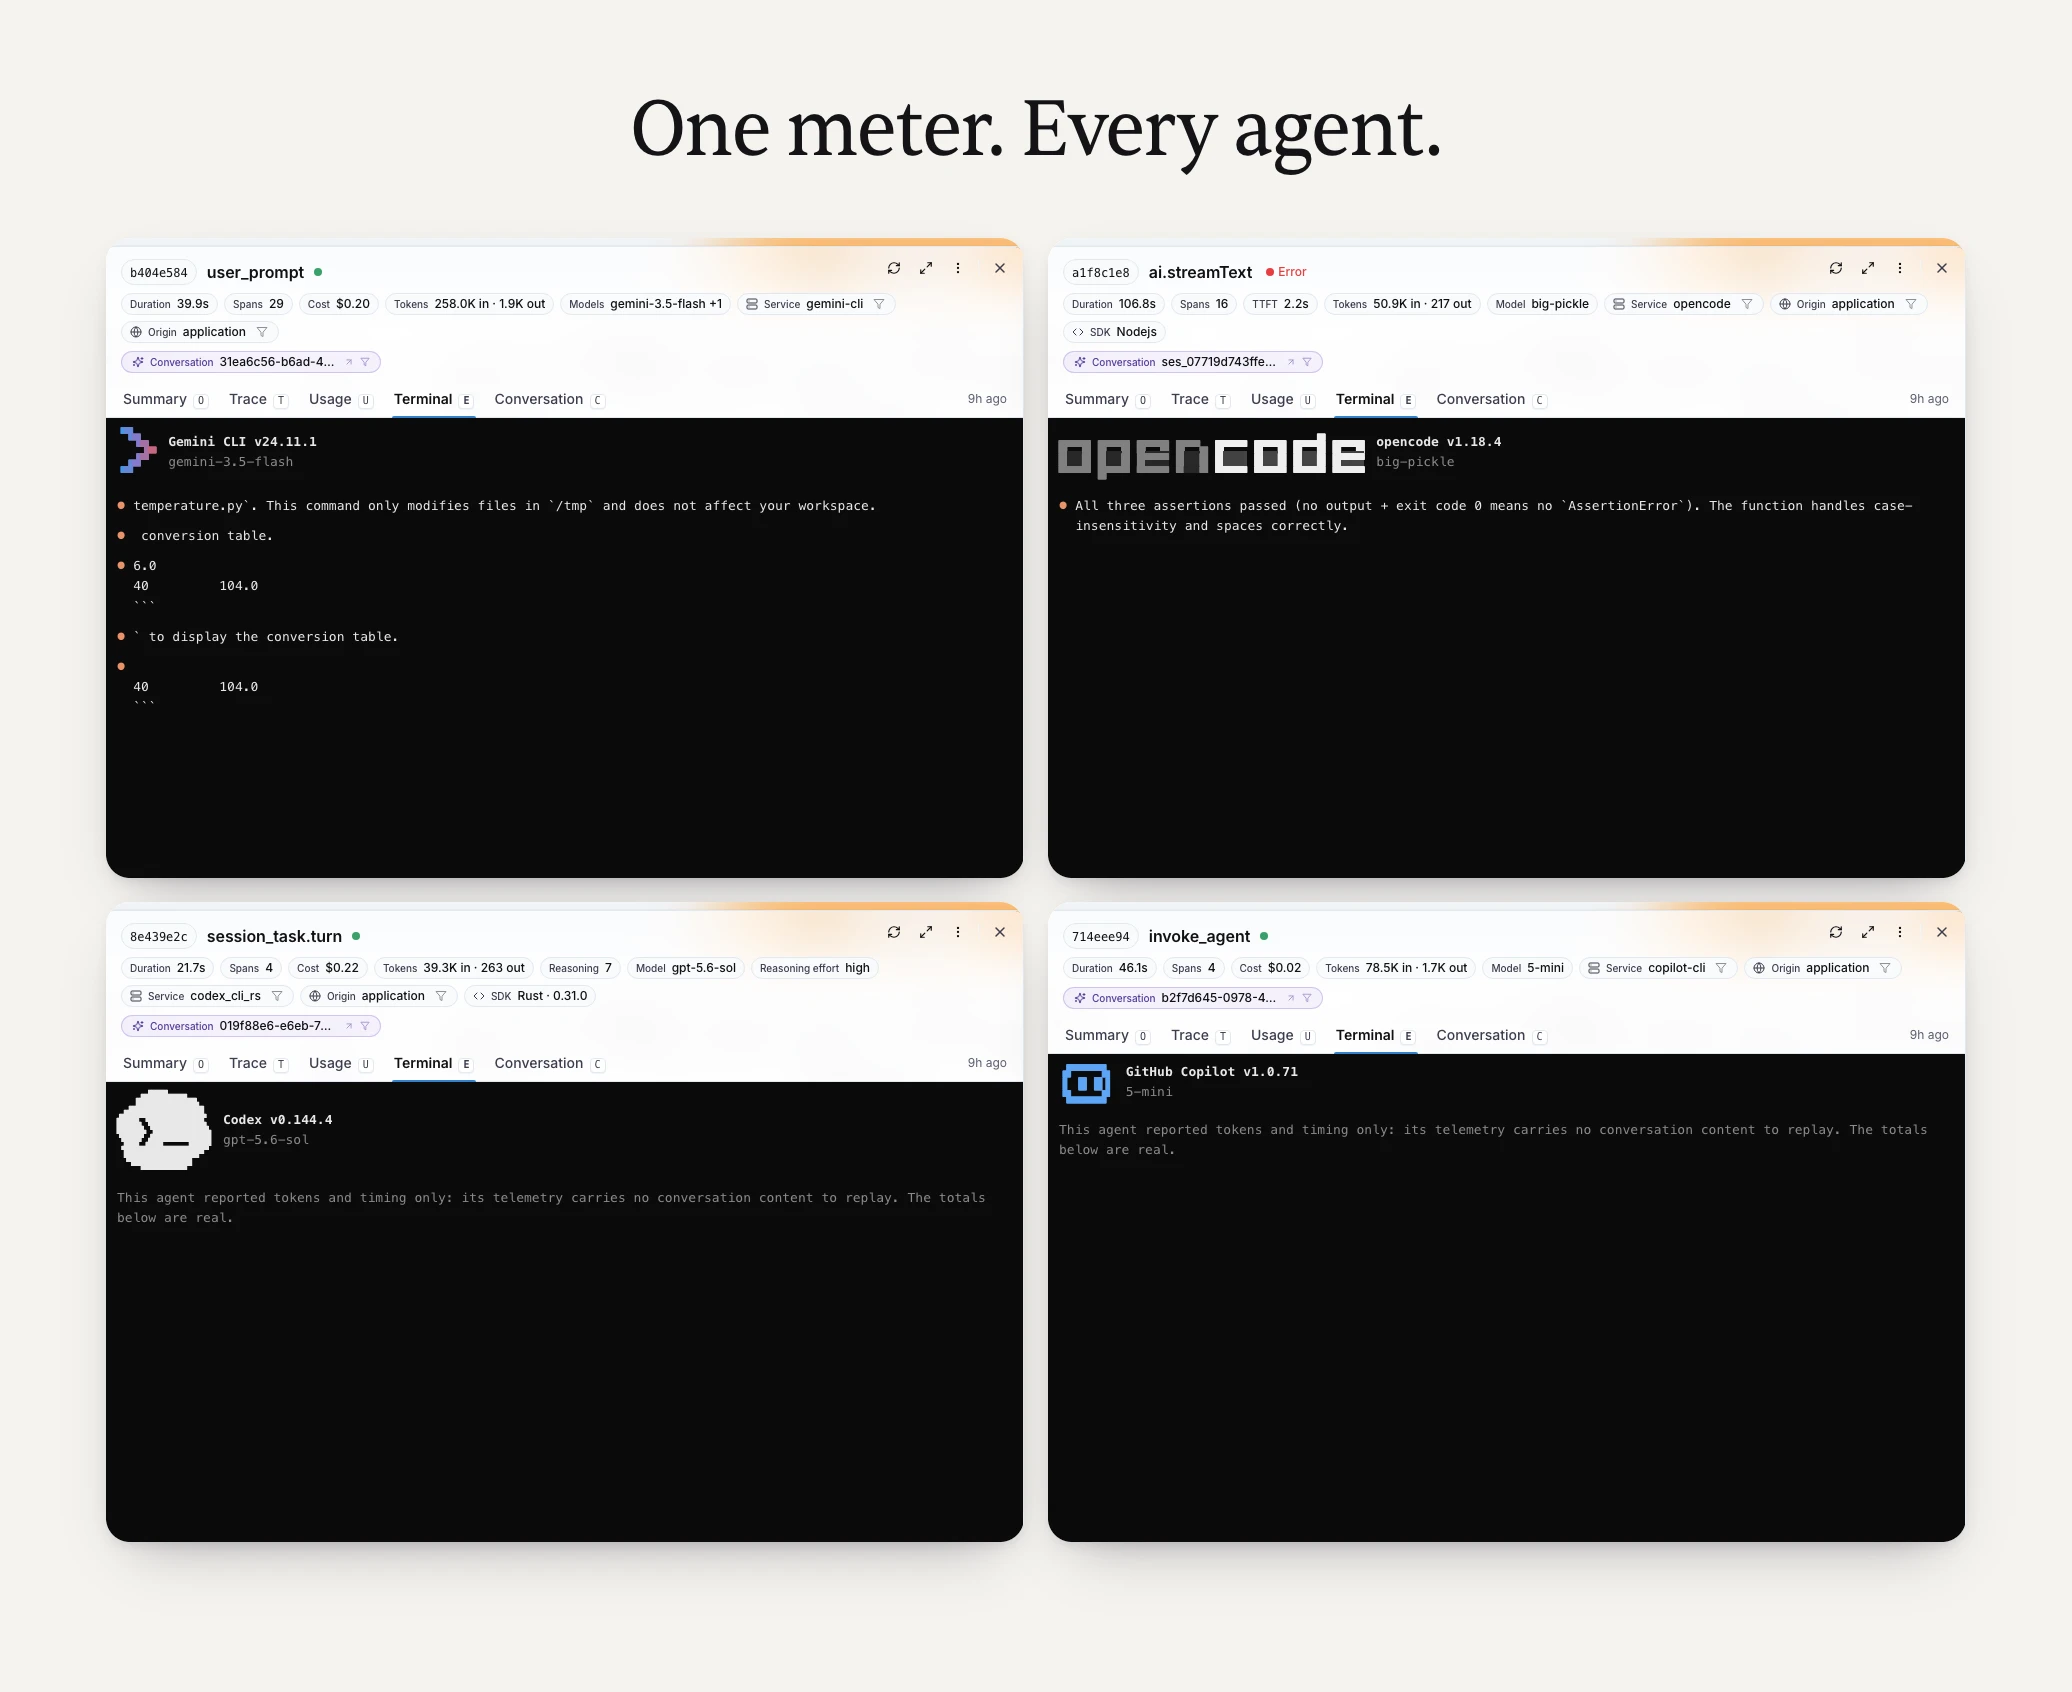
This works for every agent we track, so a Codex or Gemini CLI session replays the same way.
Cache reads are not input tokens
Claude Code sessions live and die by the prompt cache. Cache reads, cache writes, input, and output are four differently priced token classes, and cache writes split again into 5 minute and 1 hour TTLs. We track each class separately on every span, because a tracker that lumps cache into input gets both the token total and the cost wrong, sometimes by an order of magnitude on a long session.
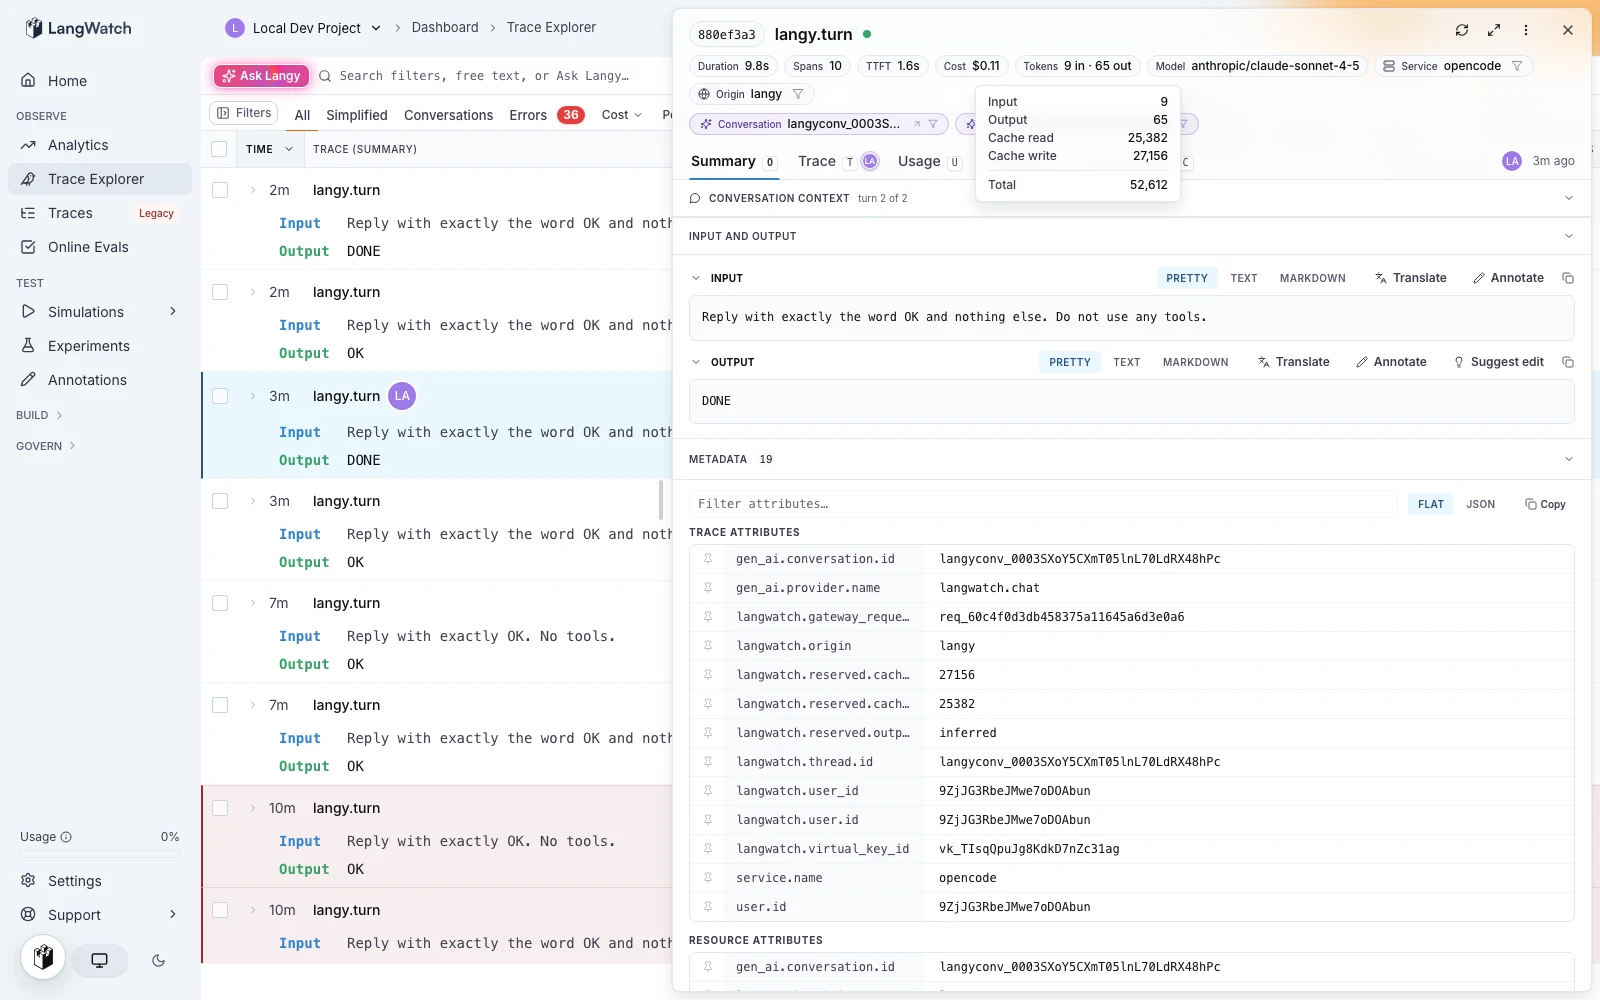
The ratio between reads and writes is what keeps long sessions affordable, and watching it drop is the earliest sign a session went off the rails.
Theoretical vs billed
If you are on a Max plan, your invoice says one number and your usage says another. The theoretical vs billed view prices your sessions at API list prices next to what you actually pay, which is the first real answer to whether the subscription pays for itself. On the API instead, cost comes straight from the responses, exact.
One honest note: usage cost computed from telemetry is one consistent meter, not a copy of your invoice. We price what the OpenTelemetry export reports, at list prices, the same way every time.
Every tool call is a span
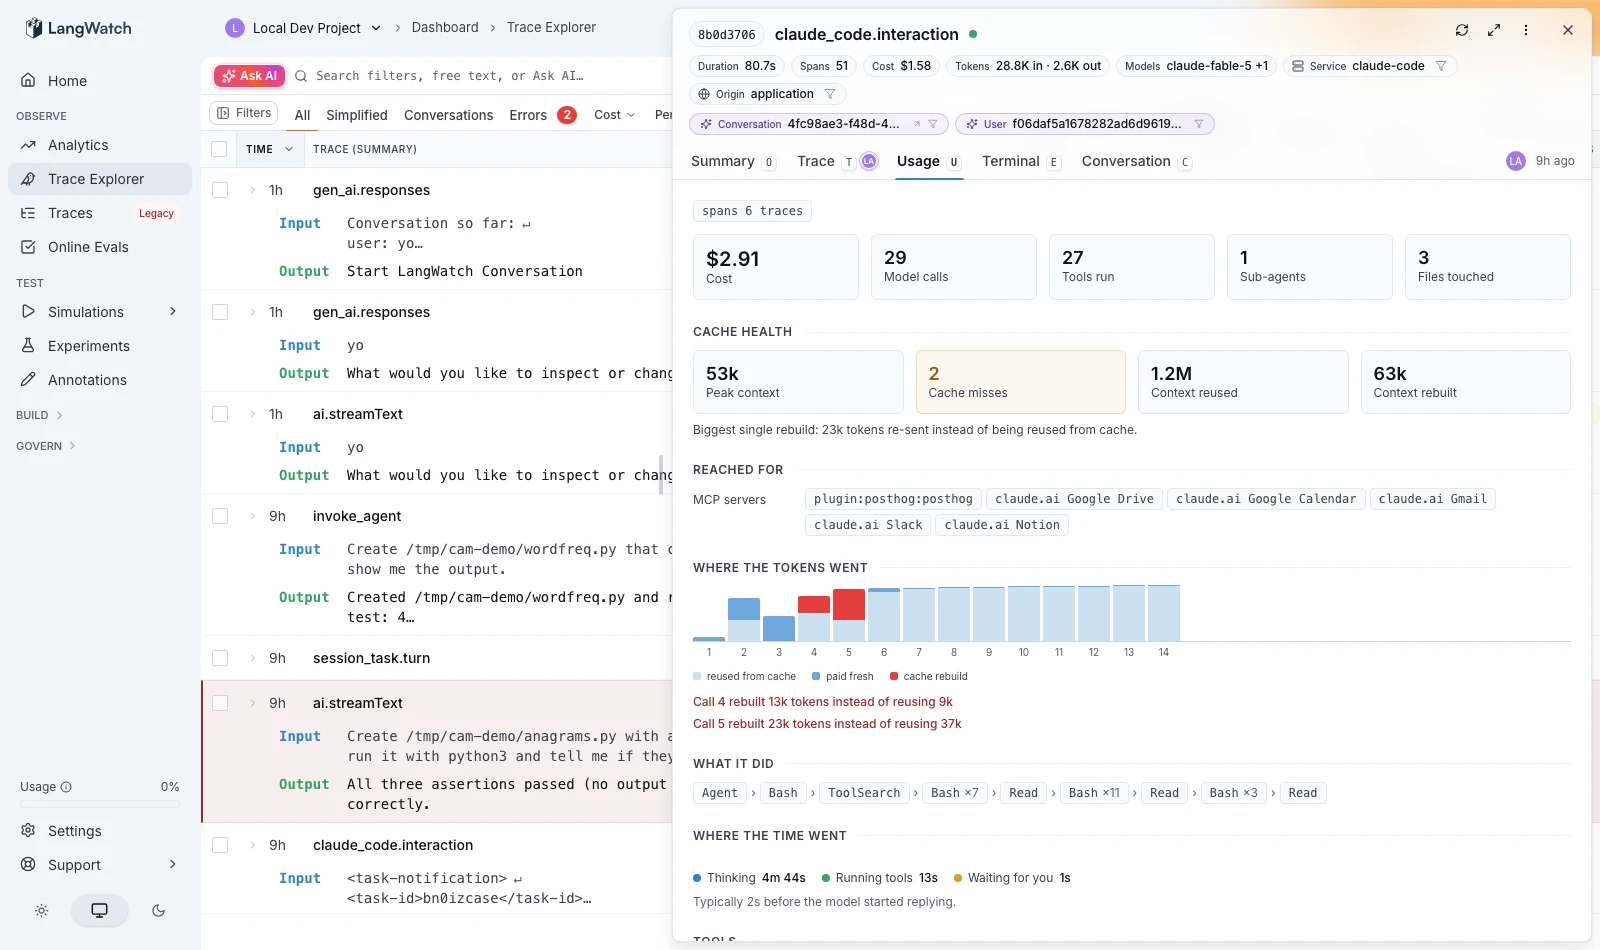
Every bash command, file edit, skill invocation, and MCP call is a span with a duration, and full input and output details. Repeated calls group in the tree and expand back into each individual one. When a session took 40 minutes and you want to know why, the answer is in the waterfall, not in your memory. The Usage tab rolls it up per session: model calls, tools run, sub-agents, cache health, and the split of time spent thinking versus running tools versus waiting for your reply.
Ask it back
Everything stays inspectable afterwards, including by the agent itself. Point Claude at the LangWatch MCP server and "where did my tokens go last week" becomes a question it answers with numbers from your own history, and then it can edit its own workflow, or write itself a skill, to fix what it finds. You can also ask Langy, the LangWatch agent, the same questions in the UI.
How it works
No magic: Claude Code ships with native OpenTelemetry export. npx langwatch claude writes three environment variables into ~/.claude/settings.json pointing that exporter at LangWatch, and that is the whole install. No wrapper process, no log scraping, and uninstalling is deleting three lines. Codex, Gemini CLI, and opencode wire up the same way with the same command.
Getting started
Sign up, run npx langwatch claude, and start a session. Signing up from a coding agent provisions a personal workspace, free for individual use, that does not count against any team plan. The full setup guide is in the docs.
The same telemetry can also power a shared view for teams, spend per person, per team, per model. That is its own story, and it gets its own post soon.
Put this into production with LangWatch.
Trace your agents, run evaluations, and turn failures into repeatable tests.
Frequently asked questions
- How do I track my Claude Code usage?
- Run npx langwatch claude once. It writes three environment variables into ~/.claude/settings.json that point Claude Code's native OpenTelemetry export at LangWatch. Every session then lands in your project with cost, token classes, tool-call spans, and a terminal replay. Free for individual use.
- Does LangWatch track cache reads separately from input tokens?
- Yes. Cache reads, cache writes, input, and output are four differently priced token classes, and cache writes split again into 5 minute and 1 hour TTLs. LangWatch tracks each class separately on every span, because lumping cache into input gets both the token total and the cost wrong.
- Does this work for Codex, Gemini CLI, and opencode too?
- Yes. The same npx langwatch command wires up Codex, Gemini CLI, and opencode the same way, and the terminal replay and usage breakdown work for every agent LangWatch tracks.
- Can I see what Claude Code would have cost on the API versus my Max plan?
- Yes. The theoretical vs billed view prices your sessions at API list prices next to what you actually pay on a Max plan, which answers whether the subscription pays for itself. On the API, cost comes straight from the responses.