Internal Product vs Internalised Trauma: Supporting Event Sourced Systems
Before we built anything custom we added metric reporting to the group queue, sent to Grafana. Group queue overview, throughput by pipeline, fold and map projection duration percentiles, retry distributions, dedup rates, fold cache hit rates
 Alex Forbes-Reed · April 20, 2026 · Developer findings
Internal Product vs Internalised Trauma
If you've been following along with this series (and if you have, it’s great to know this is interesting to at least you), you'll know that we recently rebuilt our entire platform on event sourcing. Part 1 covered what that gives you as a user. Part 2 covered how we built it, including several moments we're not especially proud of, but we overcame. This post is about the bit that comes after all of that: what happens when you deploy a distributed event processing system to production and need your tooling to be as good as the platform.
Every event sourcing retro, every conference talk, every Medium post with a suspiciously clean architecture diagram ends with deployment and rollout. That’s cool, but here is where it gets tricky. It will break, events will get stuck, something will cause events to get backed up, and projections will have bugs, and when these things happen, it’s going to hurt… Unless you have good observability and tooling to help you out.
So what happens if it’s 2am, you were at the pub, your phone pages you that 420 groups are blocked. You could check Grafana, SSH into a pod, yolo-ops commands into Redis until something happens, or invest in the second most important part of the system, the Internal Product. Once we had a finalised system, we invested a bit of time to make sure that issues with the event sourcing system are both observable and recoverable easily by our team, making potentially stressful or even just mundane, issues quick and easy to handle.
Grafana: the view from the window
Before we built anything custom we added metric reporting to the group queue, sent to Grafana. Group queue overview, throughput by pipeline, fold and map projection duration percentiles, retry distributions, dedup rates, fold cache hit rates (99.7% by the way, get in). The works.
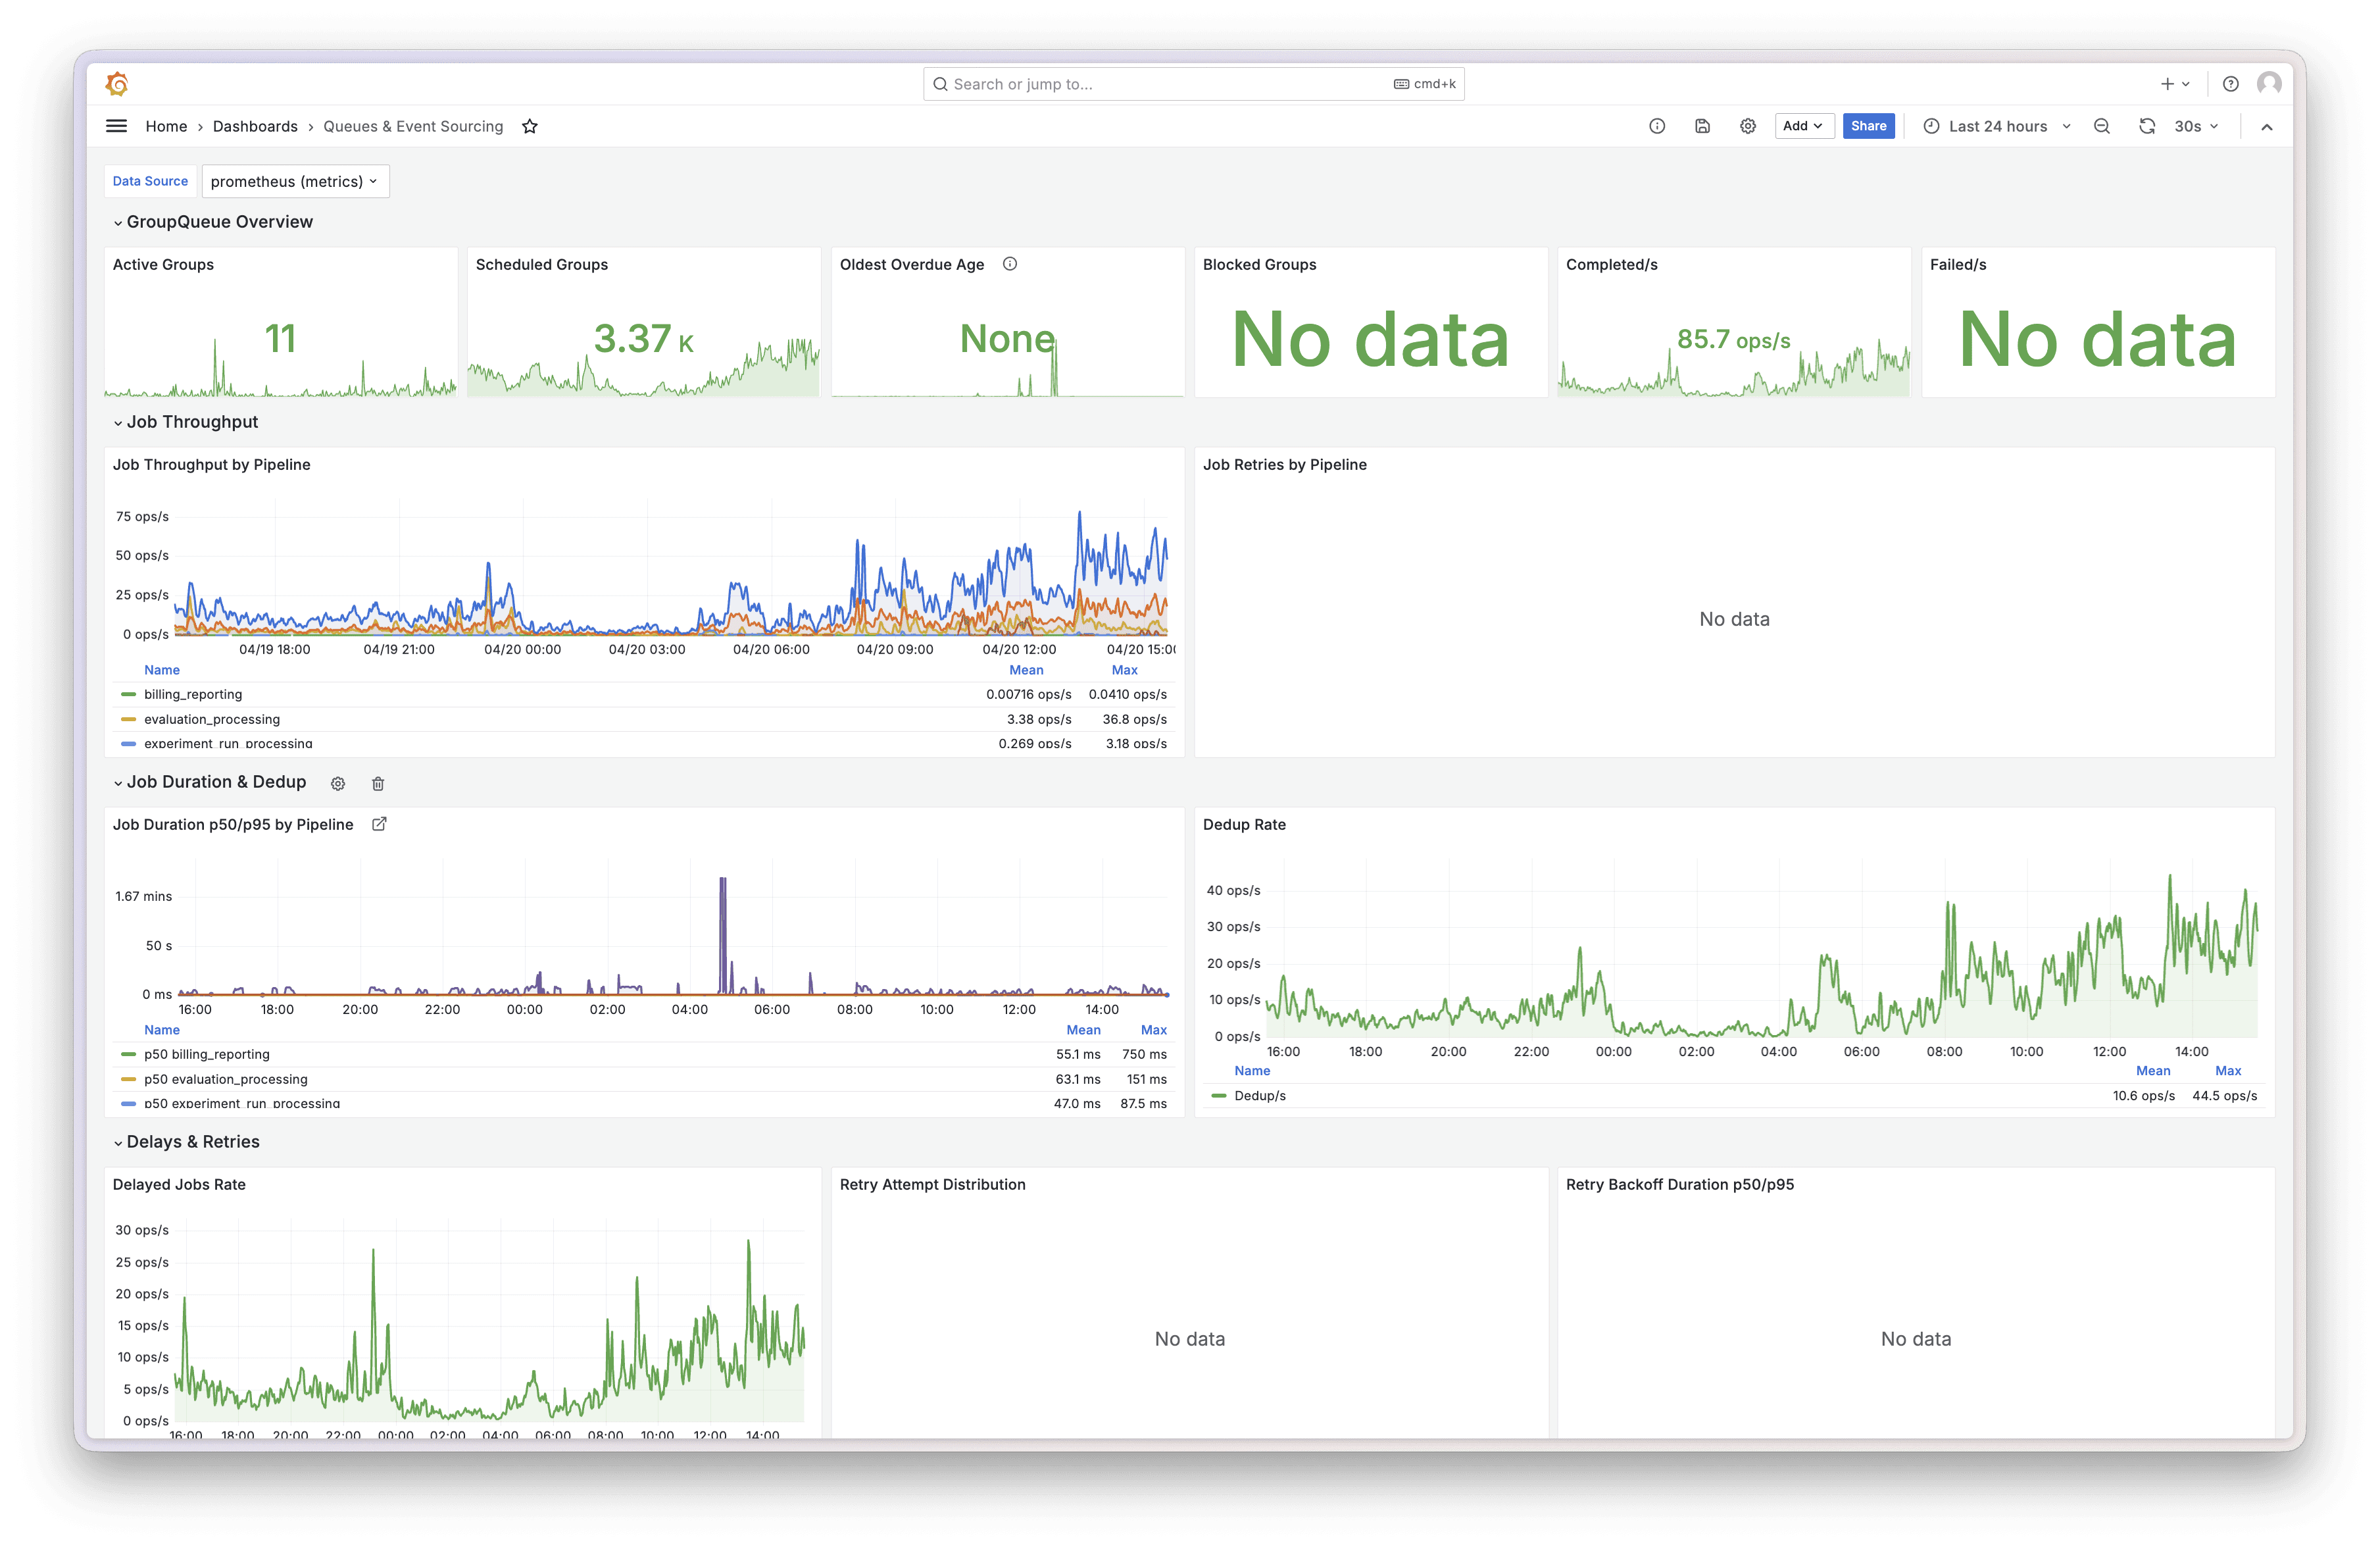
Grafana - Event Sourcing and Group Queue dashboard overview
Grafana is brilliant. Throughput charts going up means events are flowing. Blocked counter at zero means nothing is stuck. Cache hit rate near 100% means Redis is earning its keep. Two-second glance, all good, close the tab. For monitoring and alerting, it's hard to beat.
But Grafana shows you the state of the world, we can’t react or do anything super specific to our use case. When a group blocks at midnight because some customer sent a span with a negative duration, you can watch the blocked counter tick up in real time. Beautiful. Informative. But you’re powerless to make it go back down, which can be really embarrassing.
Skynet started it all, but didn’t end it all this time
The ops tooling went through two complete iterations in about two months. Here's the speedrun.
Skynet: Built a standalone React app over a weekend. Named it Skynet because Claude built most of it, thanks buddy. It contained pipeline tree views, throughput charts, stat cards, queue inspector. It worked well, actually. But it was a separate application with its own build, its own auth, its own deployment. Two browser tabs. Alt-tabbing between your product and your ops tool like some kind of animal. And it was behind our VPN, so extra friction to just check overall status.
Ops Console: Moved everything inside the main LangWatch dashboard at /ops. Same authentication with additional platform team checks, same design system, same deployment pipeline. Live metrics stream to the browser, with a polling fallback if the connection drops.
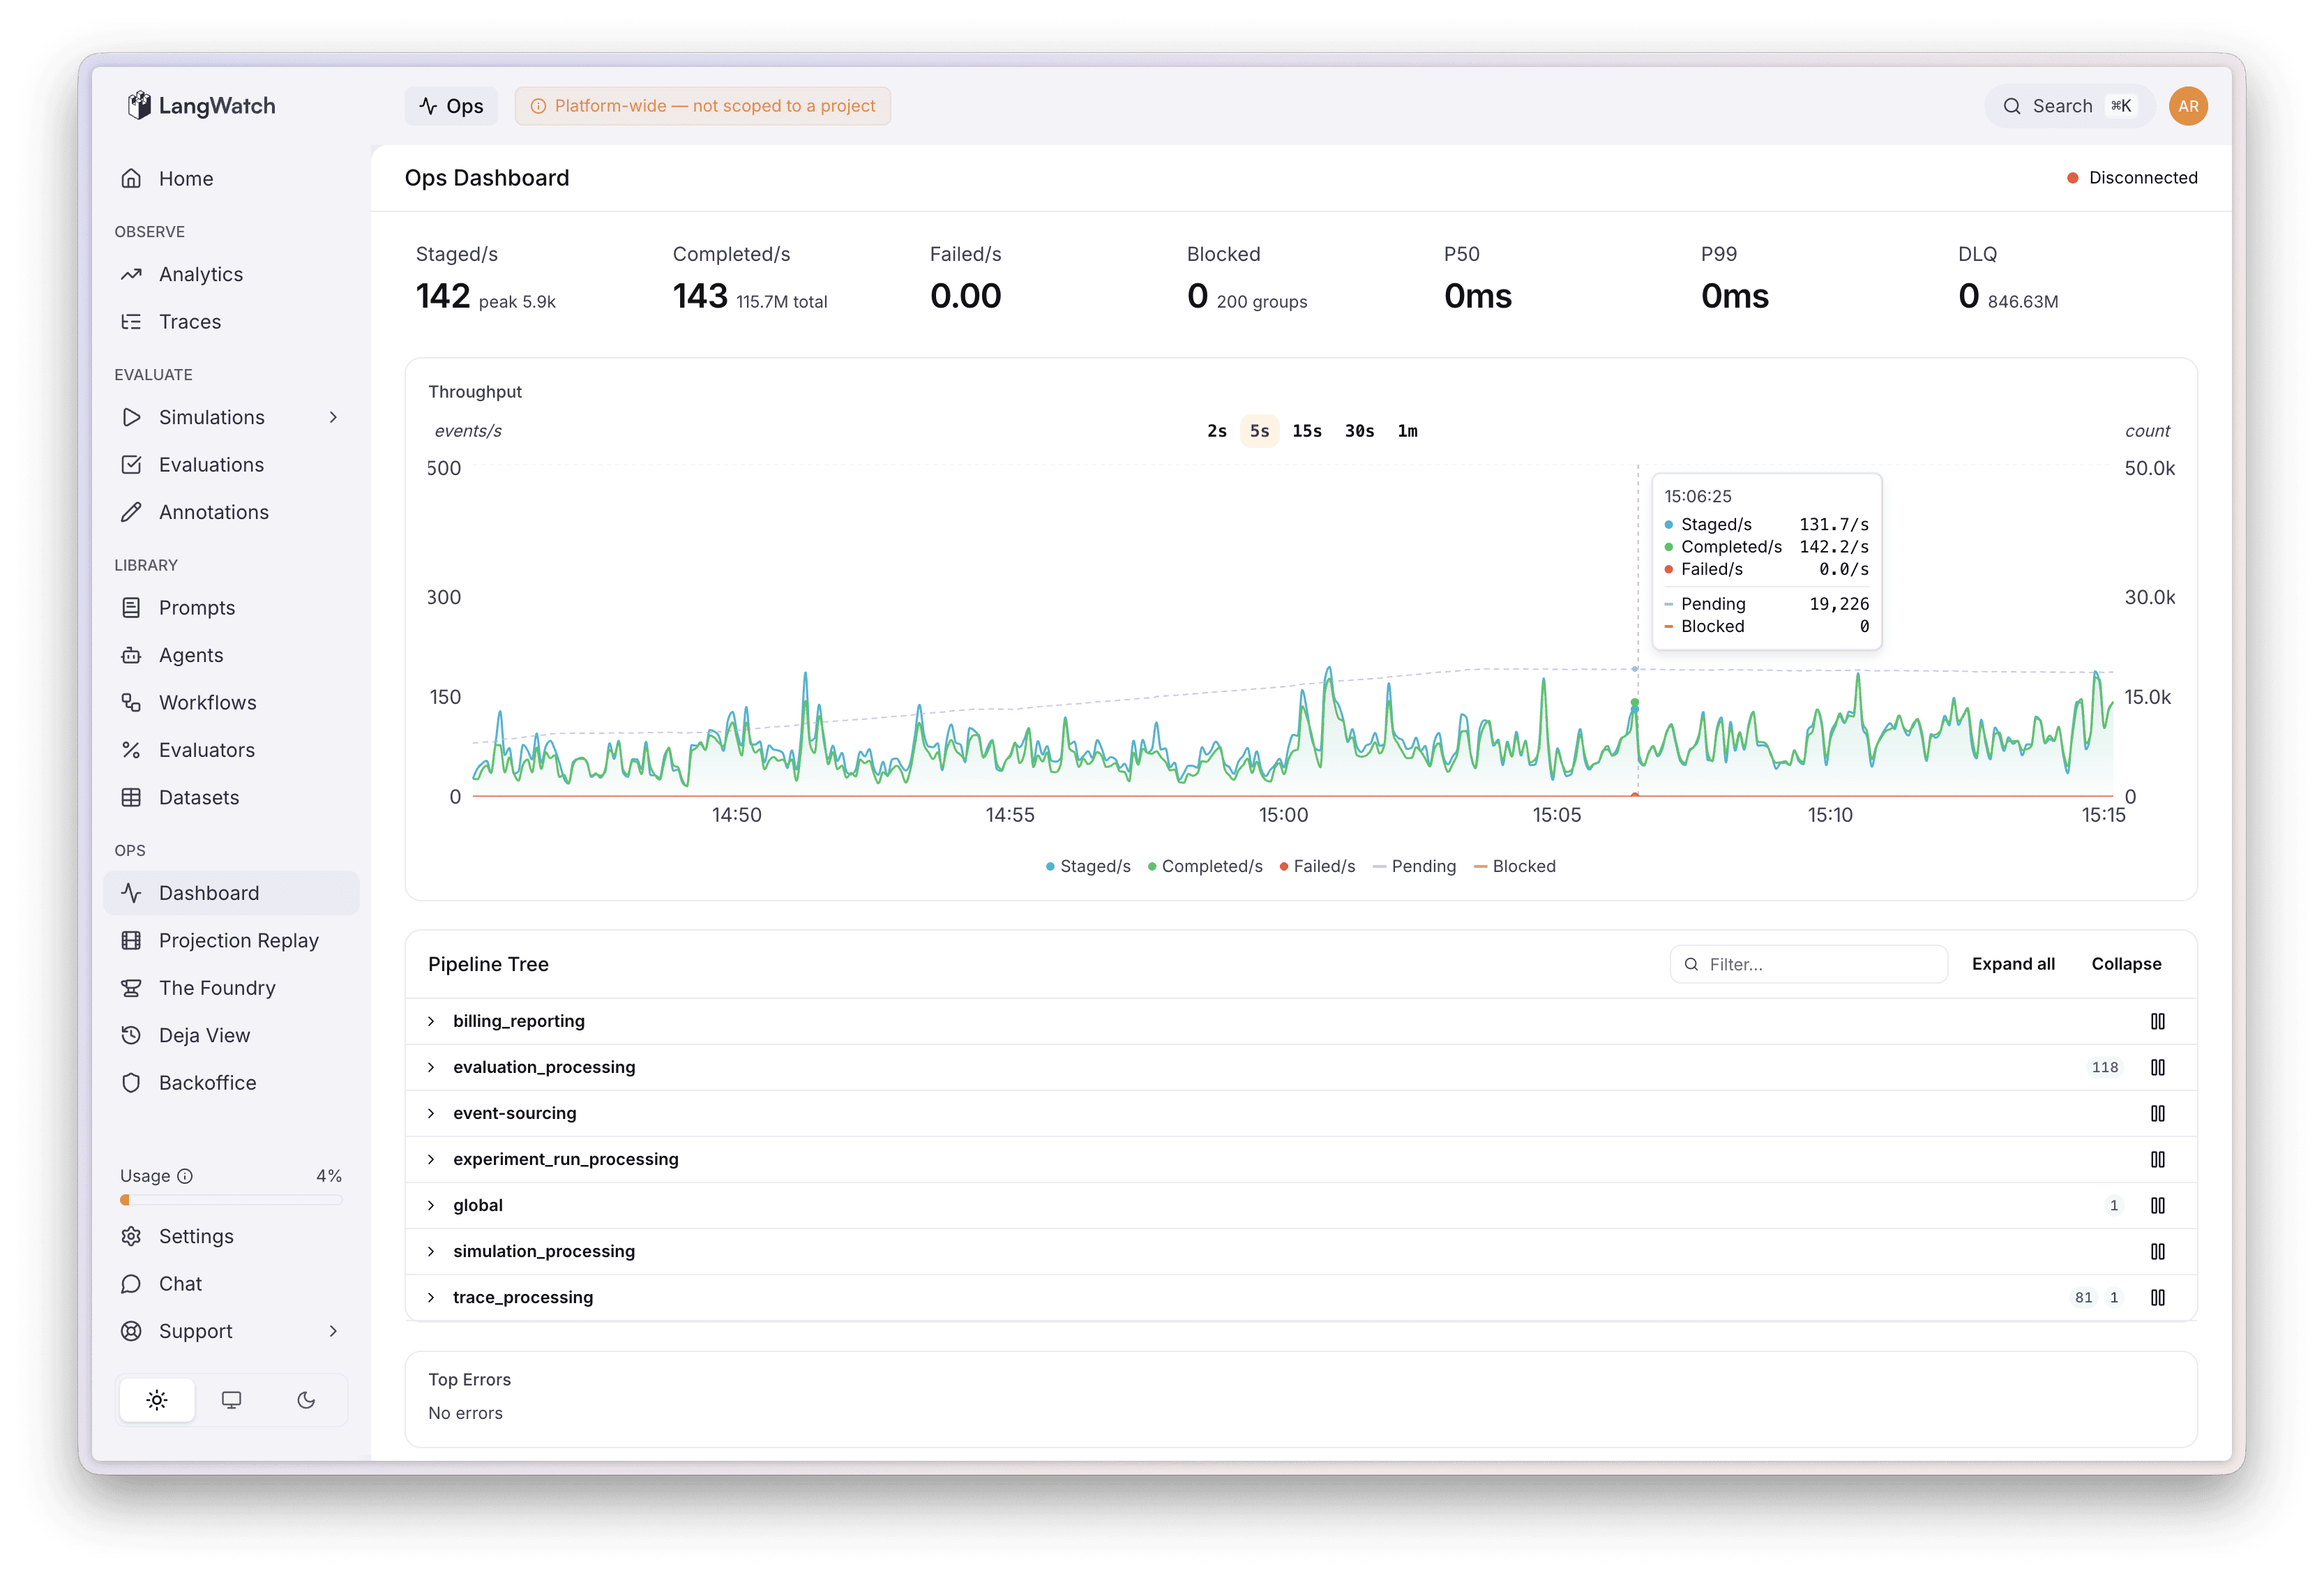
Ops Dashboard - Activity graph with pipeline, errors, and overview stats
When, not if, things go wobbly
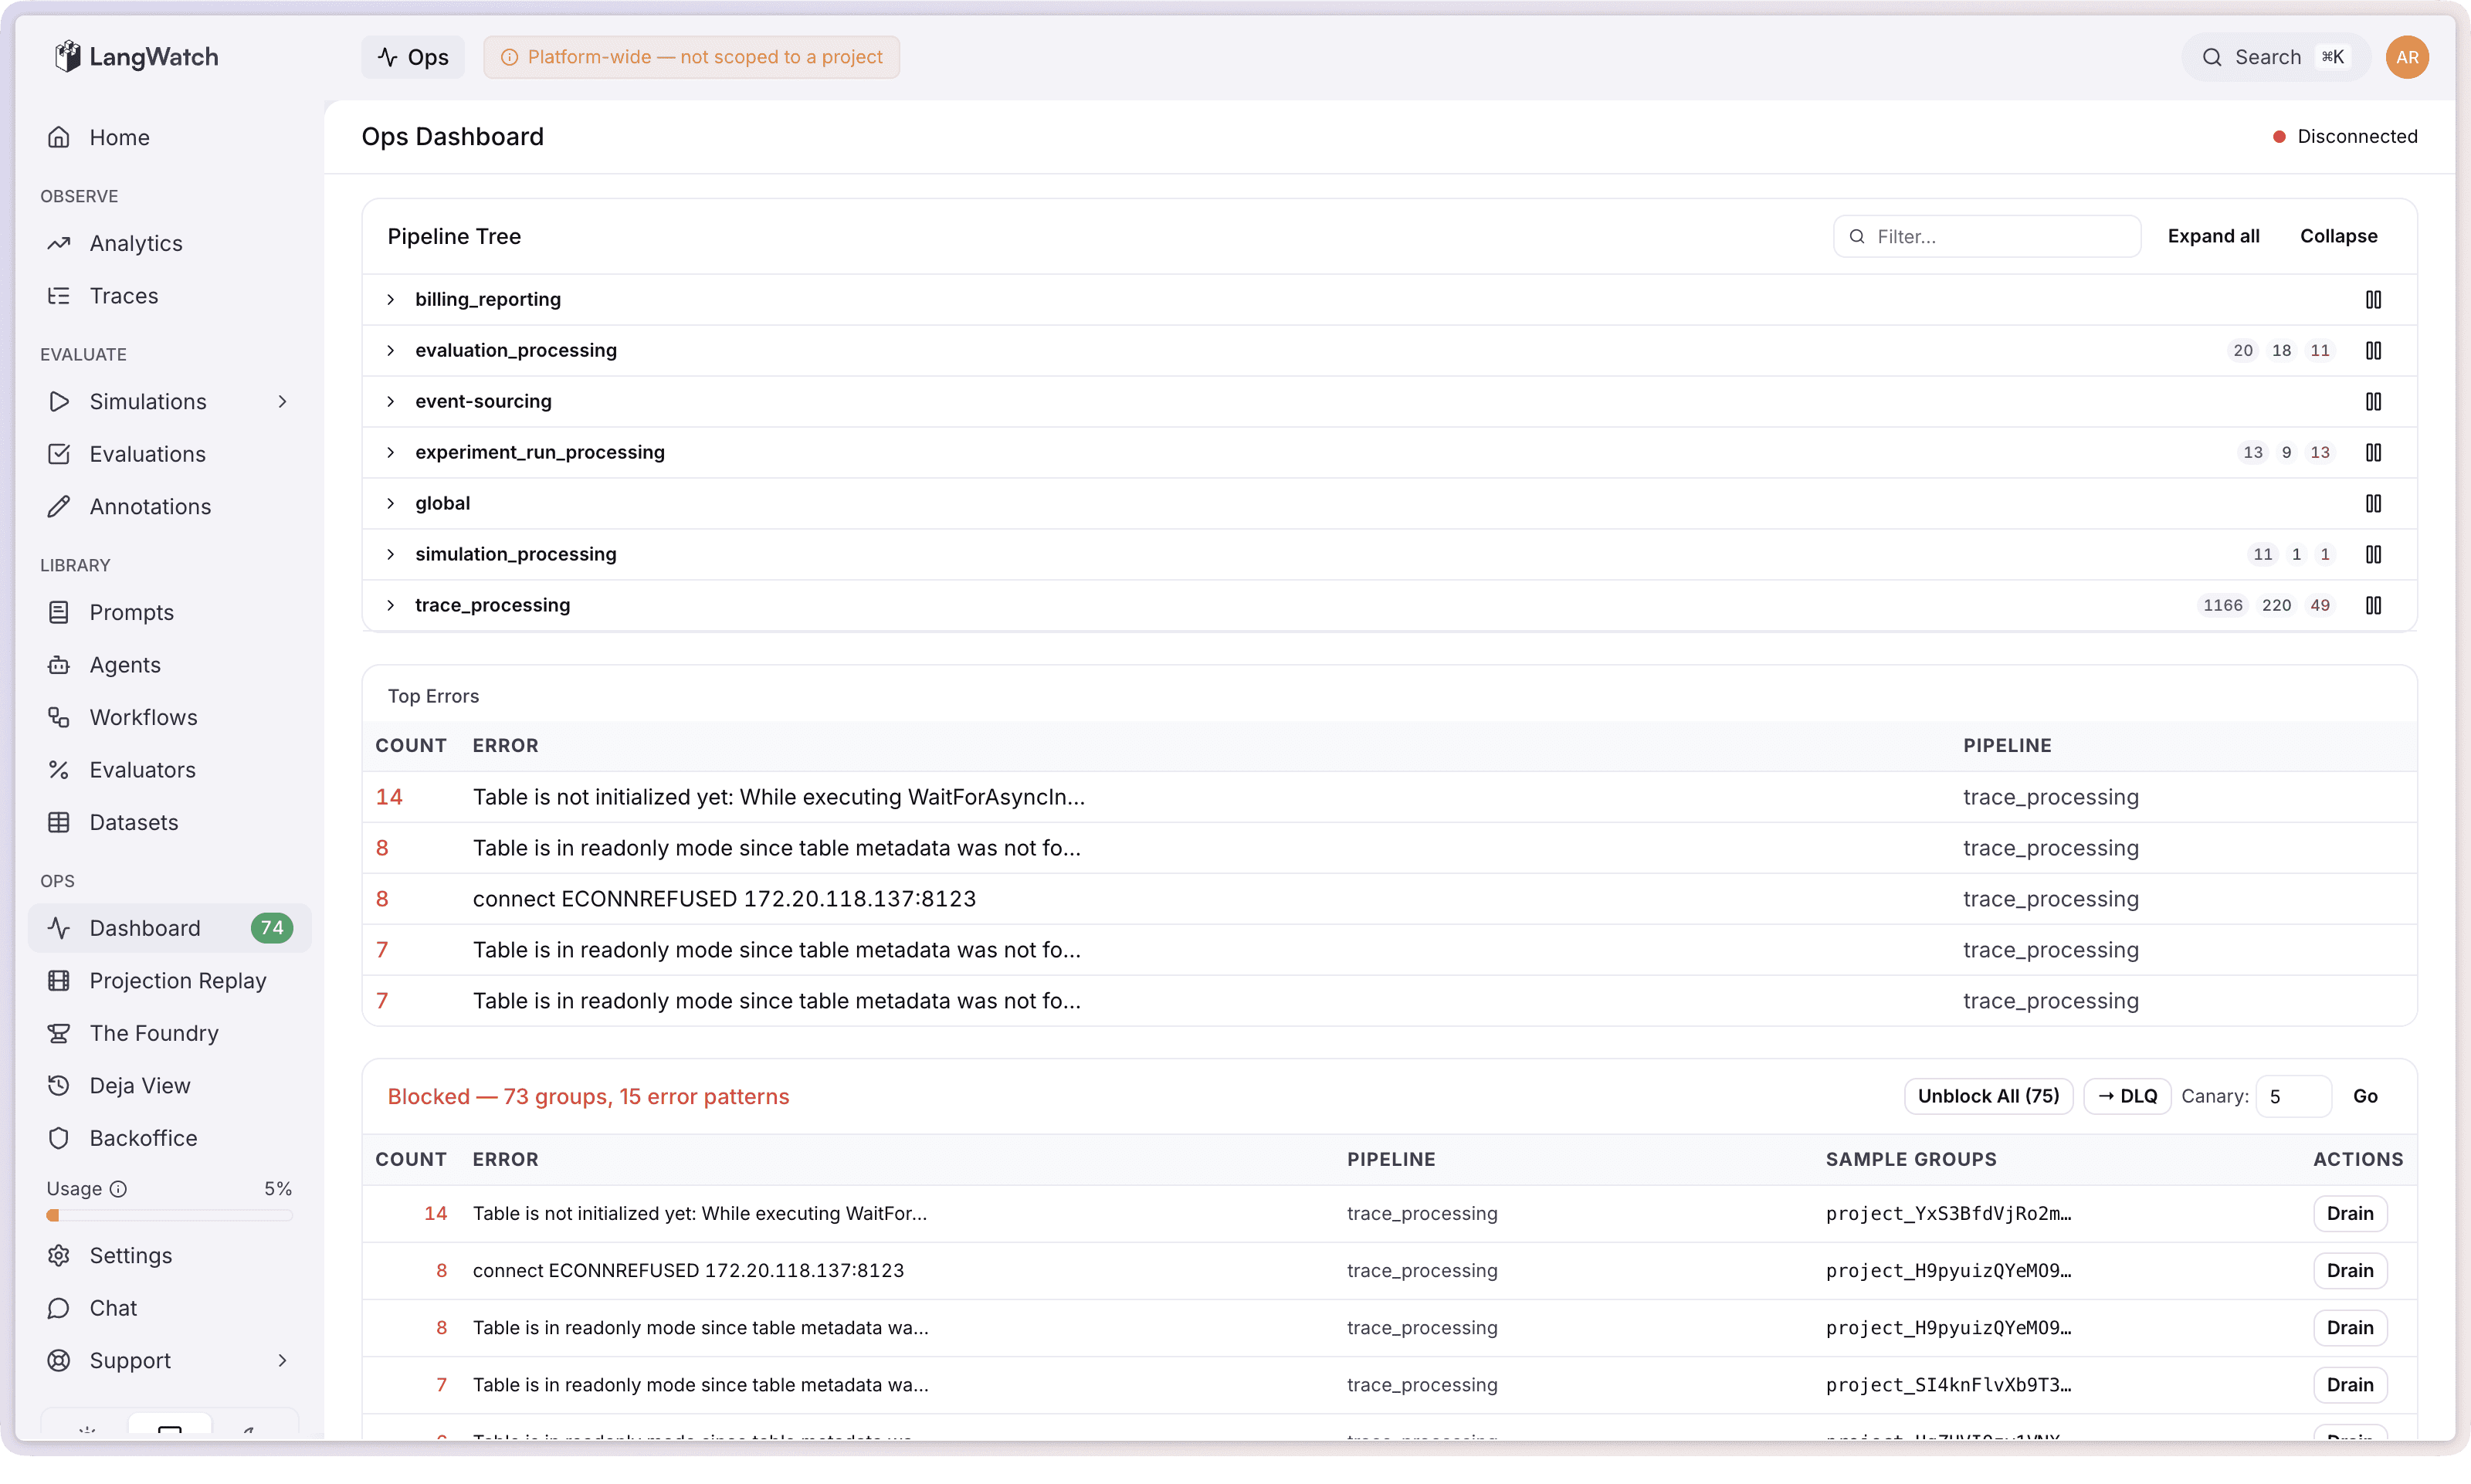
When an event fails processing too many times in our system, its aggregate group gets blocked. This is by design. One dodgy trace from one customer blocks that one group and nothing else. Everything else keeps processing normally. The investigator (hi, that's one of us) then needs to figure out what went wrong and sort it out.
The ops console clusters them by error pattern instead. 800 groups all failing with ClickHouse connection timeout? One line: ClickHouse connection timeout (800 groups). Super manageable, no annoying layout shifting. From there you can unblock all of them (ClickHouse is back, just let them retry), move them to the dead letter queue (park them while you deploy a fix), or drain them permanently (for events that will genuinely never succeed, like spans from your mother in law, just throw away).
Before any bulk action there's a canary option: try it on 5 random groups first (configurable up to 100), see if they actually succeed, then commit to the full batch. Clicking "unblock all 800" and watching 400 of them fail again could cause further system degradation in times where things are going haywire.
The DLQ re-drive workflow follows the same philosophy. Deploy your fix, canary 5 random dead letter jobs through the fixed code, and if they pass then hit "Replay All." Before we had canary re-drives this was an all-or-nothing affair, which can again cause further system degradation if it does not go to plan.
Projection replay: your old data just got better
This is a true event sourcing super power, one to call home about.
In a normal system, when you fix a bug in your data processing logic, the fix only applies to new data. Everything that was processed before the fix is stuck with the broken version forever. You either live with it or write a one-off migration script and do some cowboy ops to run it on the prod cluster or waste half a day.
With event sourcing, the raw events are the source of truth. The processed views (projections) are derived, and they can always be rebuilt. Fix your fold logic, replay the historical events through the new code, and every affected trace gets retroactively updated. It’s genuinely that simple.
The replay wizard in the ops console: pick which projections to replay, pick which tenants, pick how far back, write a description for the audit trail, and smack go. Progress streams to the UI live. Cancel any time (gracefully, it finishes the current batch). Every replay gets logged with who ran it, when, what projections, how many aggregates and events.
Cost calculation been slightly wrong for two weeks because of an edge case nobody thought of? Fix the fold, replay for the affected tenants, in and out, 5 minute adventure. The events are facts. The views are just formed opinions about the facts, and opinions can always change, right?
Deja View: the time machine
This is my personal favourite, and funnily enough it's actually the oldest piece of ops tooling we have. It predates Skynet, predates the ops console, it's been quietly doing its thing since January 2026 while we were busy panicking about everything else.
Deja View lets you search for any aggregate in the system, whether that's a trace, an experiment run, a scenario, whatever you like, and load its complete event history. You then step through it event by event, and at each step you can compute what any projection's state would look like at that point in time. It's essentially time-travel debugging on your production data, and honestly it feels a bit like cheating.
Real example: customer messages us saying their trace is showing the wrong cost. Open Deja View, search their trace ID, click through the events one by one. Event 1, cost looks right. Event 2, still fine. Event 4: a span arrives with cost: null and the running total resets to zero. Found it. The fold doesn't handle null costs, but now we know exactly “who what where when and why?”
The whole view state is encoded in the URL too, so you can copy the link and drop it in Slack: "look at event 7, cost goes to zero here." My team mate opens it and sees exactly what I see. To resolve it, fix the fold, deploy, replay the affected projection from the previous section, and the customer's trace is correct. Every other trace with the same bug is also correct.
Having these three tools work together is one of the best workflows we've built at LangWatch, they really do remove so much friction from supporting the platform.
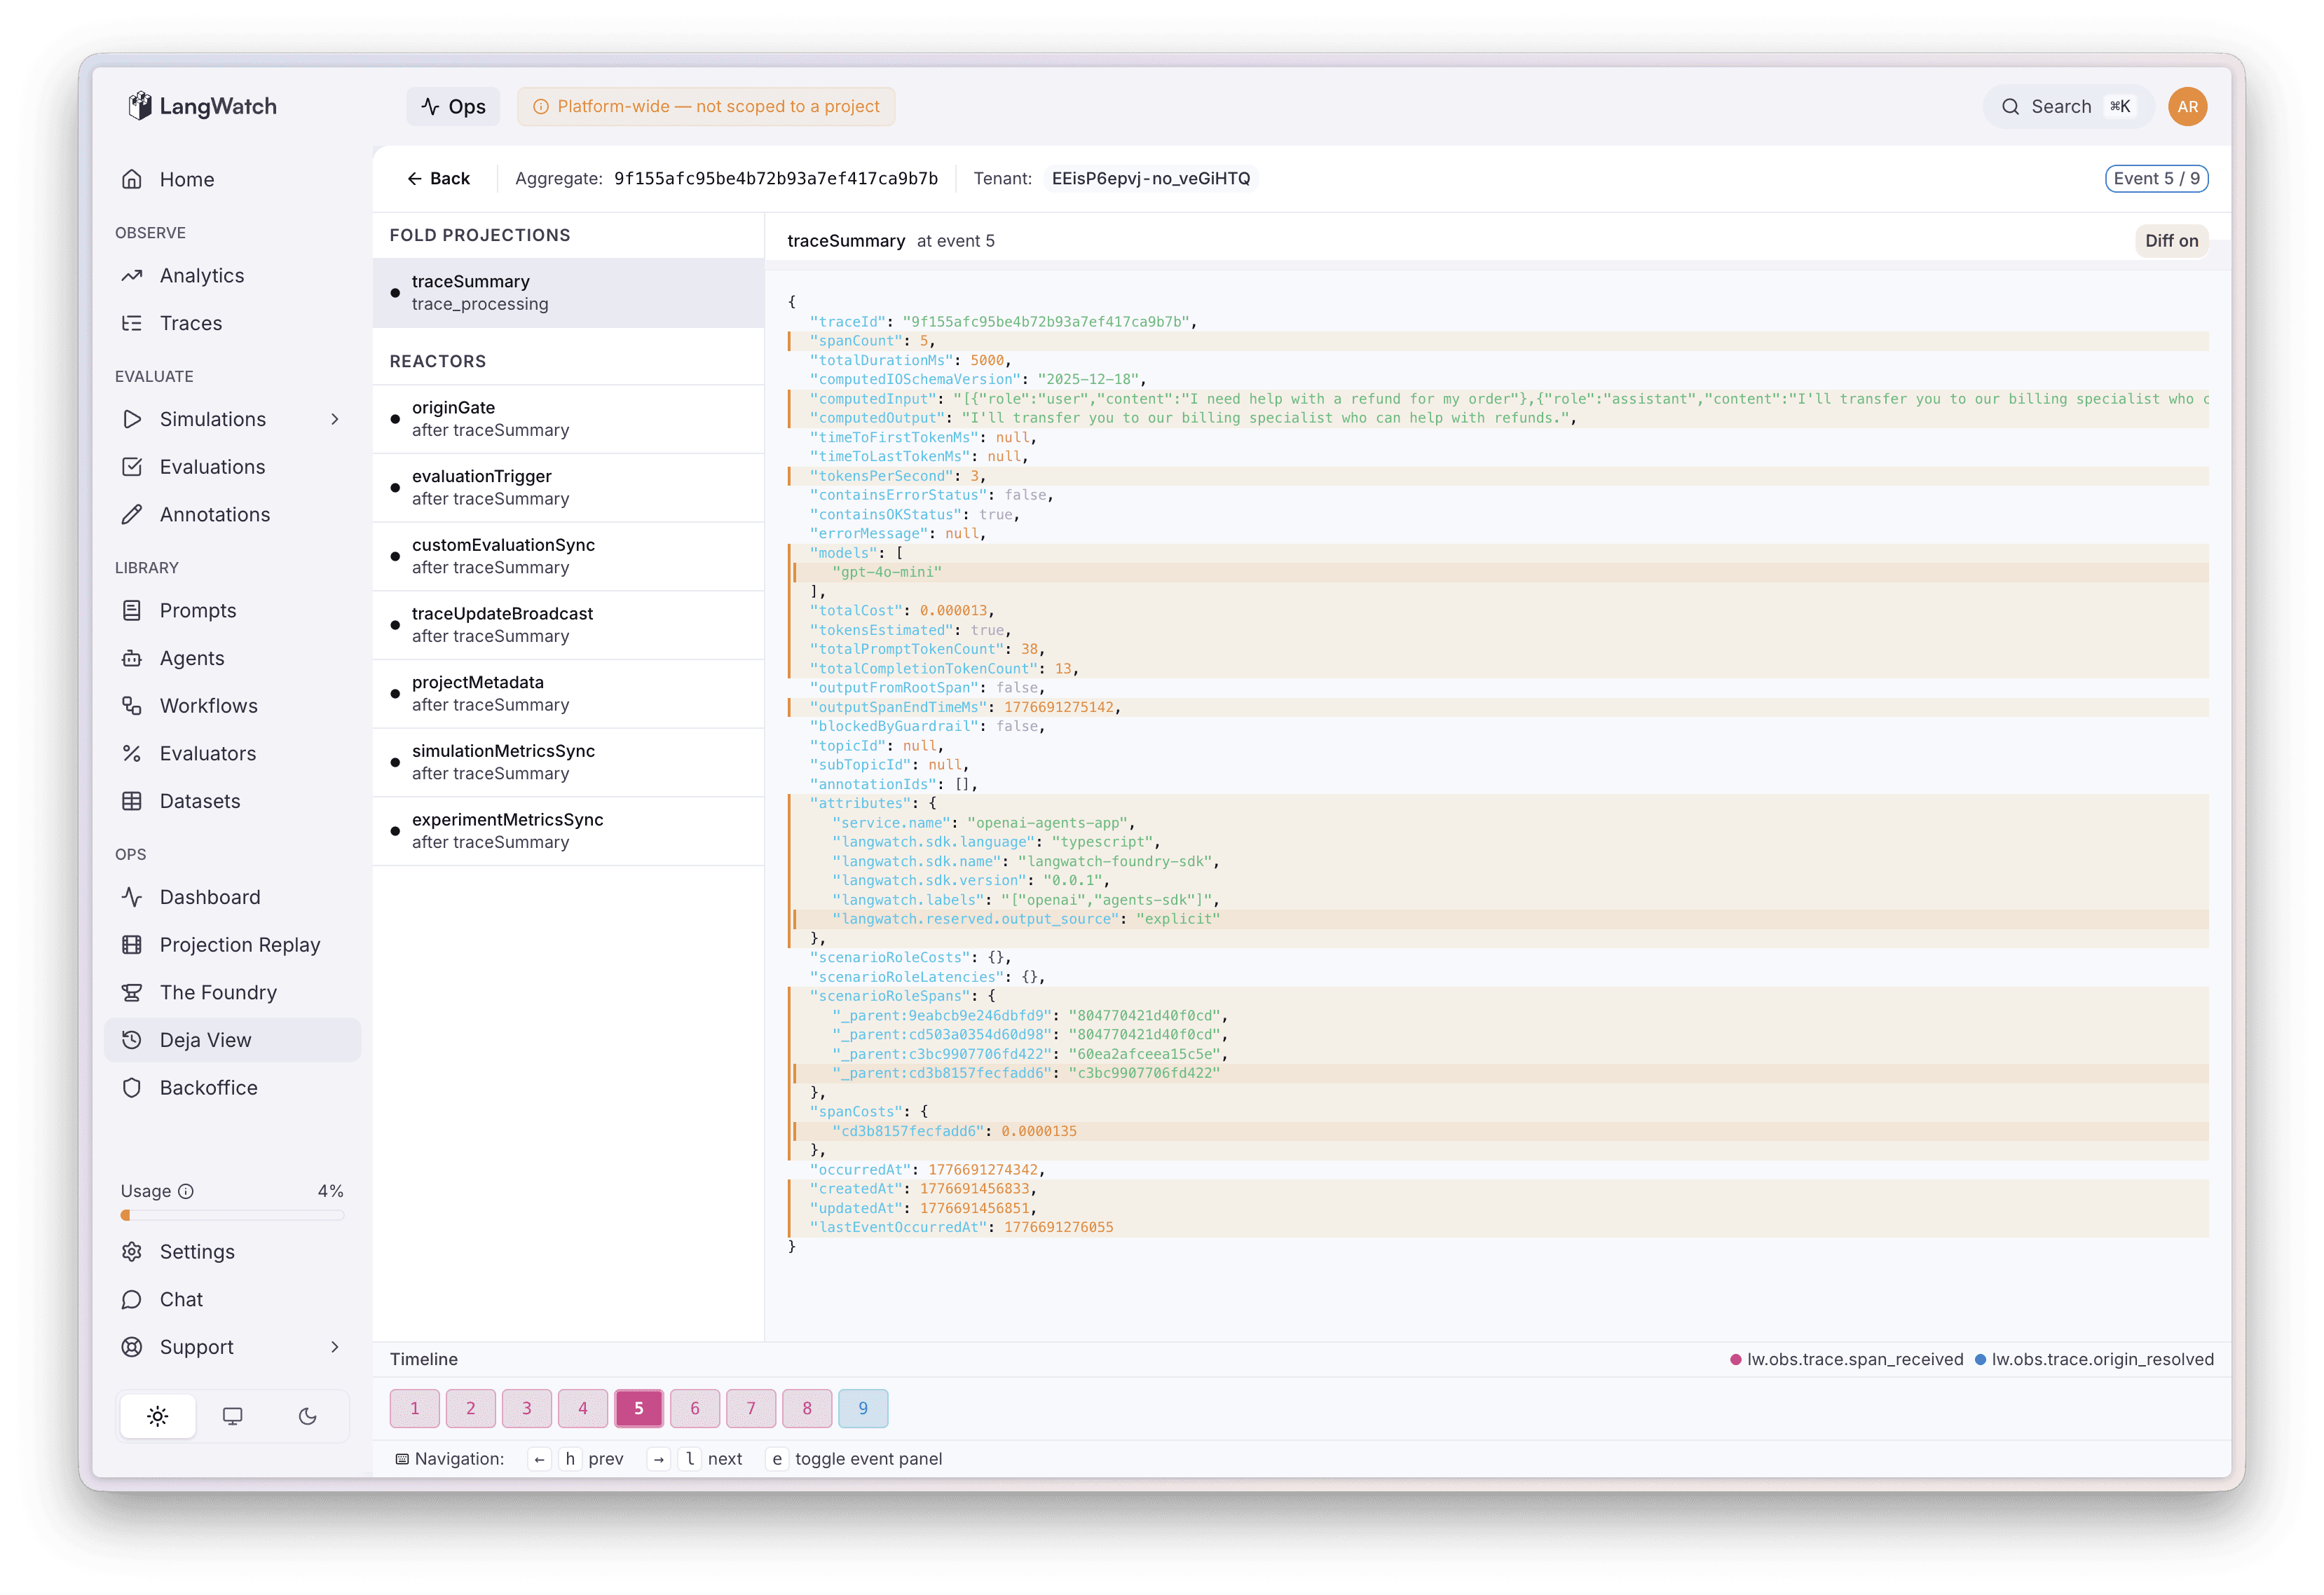
Deja View - Seeing how a projection is computed though the event stream
*Part 1: Eat Sleep Append Repeat · Part 2: Four Refactors and a Funeral · Open source at github.com/langwatch/langwatch*
Put this into production with LangWatch.
Trace your agents, run evaluations, and turn failures into repeatable tests.
Frequently asked questions
- Why isn't Grafana enough to support an event-sourced system?
- Grafana shows you the state of the world for monitoring and alerting, but you cannot act on it. When a group blocks at midnight you can watch the counter rise but not fix it, so LangWatch built an ops console for recovery actions.
- What happens when an event keeps failing in production?
- After too many retries the aggregate group is blocked by design, which isolates one bad trace without affecting others. An operator then inspects the error, fixes the cause, and unblocks the group, often in bulk with a canary step first.
- What is Deja View?
- Deja View is a time-travel debugging tool that loads any aggregate's full event history so you can step through events one at a time and compute what any projection's state looked like at each point, making production bugs easy to pinpoint.