
One trace, two layers: OpenTelemetry between your LLM app and your cache
Every layer of the AI stack grew its own observability. Co-written with BetterDB: how cache decisions and LLM generations composed into one OpenTelemetry trace with zero custom glue, and what that buys teams running caches under their LLM apps.
 Manouk Draisma · August 12, 2026 · Integrations
Co-written by Kristiyan from BetterDB and Manouk from LangWatch.
Let's face it: every layer of the AI stack has grown its own observability.
LLM tracing tools show you the prompt, the model, the tokens, the latency, and they've gotten genuinely good at it. Cache and data layers track hit rates, TTLs, and dollars saved, and they've gotten good at that too. Each layer answers its own questions well. What's been missing is the merge: one place where the turn that cost nothing and the cache decision that made it free sit in the same trace.
This is a story about fixing that with zero custom glue, because both of our products have chosen to speak the same language: OpenTelemetry.
The problem: every layer gets its own observability silo
The typical AI stack today has observability split per layer, each in its own app.
LLM traces live in an LLM observability platform. Cache hit rates live in a Grafana dashboard, or a CLI, or nowhere. Memory and retrieval metrics live in a third place, if they exist at all. Nothing connects a specific cache decision to a specific turn.
So when someone asks "why was this answer instant and free?", the honest answer is usually "the cache, probably." Probably. You can see the aggregate hit rate went up. You cannot point at the turn and show the decision that made it cheap.
The layers are doing their jobs. They just can't see each other.
The thesis: OpenTelemetry is the common language
OpenTelemetry is vendor-neutral, CNCF-governed, and boring in the best possible way. Instrument once, send anywhere. GenAI semantic conventions are emerging for LLM workloads, and the ecosystem is converging on spans as the shared unit of "what happened."
The mechanism that makes this article possible is almost embarrassingly simple: if the application layer and the data layer both emit standard spans against the same global tracer, they compose into one trace. No integration meetings. No SDK-of-SDKs. No coupling between the two products at all.
That's the whole trick. The rest of this article is just proof.
The setup
The subject is BetterDB's playground chat app (chat.betterdb.com), an open-source RAG chatbot that answers questions about Valkey, Redis, and related docs. It uses the @betterdb/* packages for semantic caching, exact-match LLM caching, and per-user memory, all on Valkey. We wired it into LangWatch, an open-source platform for agent simulation, evaluation, and observability.
Here's what "wired" actually means, and what it doesn't.
No LangWatch SDK calls in application code, by choice. LangWatch ships SDKs for TypeScript, Python, and Go that make instrumentation a few lines, and for most teams they're the fastest path. We deliberately skipped them here to prove a point about flexibility: the app puts plain OTel semantics on standard spans (a span type attribute, thread and user IDs, RAG contexts) and exports them over OTLP/HTTP. That's it.
LangWatch is OTel-native in both directions. The platform ingests standard OTLP traces with no proprietary agent, and its own SDKs are built on OpenTelemetry and emit standard spans rather than a closed format. The symmetry means integration works either way: an app with zero LangWatch code (like this one) lands in LangWatch as-is, and an app instrumented with the LangWatch SDK exports spans any OTel backend can read. The only LangWatch-specific convention in play is langwatch.span.type (chain, llm, rag, tool), a plain span attribute that tells the platform how to render each span: RAG contexts on rag spans, model I/O and cost on llm spans. langwatch.thread.id and langwatch.user.id group traces into conversations, so a multi-turn chat reads as one conversation instead of disconnected requests.
The @betterdb packages needed zero wiring. This is the part that still feels slightly unfair. The semantic_cache.*, agent_cache.*, and agent_memory.* spans already instrument themselves against the global OTel tracer via trace.getTracer(). Registering a provider lights them up automatically, cache keys, hit/miss, TTLs, and models included, with proper instrumentation scopes.
The AI SDK joins the same trace the same way. The Vercel AI SDK ships built-in OTel instrumentation behind a flag called experimental_telemetry. Enable it per call and the SDK emits spans for LLM generations, tool calls, and token usage against the same global tracer.
Count the codebases: the app, the AI SDK, the BetterDB packages. Three independent pieces of software, none of which know about each other or about LangWatch. Each one asks the global OTel API for a tracer and emits spans. When no provider is registered, they get no-op tracers and the whole thing costs nothing. When one is registered, context propagation nests everything into a single trace.
The honest headline: no new instrumentation code was written to connect the two layers. Both sides were already speaking OTel.
The demo: same question, twice
Ask the chatbot a question it hasn't seen. Then ask it again.
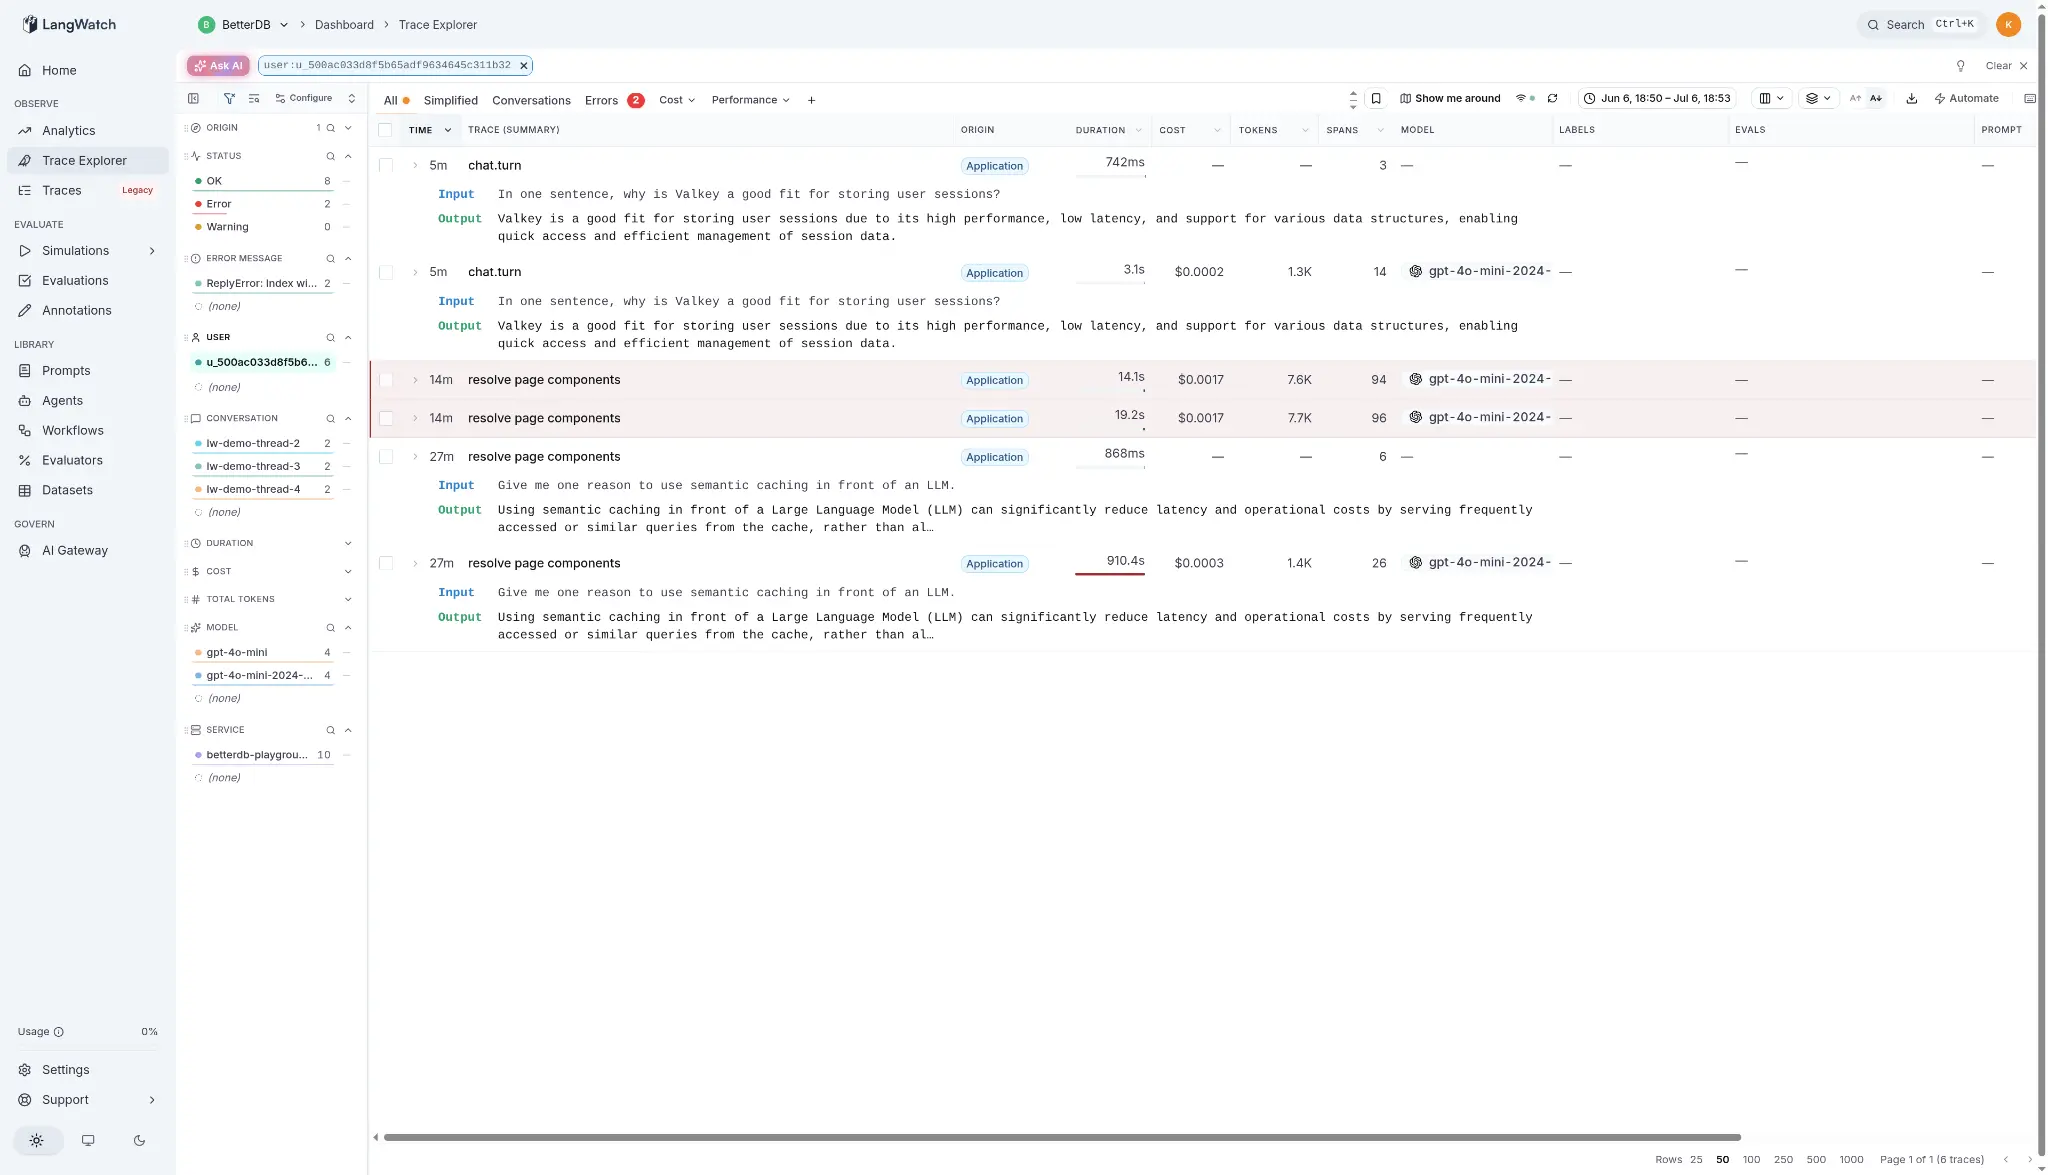
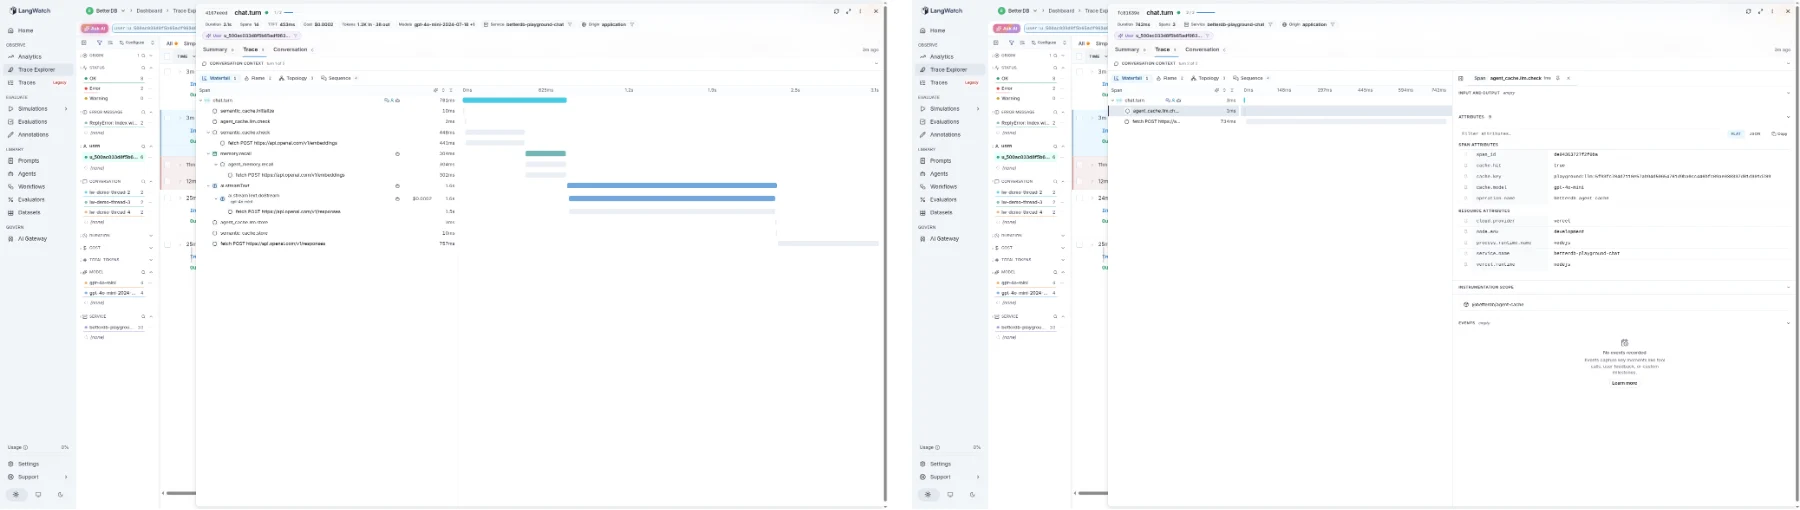
The miss: 3.1s, $0.0002, 14 spans. The full waterfall is there: cache checks, memory recall, vector search embeddings, and finally ai.streamText doing the actual work, 1.2K tokens in, 38 out.
The hit: 742ms, 3 spans, and no LLM span at all. A 3ms agent_cache.llm.check with cache.hit=true sits where seconds of ai.streamText used to be, with the saved dollars recorded right on the span.
That absence is not a filtering trick. streamText never ran, so the SDK never emitted anything. The waterfall is showing you the actual control flow.
And because the Trace Explorer surfaces duration, cost, tokens, and model per trace at the list level, the contrast is visible before you open a single trace. Cost, TTFT, and token roll-ups change based on cache behavior, in the same view as the rest of the pipeline. The cache stops being an aggregate dashboard claim and becomes a per-request fact.
Privacy defaults, because traces leave your process
By default, spans carry metadata only: hit/miss, similarity, latency, cost. Prompts, responses, recalled memories, and retrieved documents are attached only when content capture is explicitly enabled. That makes it safe to point a production deployment at a shared project. Metadata-only defaults plus both platforms self-hosting is what makes this production-safe for teams in regulated industries (banking, payments), and you turn the full payloads on for demo or dev environments where seeing them is the point.
What this means beyond these two products
Here's the part we like most, and it's the part that makes neither of us the hero: nothing in this integration is specific to BetterDB or LangWatch beyond the fact that both speak the standard. Any OTel-native tool pair could do the same. That's what an open standard buys you: the integration is not a partnership artifact, it's what falls out for free when everyone builds to the same conventions.
For teams running caches and memory under their LLM apps, those layers stop being a black box and become visible infrastructure inside a tool the team already uses. For the observability side, it's a trace shape most demos don't have: cache-aware LLM pipelines where the savings are attributable per request.
And once cache decisions are spans, they become evaluable. Running evaluations over semantic-cache hits, checking that a served answer actually fits the new question, isn't even a project anymore: LangWatch's Skills give Claude Code the context to write that eval, derive the criteria from your codebase, and run it in a single session. Traces stop being just debugging material and become eval datasets.
Run it yourself
Both platforms are open-source and self-hostable, so the entire demo runs locally end to end: the chat app, Valkey, and LangWatch via docker compose. No cloud account required to reproduce any claim in this article.
# self-hosted LangWatch (docker compose up in the langwatch repo), then:
LANGWATCH_API_KEY=sk-lw-... \
LANGWATCH_ENDPOINT=http://localhost:5560 \
LANGWATCH_CAPTURE_CONTENT=true \
pnpm dev
Links: the playground repo, the @betterdb packages on npm and PyPI, the LangWatch repo and docs.
Closing
Two independent layers. One trace. No lock-in in either direction.
Neither of us wrote integration code for the other, and that's exactly the point. The value is in the open standard: build to OpenTelemetry and full-stack visibility between your cache and your application layer is not a feature you buy. It's what you get.
Put this into production with LangWatch.
Trace your agents, run evaluations, and turn failures into repeatable tests.
Frequently asked questions
- How did BetterDB spans show up in LangWatch without an integration?
- Both layers speak OpenTelemetry. The app exported standard OTLP/HTTP spans with plain OTel semantics, and LangWatch ingests standard OTLP with no proprietary agent. Context propagation nested the app, the Vercel AI SDK telemetry, and the @betterdb/* packages into one trace with no shared code.
- What does langwatch.span.type do?
- It is a single plain span attribute that says whether a span is a chain, an LLM call, a RAG step, or a tool, which is enough for LangWatch to render retrieved contexts on RAG spans and model I/O and cost on LLM spans. langwatch.thread.id and langwatch.user.id group requests into a conversation. It is light convention on top of the standard, not a proprietary protocol.
- Why does the LLM span disappear on a cache hit?
- Because the model never ran. The cache check short-circuited the expensive work, so nothing emitted an LLM generation span. The trace reflects the real control flow rather than a story told after the fact, and the saved cost is written onto the cache span itself.
- Can you evaluate semantic cache decisions with LangWatch?
- Yes. Once a cache decision is a span carrying similarity, the served answer, and the new question, it doubles as an evaluation dataset. You can run an evaluator over semantic-cache hits to confirm each reused answer holds up against the question it was served for; LangWatch Skills let Claude Code derive the criteria, write the eval, and run it in one session.