
The AI Governance Platform
One dashboard for the AI your teams run: spend, usage, anomalies and policy, fed by your own app traces, LangWatch AI Gateway traffic, and activity pulled from third-party AI platforms.
What You Can Do Now
One dashboard for every AI tool
-
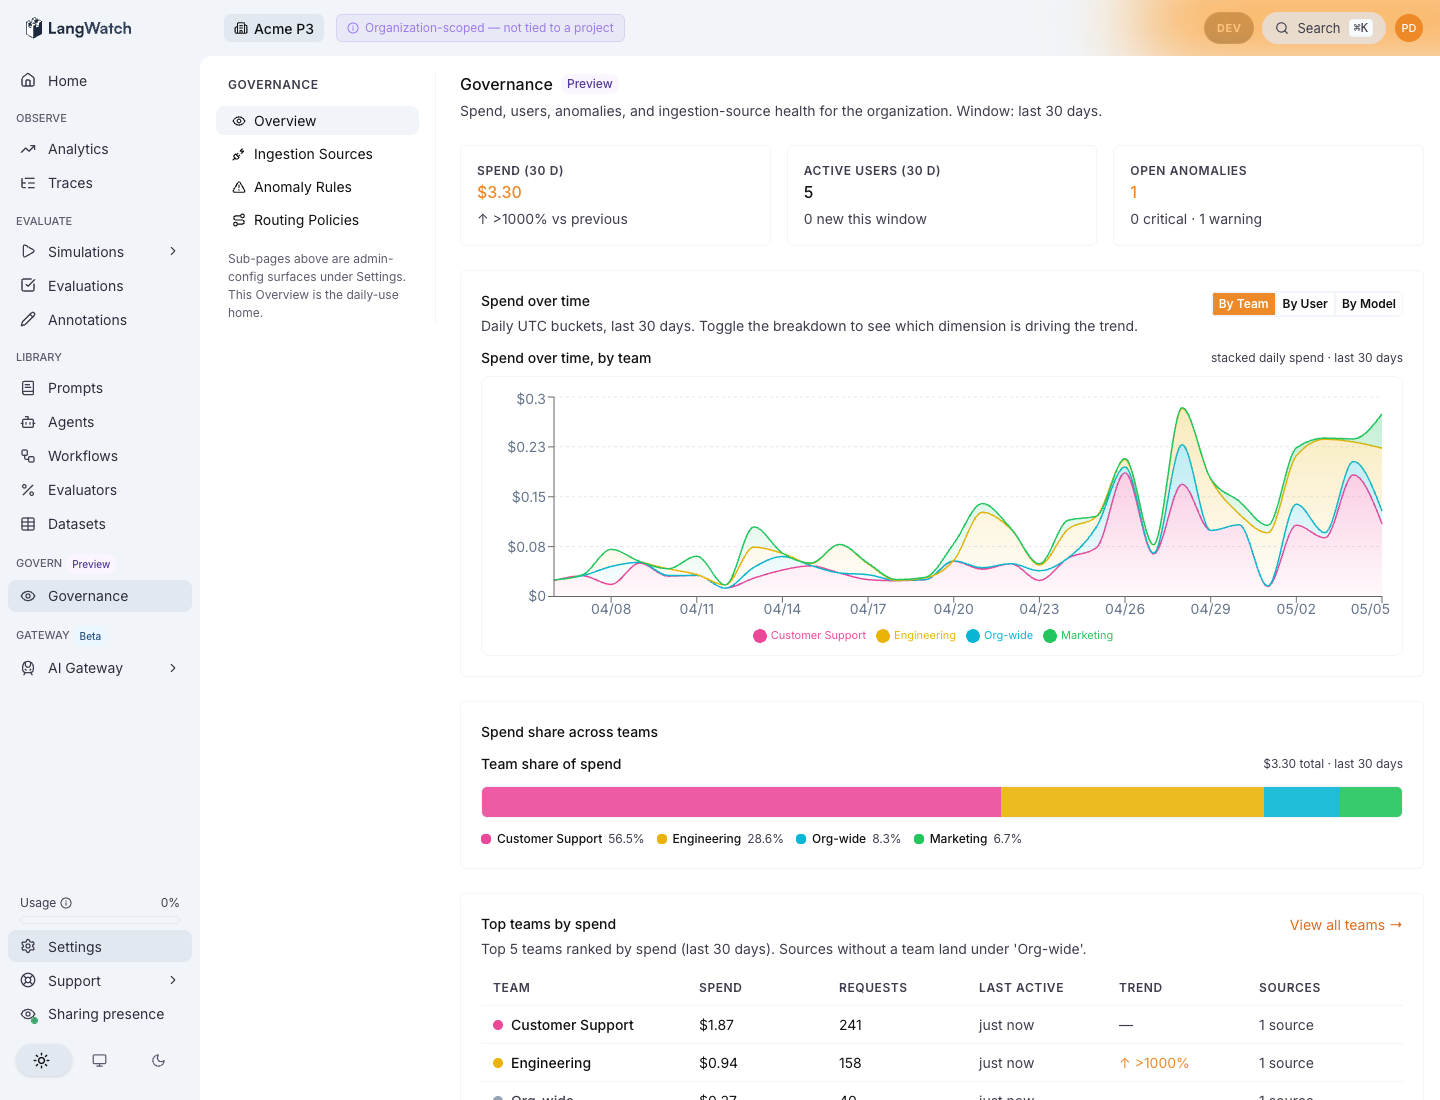
See spend, active users, anomalies, and ingestion-source health for your whole organization in one Governance overview, broken down by team and by model over time.
-
Connect ingestion sources to pull AI activity from the platforms your teams already use (via OTel push, webhook, or S3 audit drop) and view it next to your own application traces and gateway traffic in one store.
-
Set routing policies that decide which providers and models virtual keys may use, anomaly rules that page on-call when usage drifts, and browse the tool catalog.
-
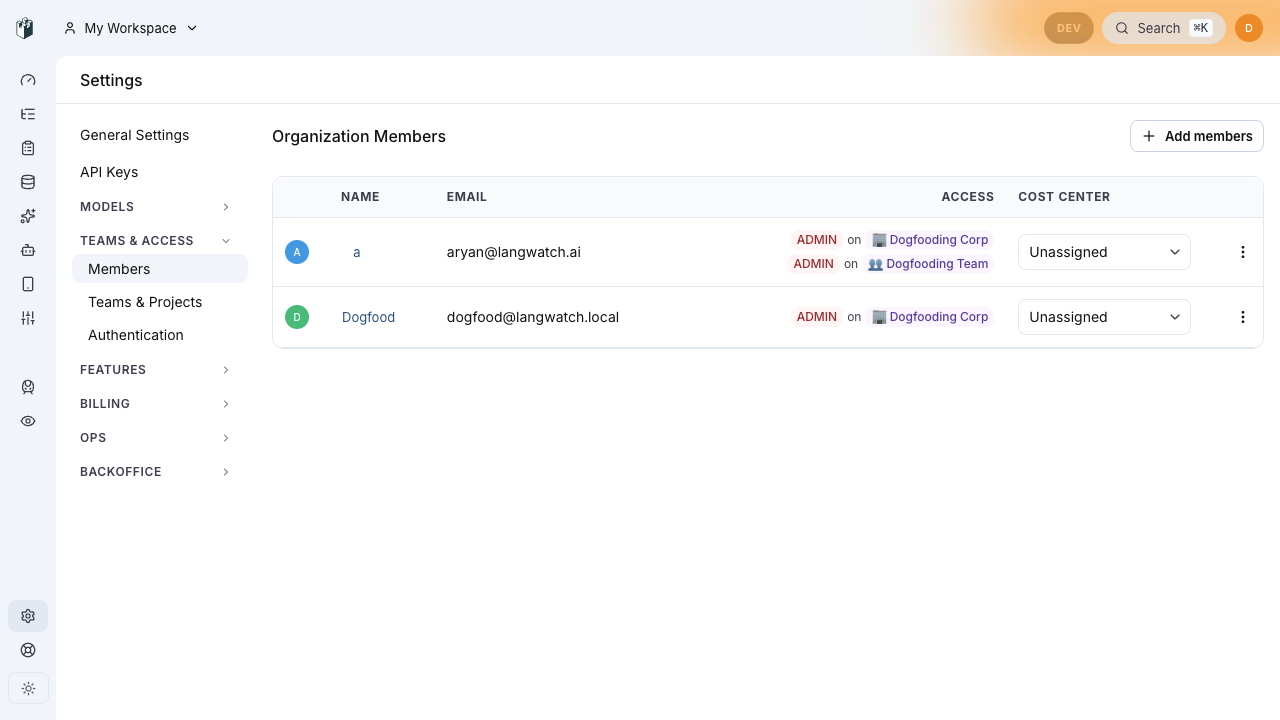
Assign cost centers to members, teams, and projects (with SCIM auto-assignment) and see spend rolled up by cost center.
-
Onboard your team straight from the CLI: members run langwatch login after install to start routing their AI tools through LangWatch.
Scopes and multi-tenancy
- Target configuration resources (model providers, default model config, virtual keys, and model costs) at the organization, team, or project level through one consistent scope model, now enforced at the database layer instead of per-service convention (ADR-021).
Security and access control
-
Every external HTTP API route (the surface used by the SDKs, the CLI, the MCP server, and the app itself) now enforces RBAC through mandatory, compile-time-checked middleware, closing the audited fail-open and cross-tenant gaps that positional checks had let through.
-
Filter API keys by scope, with the code snippets updated to match.
-
Archiving scenario runs now requires an explicit scope.
Large traces that never lose data
-
Arbitrarily large traces are handled without dropping spans: past a size threshold LangWatch skips the expensive per-span evaluation work but still stores every span, so a runaway trace can no longer amplify queue and evaluation load or cost you data.
-
Trace search batches ClickHouse reads and streams the response under memory pressure, so paginating through pages of heavy payloads no longer fails with a 500.
-
Analytics now retries ClickHouse reads on transient overload, and oversized studio invoke payloads are offloaded to S3.
Studio, gateway, and workflows
-
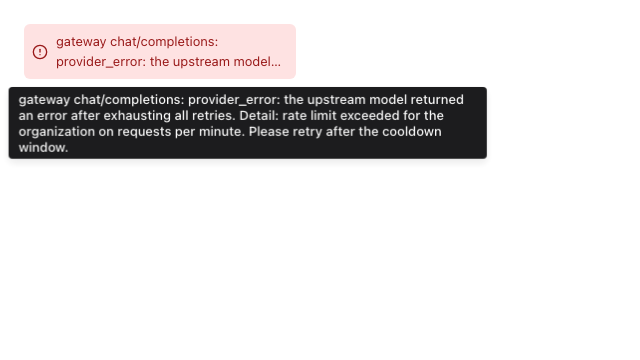
Studio generates trace ids natively and reveals the full evaluation error on hover instead of truncating it.
-
Managed-Bedrock traffic routes through your own VPC endpoint, and tool_choice plus forced tool use are now handled correctly for Bedrock and Anthropic models on the gateway.
-
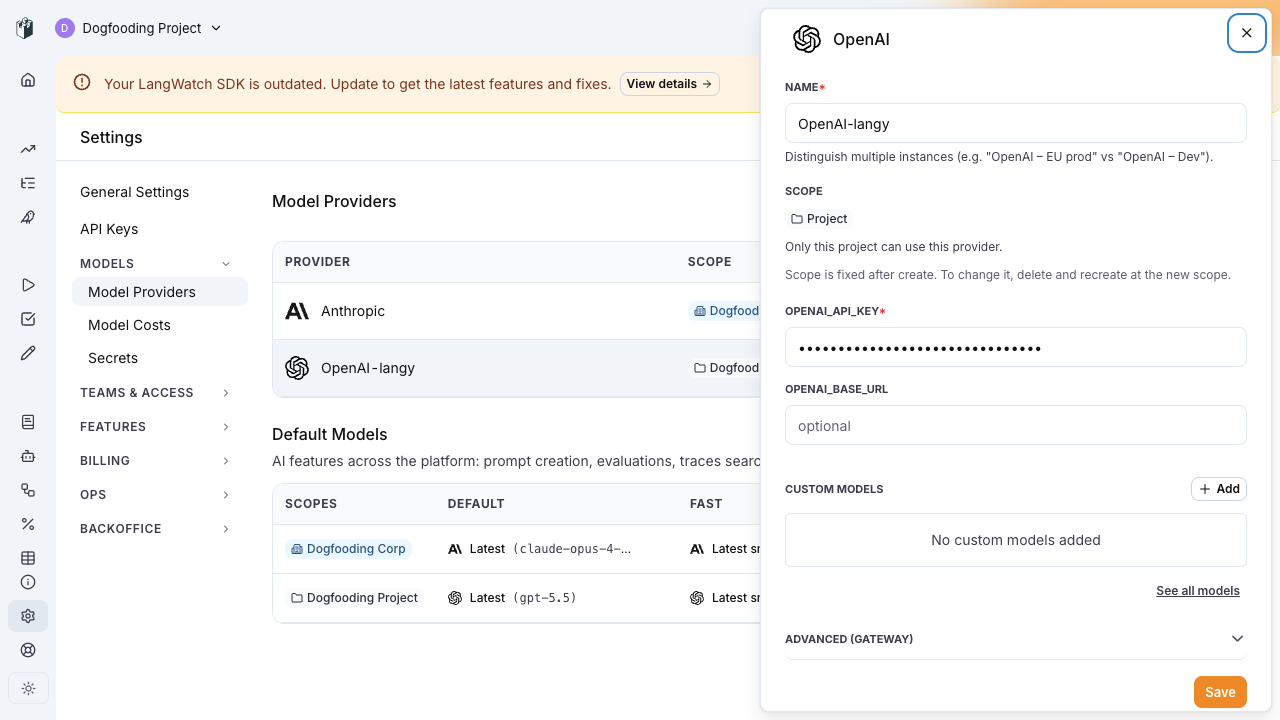
Model provider settings collapse into a single Save, with the advanced gateway fields tucked behind an accordion.
-
Trace filters surface more facet values (the discovery limit went from 10 to 50).
CLI and SDKs
-
langwatch experiment results, status, and list-runs are now slug-first and default to the latest run, so you no longer have to copy a random run id for the common case of inspecting the most recent run.
-
Run LangWatch alongside another OpenTelemetry SDK using a dedicated TracerProvider, so neither SDK sees the other's spans (Python and TypeScript SDKs).
-
The Python SDK surfaces masked server errors and logs loaded prompts once instead of on every call.
Scenario
-
Pass extra context to the judge through a new context param on JudgmentRequest for richer evaluation input.
-
The VoiceAgentAdapter default response timeout was raised from 30s to 60s.
-
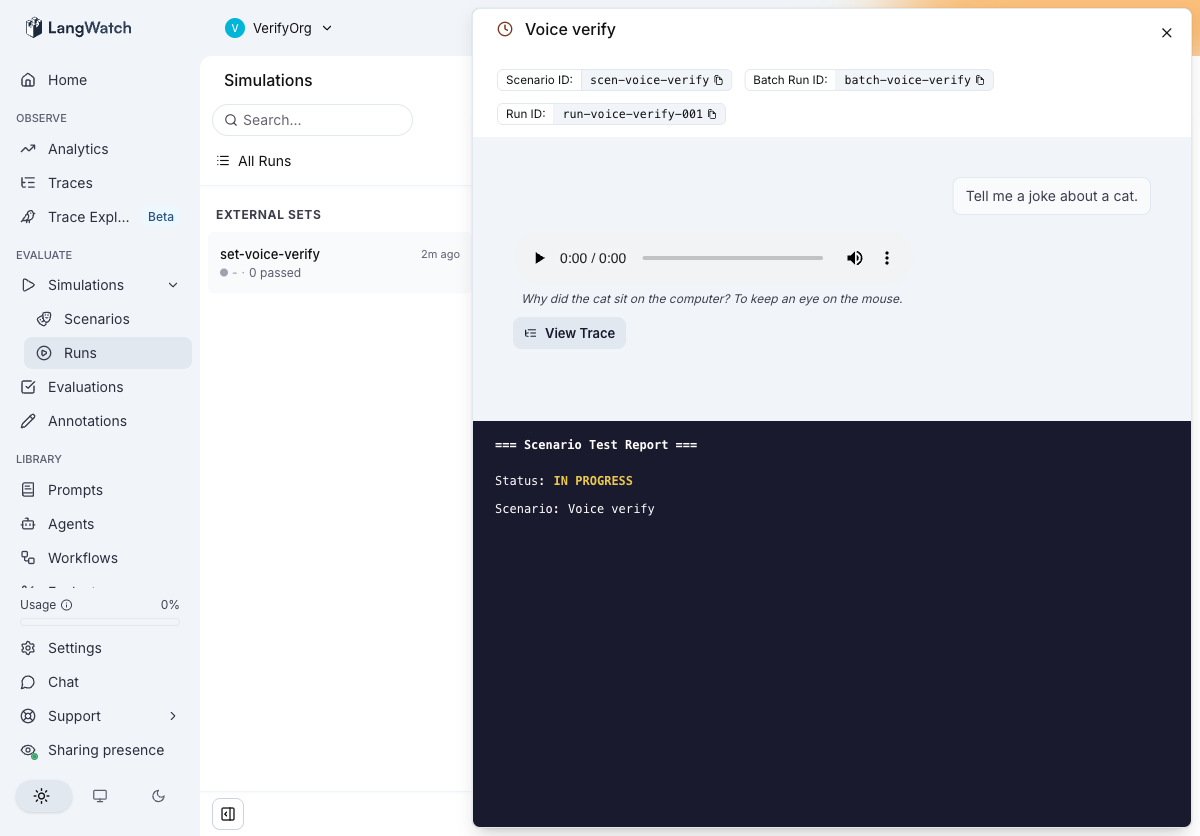
A View Trace button now appears on voice and audio messages in simulations.
Screenshots
Governance overview: spend, users, anomalies, and ingestion-source health, with spend over time and share across teams.
Cost centers: assigning members to a cost center.
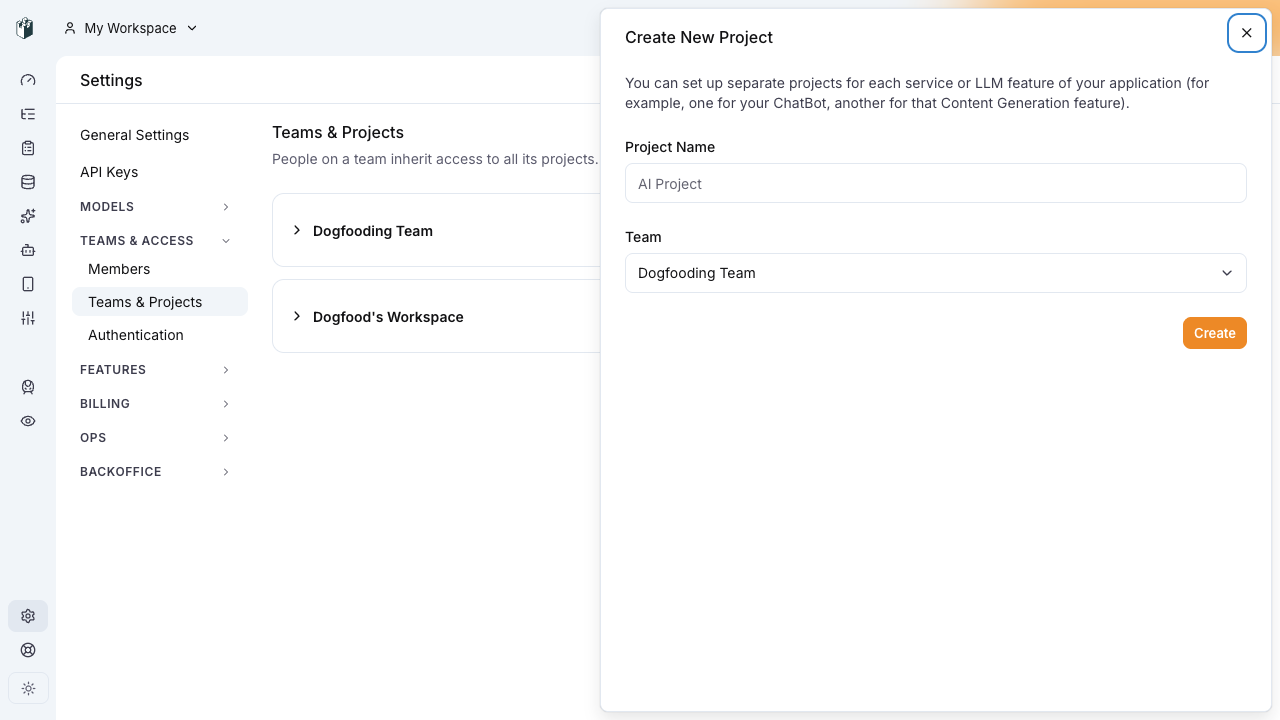
Project switcher: create a project inline, with the personal entry gated.
Model providers: advanced gateway fields behind an accordion with a single Save.
Studio: the full evaluation error revealed on hover.
Simulations: View Trace on a voice message.
Notes
-
Shipped in langwatch 3.4.1. The Governance Platform surfaces are in Preview and the AI Gateway is in Beta.
-
A boot-time white screen caused by Shiki chunking was fixed this week, so first paint is reliable again.
-
Everything here traces back to a merged PR from the week of May 25 to May 31 across langwatch/langwatch and langwatch/scenario.