
The Context Tax: When to Compact Your Coding Agent
Analysis of 2,451 agent sessions, 287,748 traced API calls, 201 manually audited steps and 873 compactions: please compact.
 Rogerio Chaves · August 2, 2026 · Article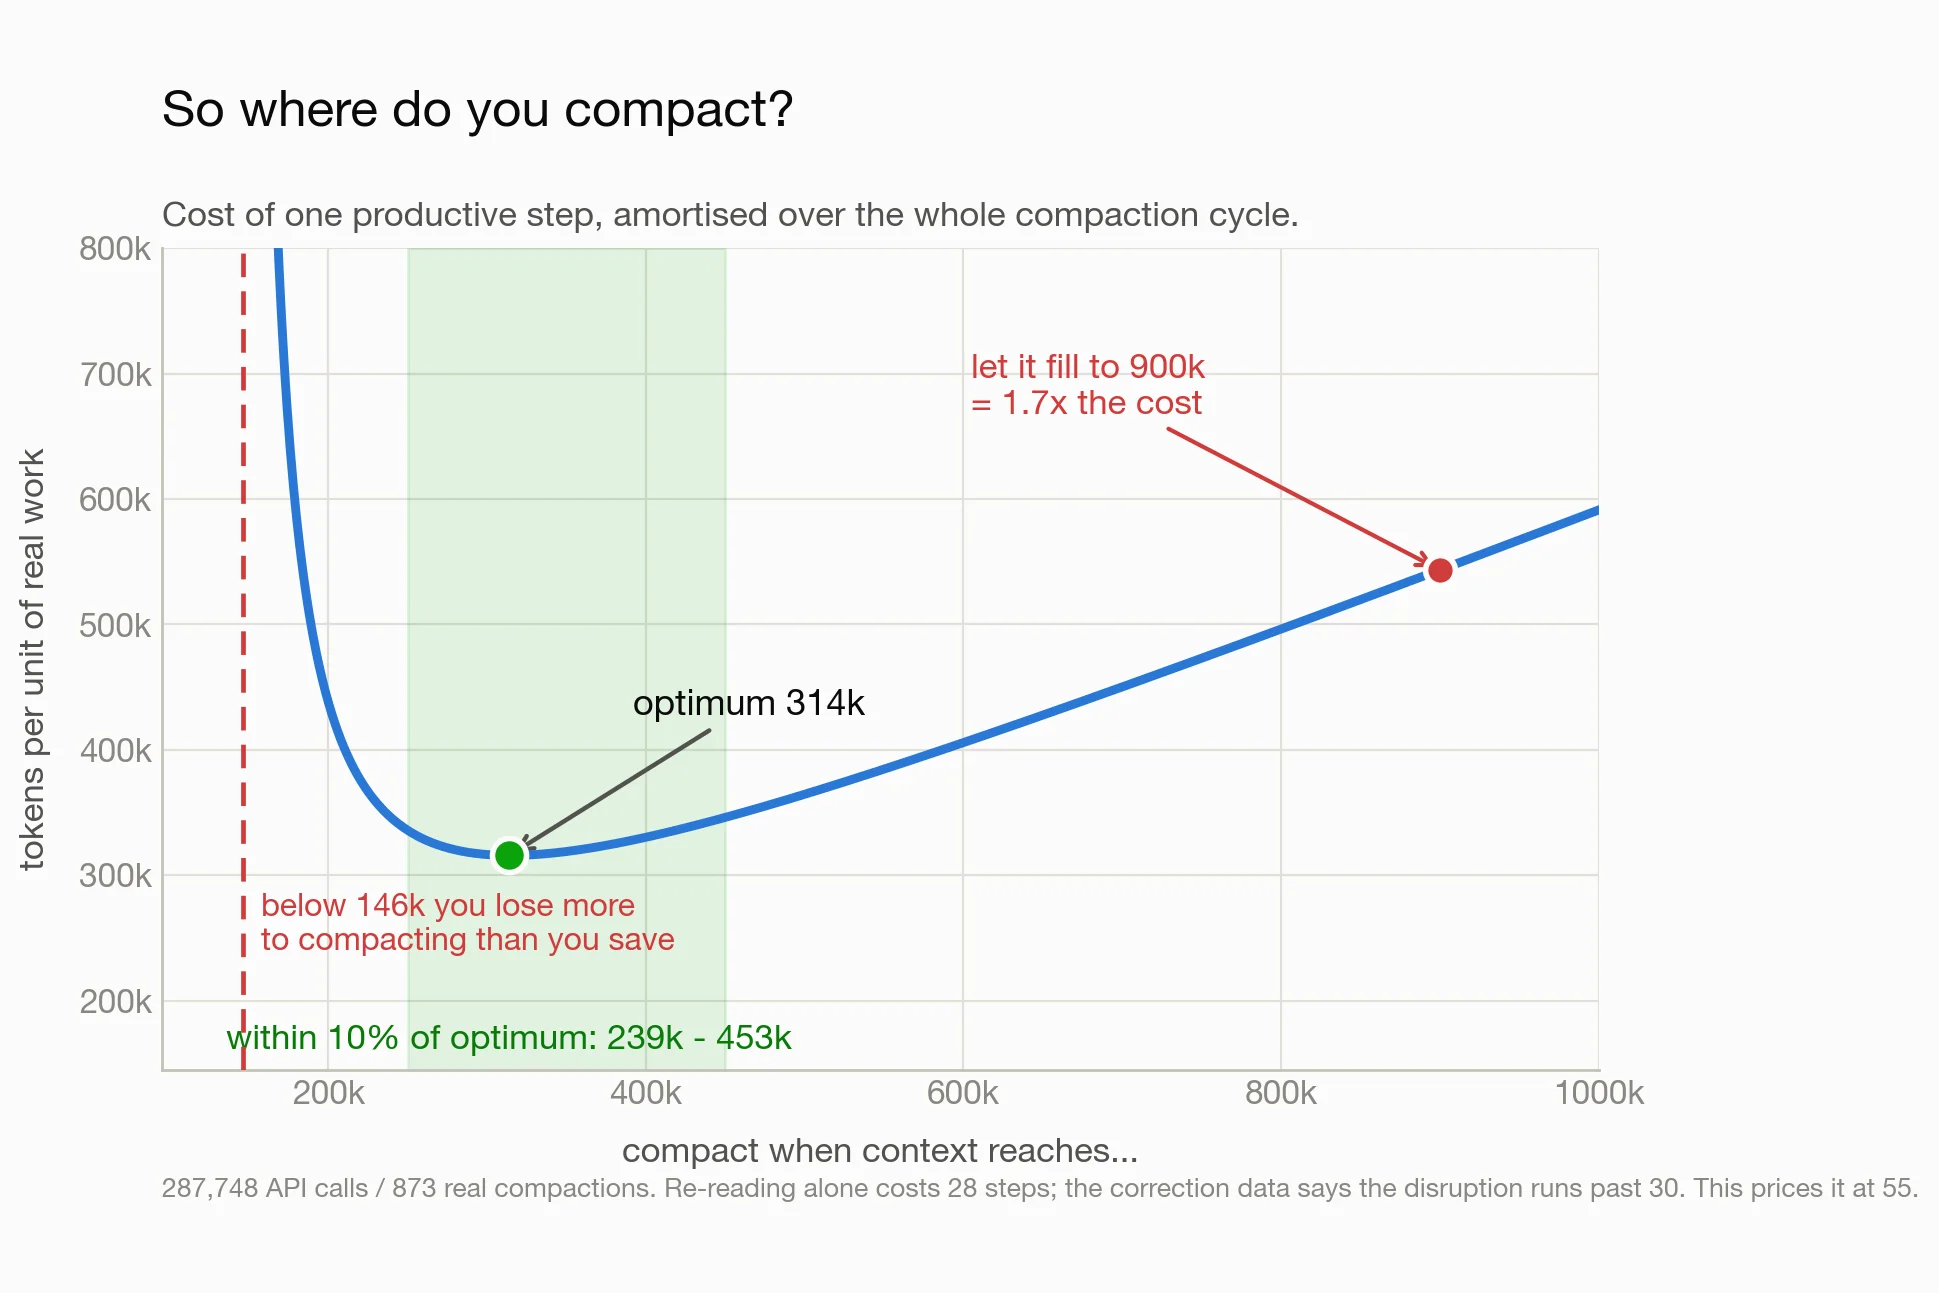
TL;DR
You should compact, and probably more often than you do. Somewhere between 250k and 450k tokens. Each doubling of context costs roughly 6x more, so be deliberate about which work earns a big window. I could find no justifiable benefit in letting an agent run anywhere near 1M.
A big context window does not cost what it looks like it costs, because when your agent does 25 tool calls on a follow-up at 500k context, that is not one cached request to the LLM at 500k tokens, but 25 x 500k, and increasing. Even though cached tokens are an order of magnitude cheaper than non-cached ones, that is still a LOT of token burn. Meanwhile the part of the window the agent actually uses barely grows at all: sixteen times the window carries about the same amount of useful context.
What token spend alone cannot show you is the quality cost of compacting: for dozens of steps after a compaction the agent makes visibly worse decisions. So we modeled that too, the long-term cost of the model making more mistakes due to compaction rather than longer raw windows, and still could not justify the trade-off on tokens.
Read the full analysis below.
Every number in this post comes from tracing my own Claude Code sessions with LangWatch Claude Code usage tracking. One
npx langwatch claudeand you can run the same analysis on your own token usage.
The day the limit died
On the last Friday of July my session limit went from fine to exhausted in minutes. I waited the 5h, resumed the work, and got tokens exhausted in minutes again. What the hell? The sessions all ended the same way:
Agent terminated early due to an API error:
You've hit your session limit · resets 11:10pm
I had a suspect: subagents.
Checked LangWatch: 2.25 billion tokens in one day, 82% of it from subagents rather than from anything I typed. Damn.
Luckily, I could now put a Claude to investigate the token spend of my other Claudes and chat with it. Every claude on my machine runs through a wrapper that injects OpenTelemetry, so each session lands as a trace with cost, cache reads and cache writes as separate token classes, and every bash command as a span. I mixed that with the raw session jsonl logs Claude Code writes locally.
Two agents spent half the day
Of the 2.25 billion tokens, 1.14 billion came from two subagents out of thirty-four. They were both forked subagents, meaning they were spawned holding a full copy of the parent coordinator's conversation. Their briefing told them to execute one directive and stop, but they never did! One lived 10.7 hours and made 1,301 API calls, the other 8.7 hours and 595.
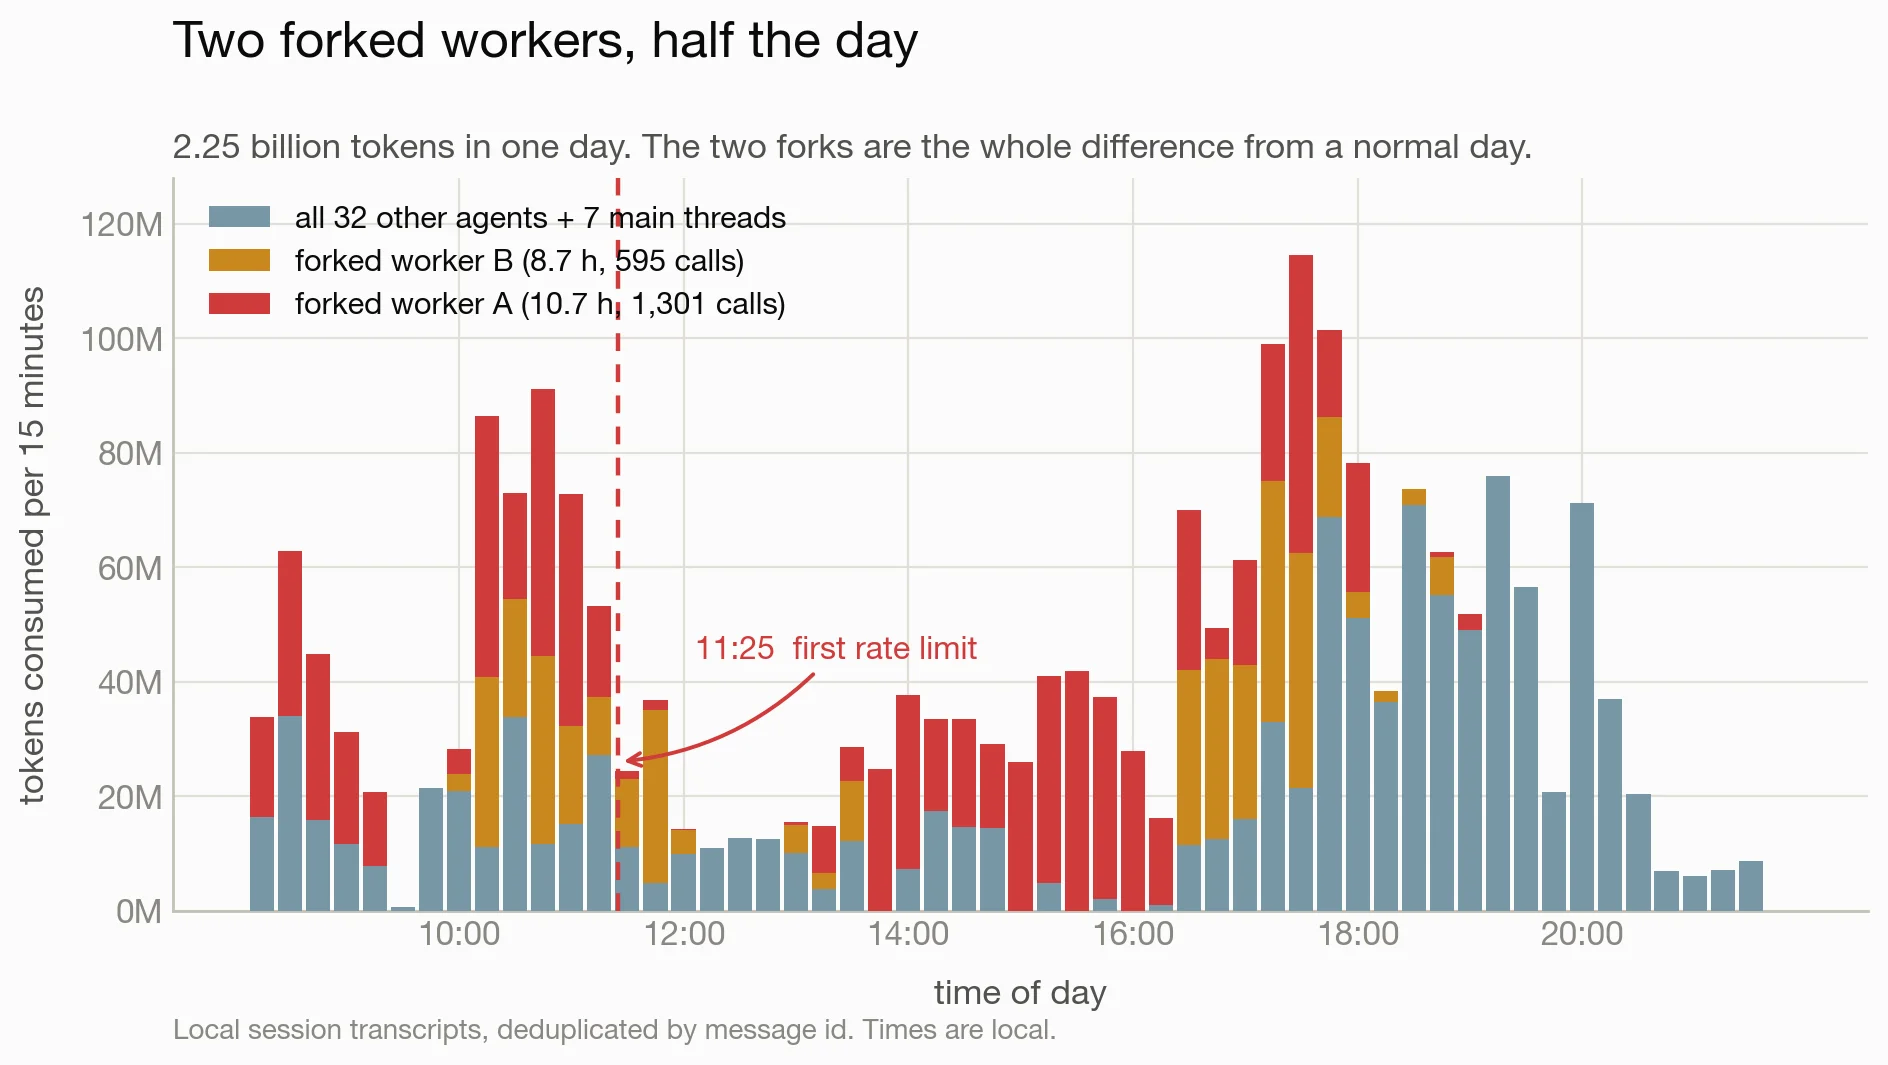
Three ordinary decisions multiplied into that. A fork starts at the parent's context size, so these two began at 523K and 304K tokens instead of the roughly 30,000 a fresh subagent gets. A long-lived worker only accumulates from there, and the first one peaked at 997,634 tokens, within 0.3% of the model's hard ceiling, and every lint, typecheck and test run is another API call that re-reads the whole window. That worker ran 1,112 bash commands. At its average context, one pnpm test cost about 568,000 tokens before the tests did anything.
None of the three is unreasonable on its own: forking preserves context that took hours to build, long-lived workers avoid re-briefing, and iterating through the shell is just how building works. But combined they turned these two into extreme outliers, paying more per step than most of my agents spend on an entire task, for hundreds of steps in a row.
The tax is a power law
So how does this scale in general? Across all 162 days of traces: by the time an agent's context first reaches size C, how many tokens has it spent getting there?
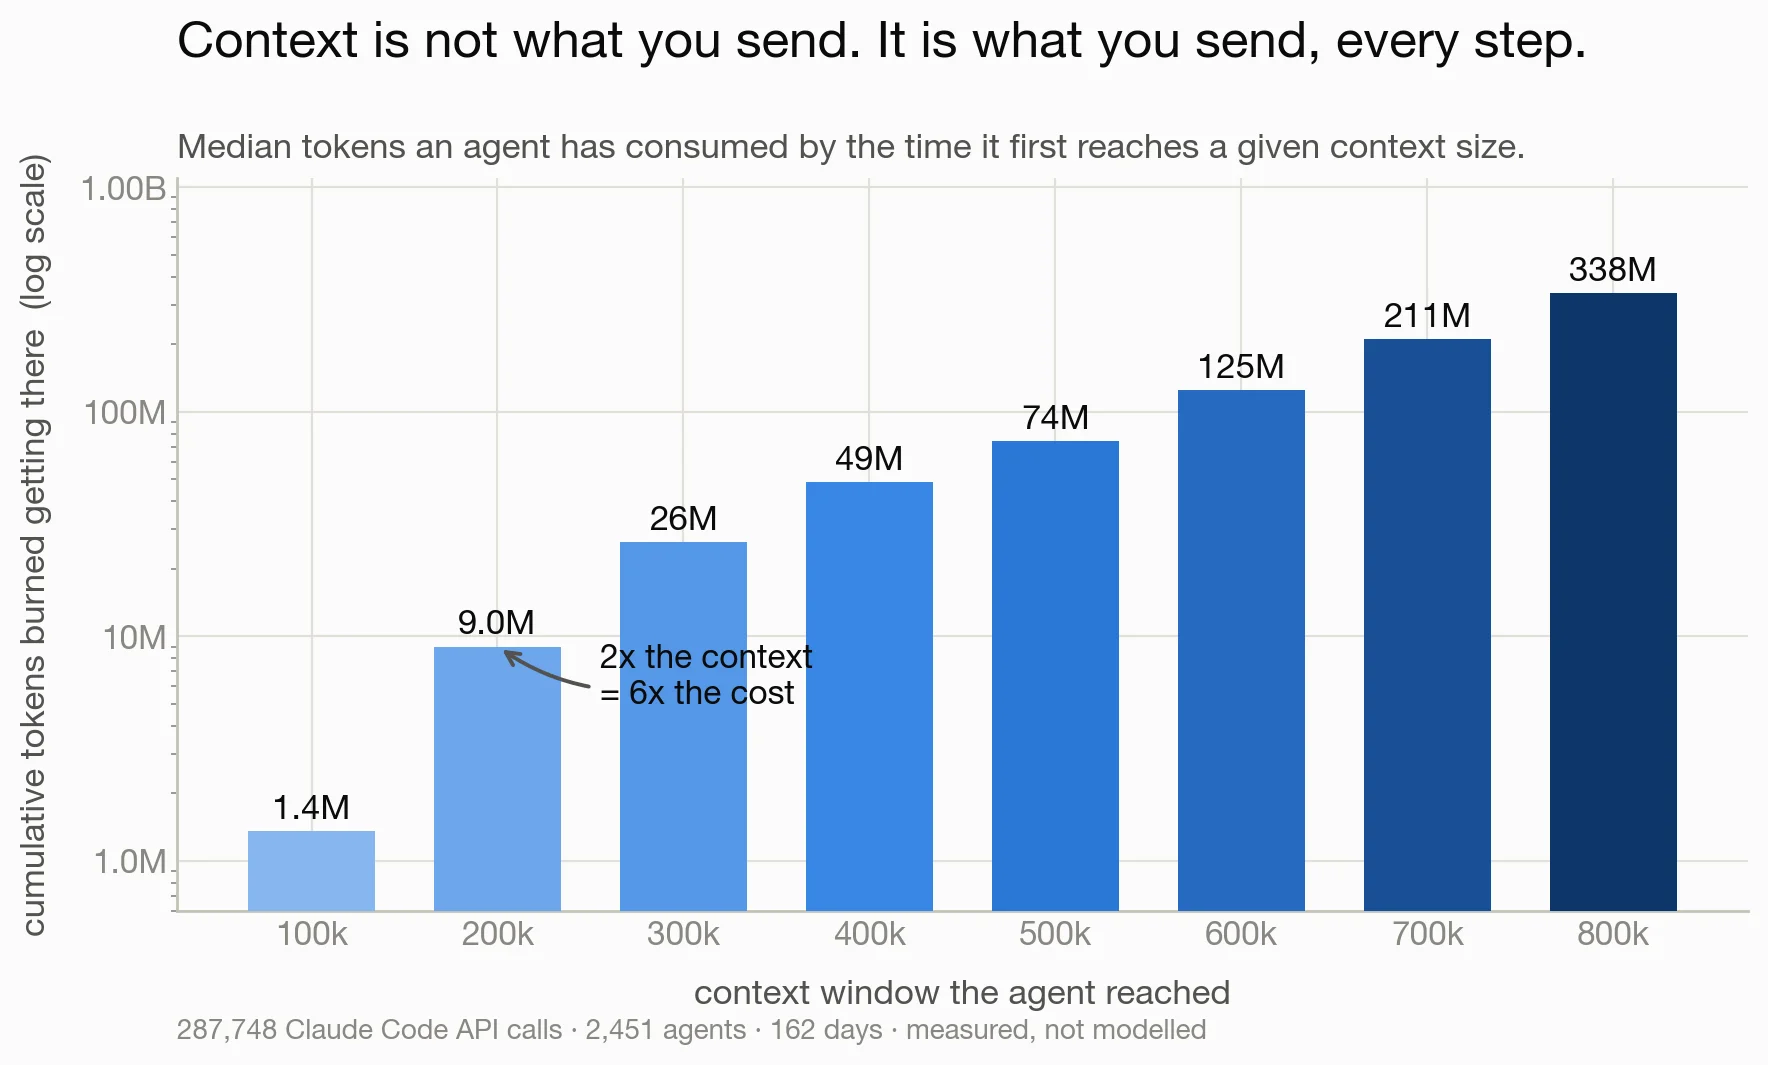
Reaching 100k of context costs a median of 1.4M tokens. Reaching 200k costs 9M. Reaching 800k costs 338M, which is 250 times the 100k figure for 8 times the window.
The fit is a power law with exponent 2.55 and an R² of 0.994, and it stays between 2.36 and 2.66 when refit on sub-ranges. In other words, every doubling of context costs about 6x more.
Why 2.5 and not plain quadratic? Quadratic is what you would get if each step added a constant amount of context: you pay more per step, and you need more steps. But the amount added per step shrinks as the window fills, from about 3,200 tokens per step below 50k to a stable 1,470 above 200k, so the last stretch of a window is accumulated in many small increments, and every one of them pays the full window price.
Caching does not save you here either. Cache reads are indeed about 10x cheaper per token, but they were also 95% of everything the blowup day consumed: a cached token is still a token you buy again on every single step. Caching lowers the price of each re-read, and the 6x-per-doubling growth stays.
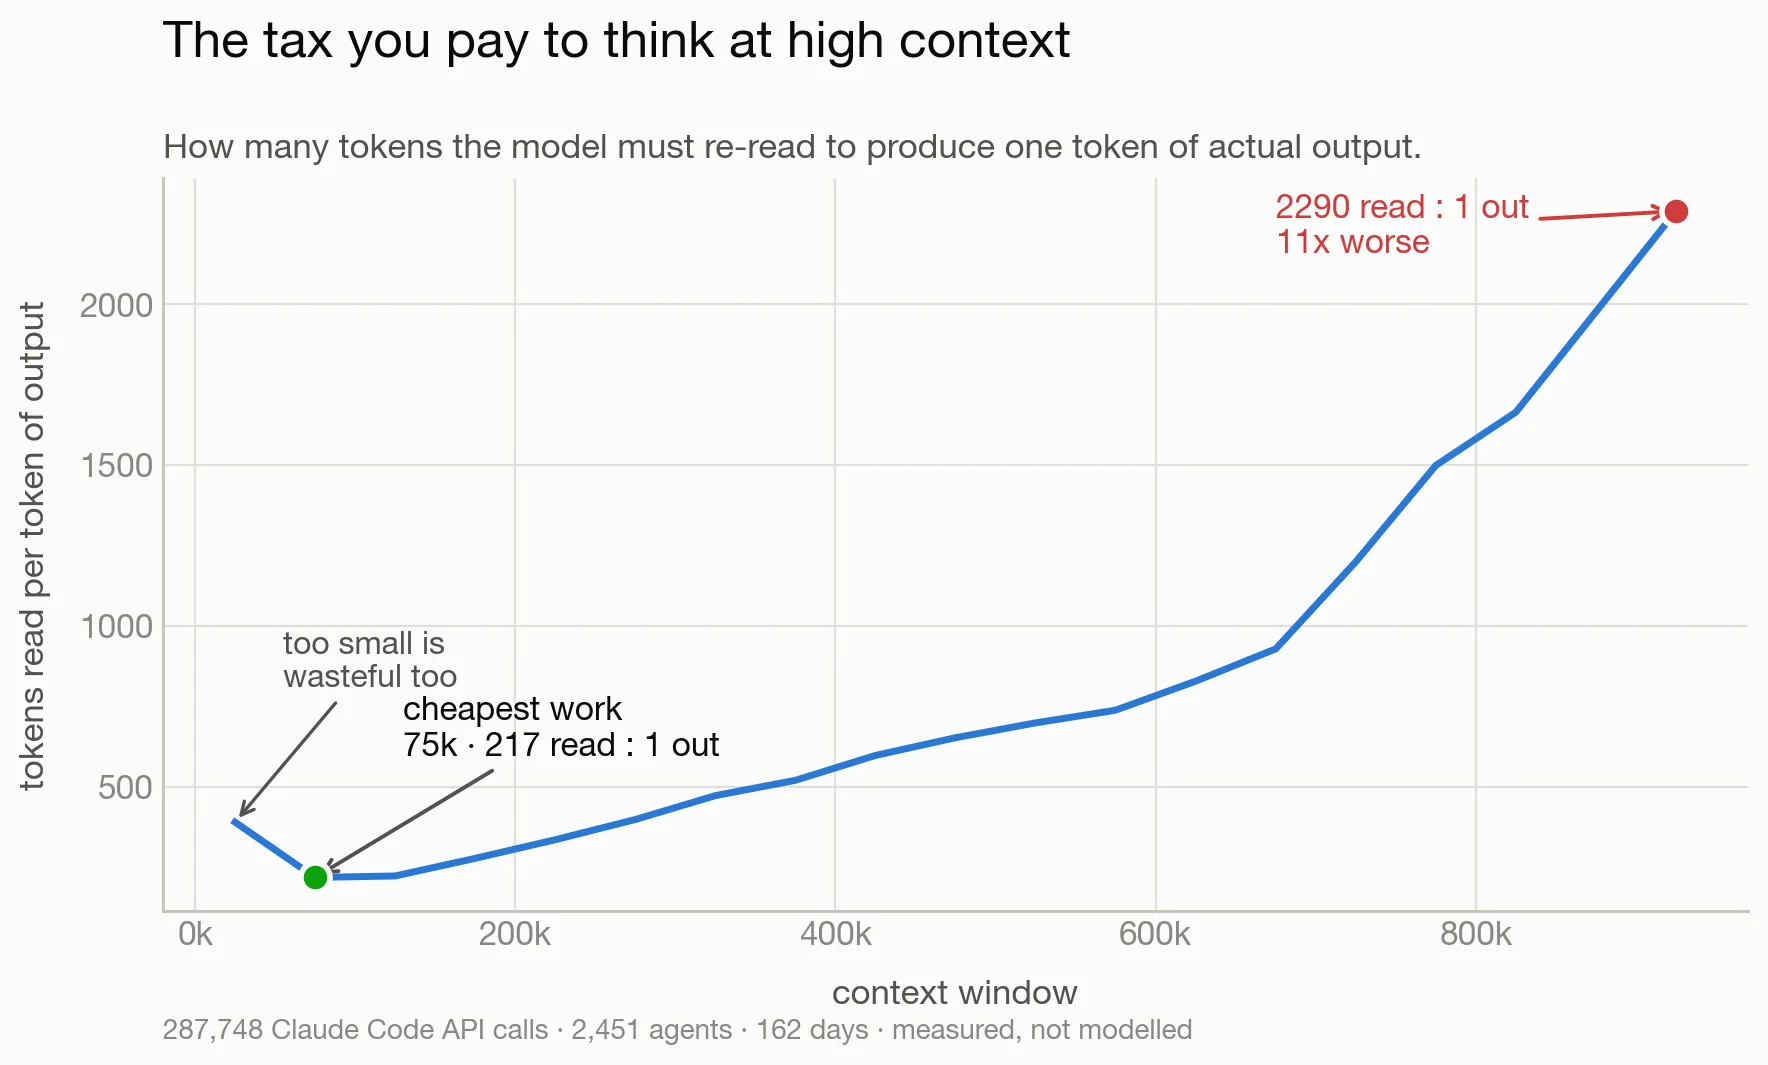
Dividing tokens read by tokens of output gives the tax rate directly, and the curve is a U rather than a slope: it bottoms out near 75k at 217 tokens read per token produced and reaches 2,290 to 1 at 900k. The left side of the U is interesting too: below about 50k the model has not accumulated enough to produce anything substantial, so tiny windows are wasteful as well. There is a floor and a ceiling, so "compact constantly" is not the answer either.
Knowing your task does not help you predict the cost either: cost is window times step count, and step count is close to unpredictable.
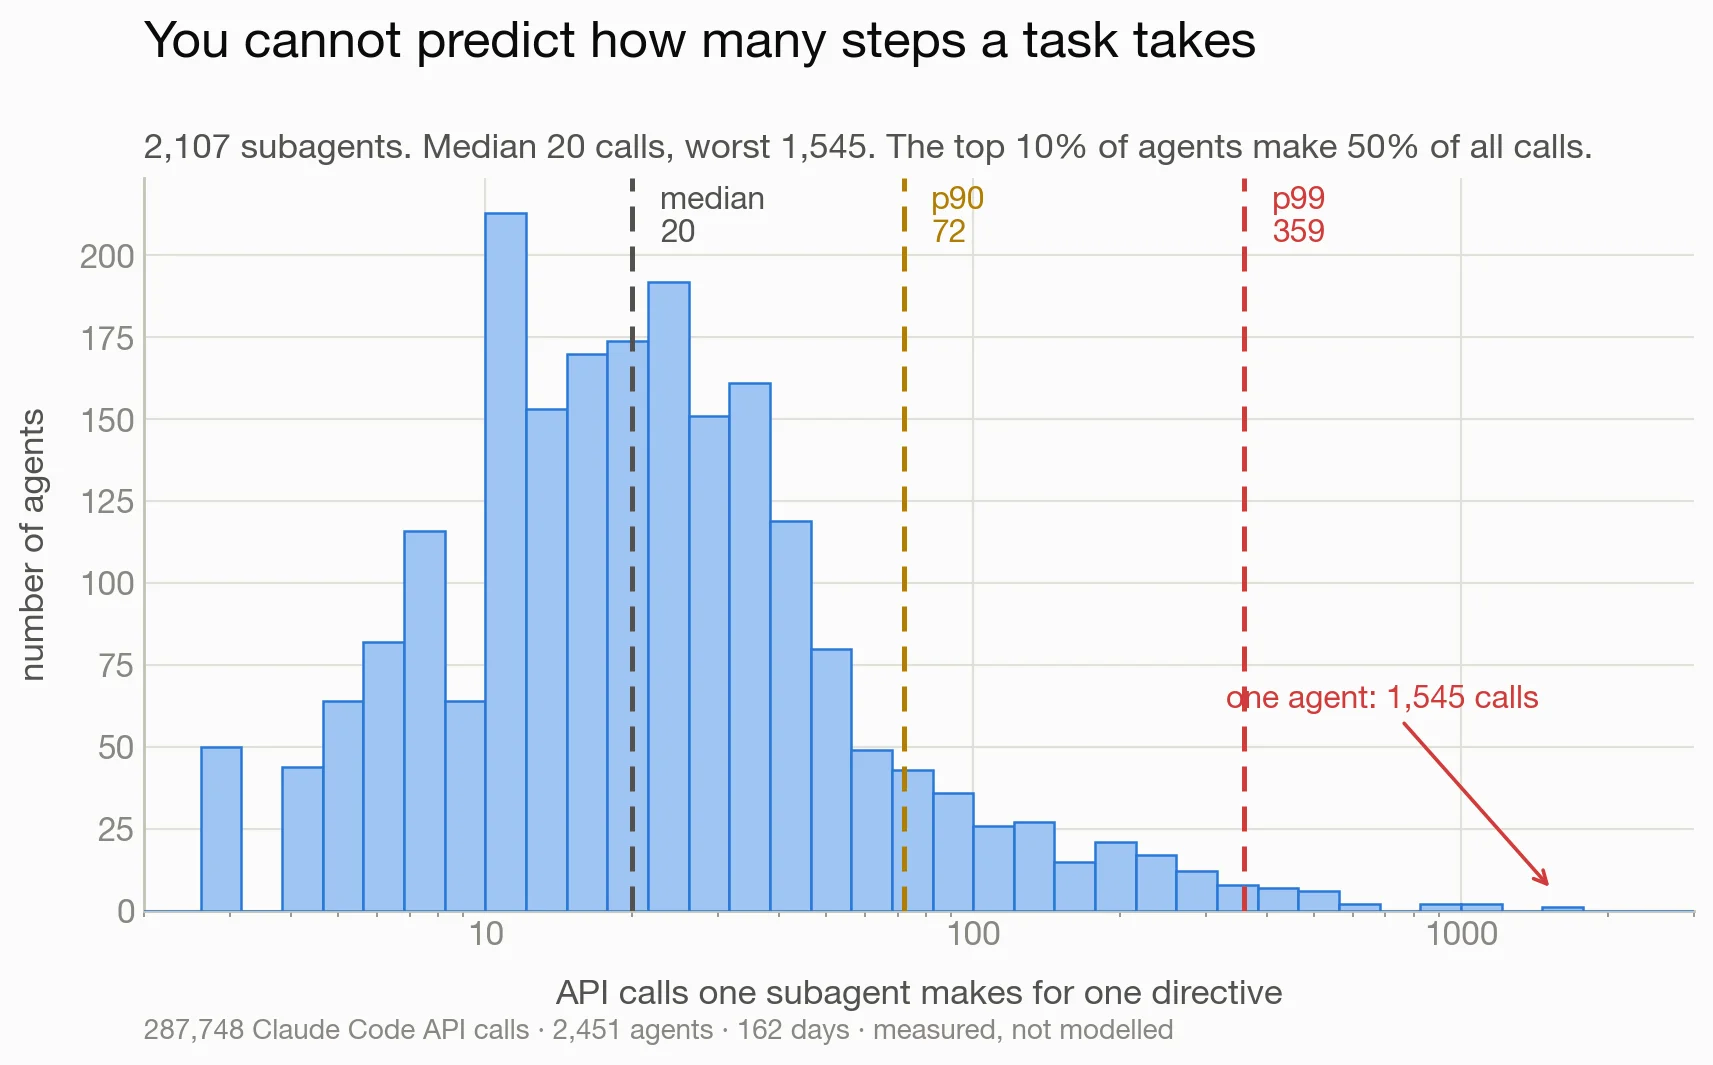
Across 2,107 subagents, each handed exactly one directive, the median takes 20 API calls. The 90th percentile takes 72, the 99th takes 359, and the worst single agent took 1,545. The top 10% of agents account for half of all calls. You cannot look at a task and know which regime you are in, and whatever context you started that agent with gets multiplied by the answer.
Where compaction pays, if cost is all you count
Compaction is the escape valve: replace the conversation with a summary and keep going. It has costs of its own, so there is a real optimization here, and I could parameterize all of it from the logs instead of guessing.
Across 873 real compaction events on my machine, a compaction lands the session at a median of 65,588 tokens, context then grows about 1,470 tokens per step, and for roughly 28 steps afterward the agent re-ingests context above its own steady-state rate, re-reading files and re-establishing state it used to just know. That last number is the measured price of losing the original context, and it is why compacting constantly fails.
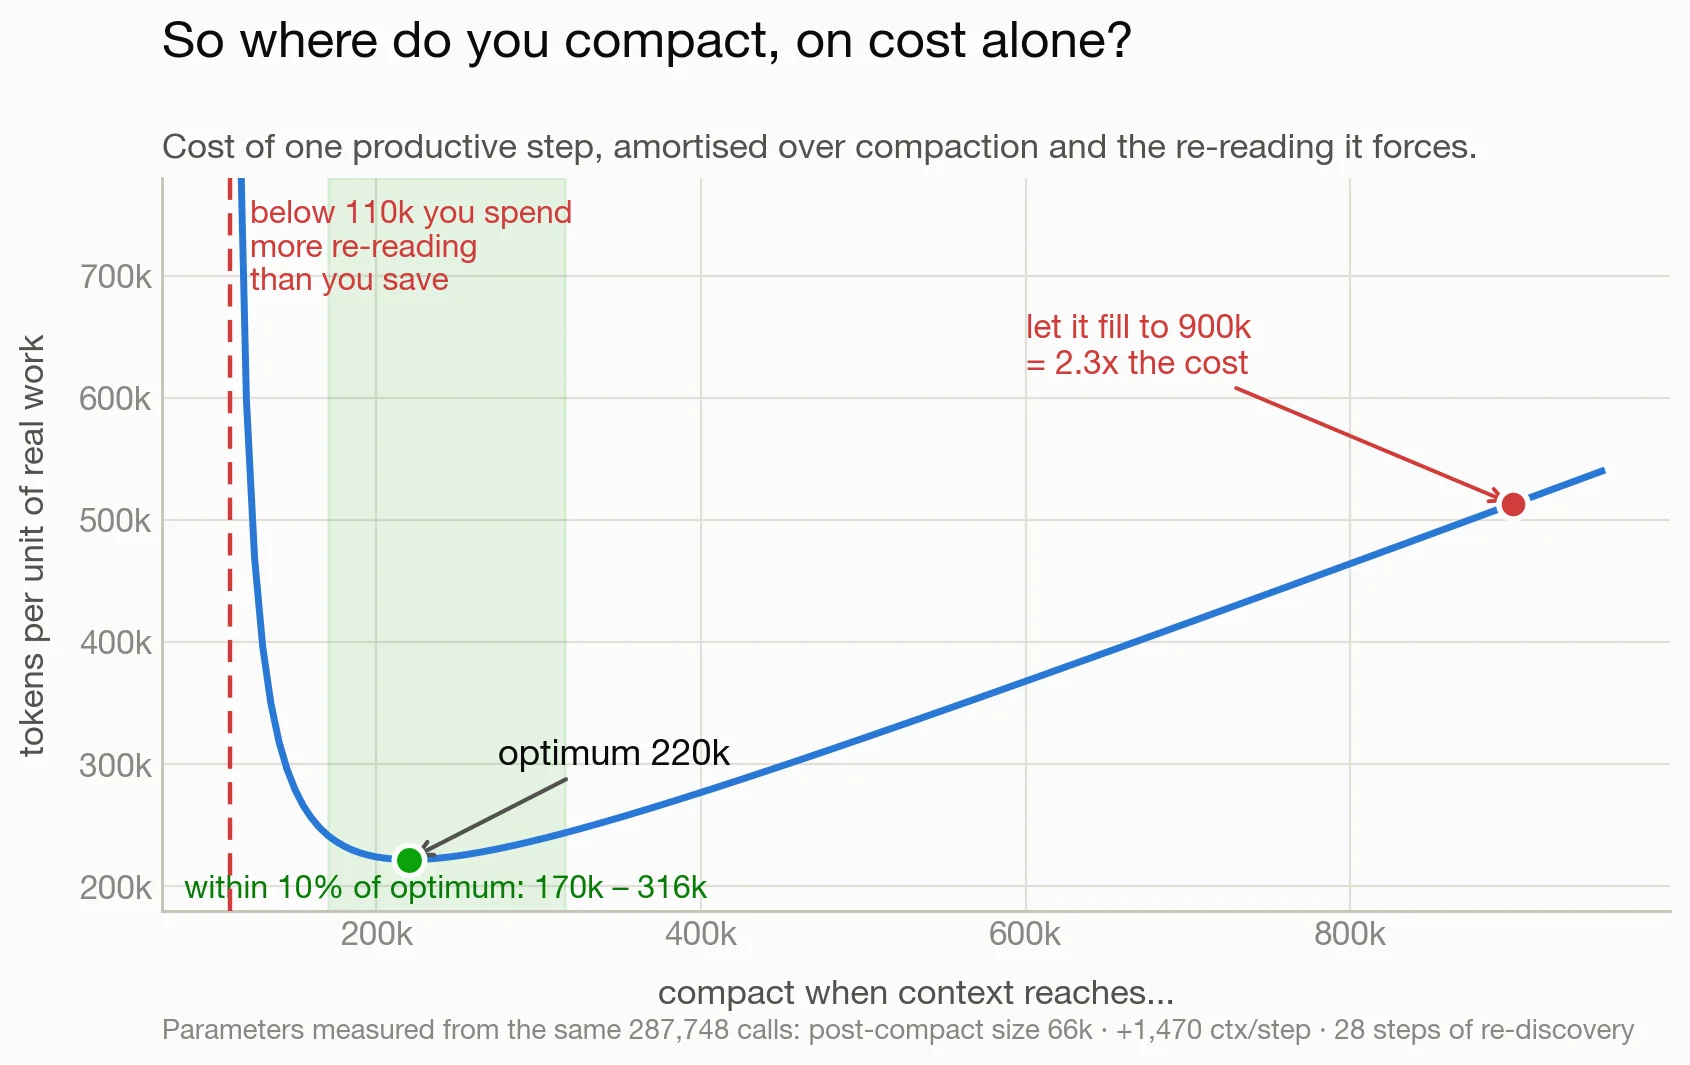
Put the cycle together and cost per unit of real work is a bathtub with a steep left wall. The minimum sits at 220,000 tokens, anything from 170k to 316k is within 10% of it, and below about 110k the whole thing stops working because rediscovery eats more steps than the cycle gives back.
The asymmetry is the useful part in practice. Compacting 90k too early costs 1.79x the optimum; compacting 96k too late costs 1.10x. When you are unsure, err late. It also says something specific about million-token models: letting the window fill before compacting is 2.3x worse than compacting at 220k, so a bigger window is more rope rather than a free upgrade.
That model runs on its own assumptions, so I wanted a check that shared none of them. For every file an agent touched, I measured how far back the previous touch of that same file was, in tokens of intervening history. No model, no judge, just file paths.
Across 10,037 repeat references the median is only 7,430 tokens back, but the tail is long. A 100k window catches 72.4% of repeat references, 200k catches 77.6%, and 500k catches 82.6%. The remaining 17% span millions of tokens and no window ever holds them, so 82.6% is the ceiling. A 200k window therefore reaches 94% of everything a window can ever reach, and coverage per unit of cost peaks at 240,000 tokens.
Two unrelated methods landing on 220k and 240k was the point where I started believing the number.
But is any of that context useful?
All of the above measures what context costs, not whether it was doing anything, and cost data cannot answer that: a token is charged whether it contributes or not.
How the audit works
So I ran an audit. I segmented the corpus into 3,036 runs, each spanning a session start or compaction boundary to the next one, and classified them into five kinds of work by tool and command signature: code understanding, research, building, QA and dogfooding, and driving a PR to merge. Then I sampled steps stratified by kind of work and by the context actually present at that step.
For each sampled run, an Opus judge got everything the agent had in front of it at that moment: the directive, any inherited summary (explicitly labelled as a lossy digest), a numbered inventory of every accumulated conversation item with its token count, and three sampled steps showing exactly what the agent had seen and what it did. Judges marked which items each step actually drew on. I computed the token fractions from their item lists rather than asking for a percentage, which keeps the number out of the judge's hands. 201 steps judged, 195 at medium or high confidence. The full judging rubric, the packet format and every measured parameter are in the companion paper.
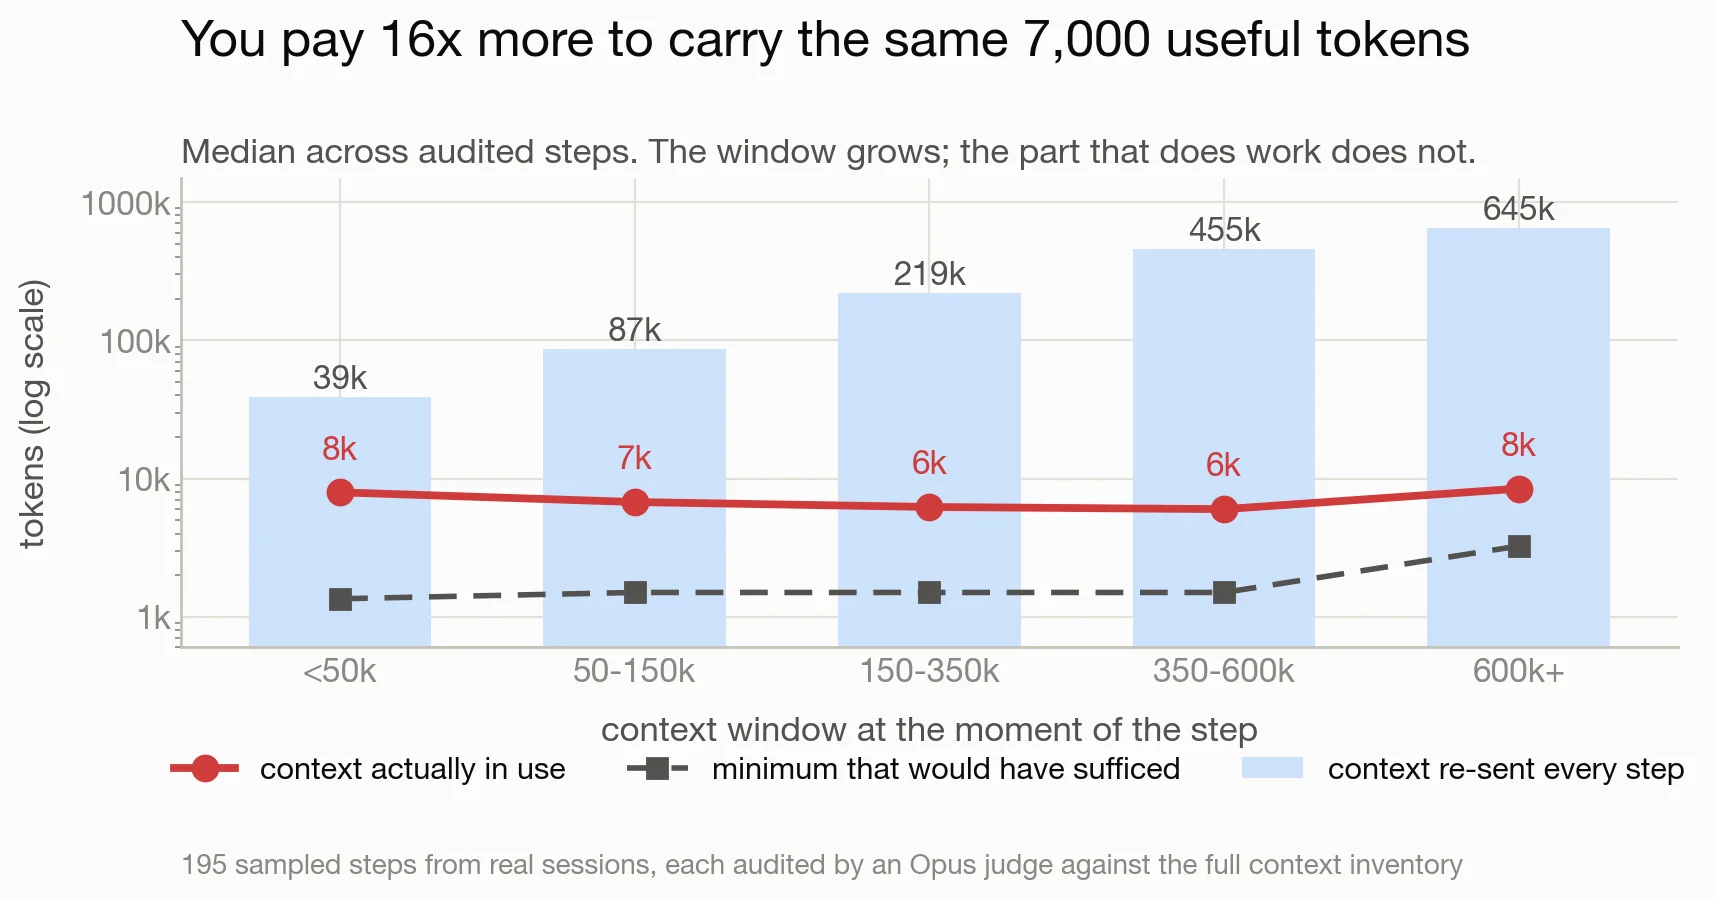
The window across bands grows 16.6x, from a median 38,886 tokens to 644,962. The part the judges marked as actually used goes from 7,949 tokens to 8,452, which is to say it does not go anywhere. Their estimate of the minimum that would have sufficed for the same step sits near 1,500 tokens in every band but the largest.
As a share, the context in use falls from 47.5% below 50k to 2.5% above 600k: the useful part stays put while the window you pay for grows around it.
The obvious objection is task mix, since different work has different memory demands.
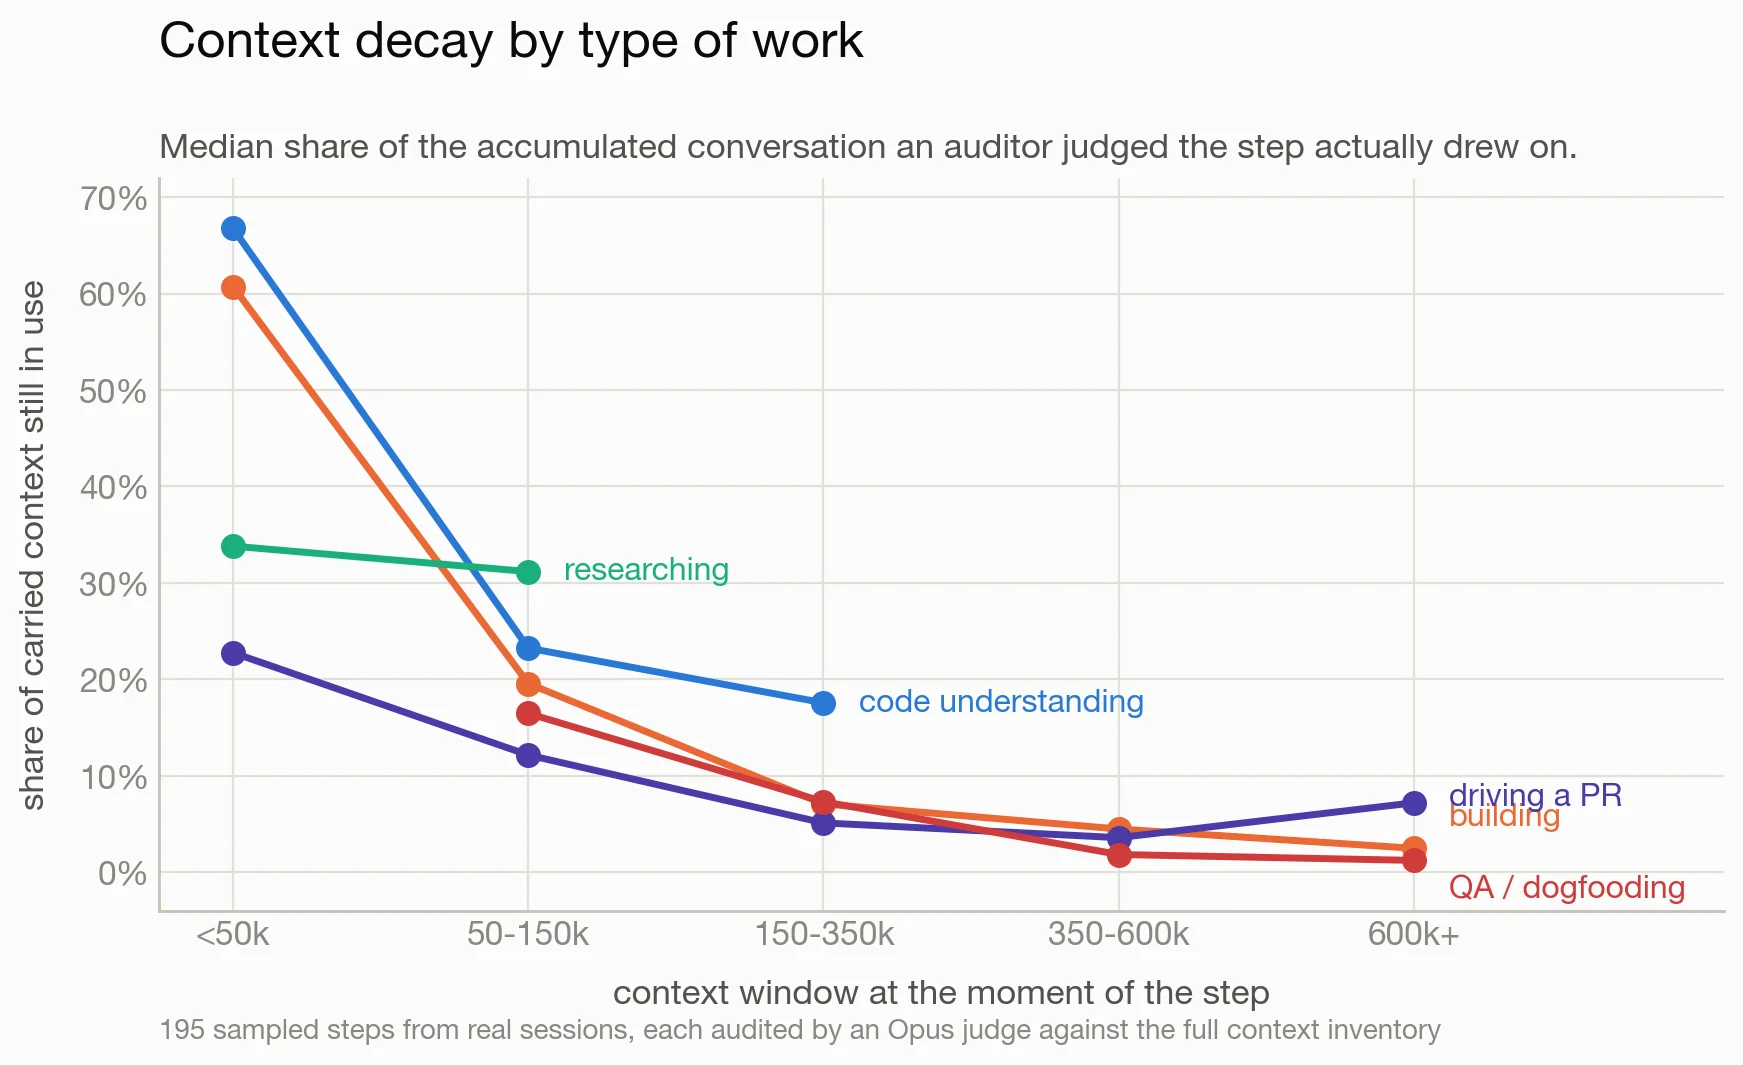
The decay shows up in all five, and the differences between them are interpretable. Code understanding holds value longest, still 18% at 150k to 350k, because reading is cumulative and each file read stays relevant to the explanation being assembled. QA and PR driving decay fastest, because each browser check or review reply is a closed loop whose result supersedes its inputs.
One caveat governs that chart. In my usage the kind of work and the window size are confounded: research and code understanding rarely run past 150k, QA and PR driving rarely start below it because they happen late in long sessions. Only building spans all five bands, so it carries the cleanest gradient and every other line should be read only across the range it covers.
Verbatim context, or would a summary do?
Heavy users tend to believe the raw original conversation is worth more than any digest of it, and that this is exactly what compaction destroys. So for every step, the judges were asked whether the verbatim form of older context was doing work a summary would not capture.
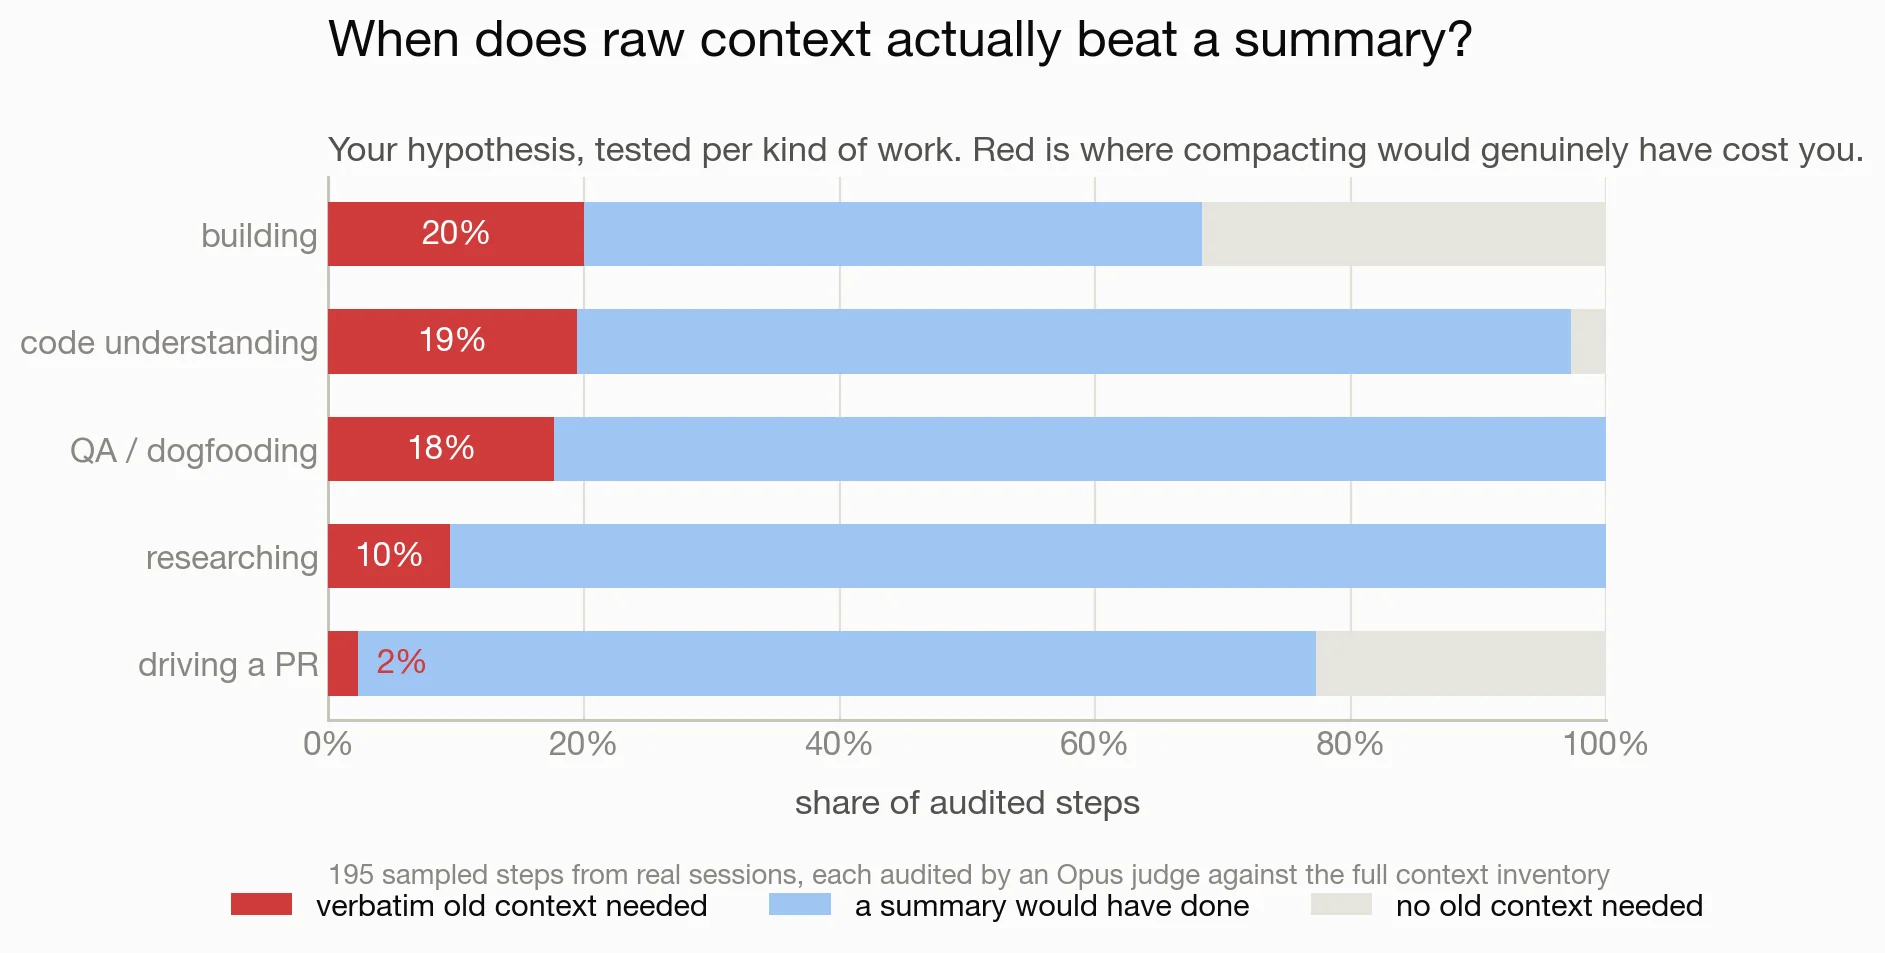
28 of 195 steps, 14%, genuinely needed the verbatim old context. The cases cluster hard around copying exact strings. An edit whose search text has to match a previously read file character for character needs the verbatim read. A restart command reusing literal connection strings from 390 items earlier needs the verbatim command. Where the dependency was a decision, a constraint or a finding rather than a literal, a summary carried it fine. In one case at 622k the single old fact the step depended on reached it through a hand-written digest, which is about as direct a counterexample as the data offers.
The spread by kind of work is large enough to act on. Building, code understanding and QA sit at 18% to 20% verbatim dependence. Driving a PR sits at 2%, with zero steps that compaction would materially degrade.
On the counterfactual put to every judge, replacing everything except the most recent 30k with a 5,000-token summary, 85% of steps came back unaffected, 15% slightly degraded, four out of 195 materially degraded, and zero impossible.
Taken alone, everything to this point says the same thing: compact early, somewhere around 150k to 220k, and lower still for PR work.
The part that complicates it
That audit has a survivorship bias, though, and it matters here: the judges only scored steps that were actually taken. A step that went subtly wrong because something had been summarised away does not show up as a bad step, it shows up as a normal step whose consequences arrive later, in review or in production. So every compaction verdict above is optimistic by an unknown amount.
My own experience also kept challenging these numbers. I compact at 500k to 600k, arrived at by trial and error long before I cared about cost, because compacting earlier made the agent visibly worse in ways I could not point at precisely. Perceived quality is hard to measure, but behaviour is not.
Measuring behaviour instead of quality
So: two proxies over 128,853 observations from 700 transcripts. The rate at which tool calls come back as errors, and the rate at which my own messages contain a correction, detected by phrase match. Both measured against how many steps had passed since the last compaction, which keeps the comparison inside a single session and broadly controls for how hard the task was.
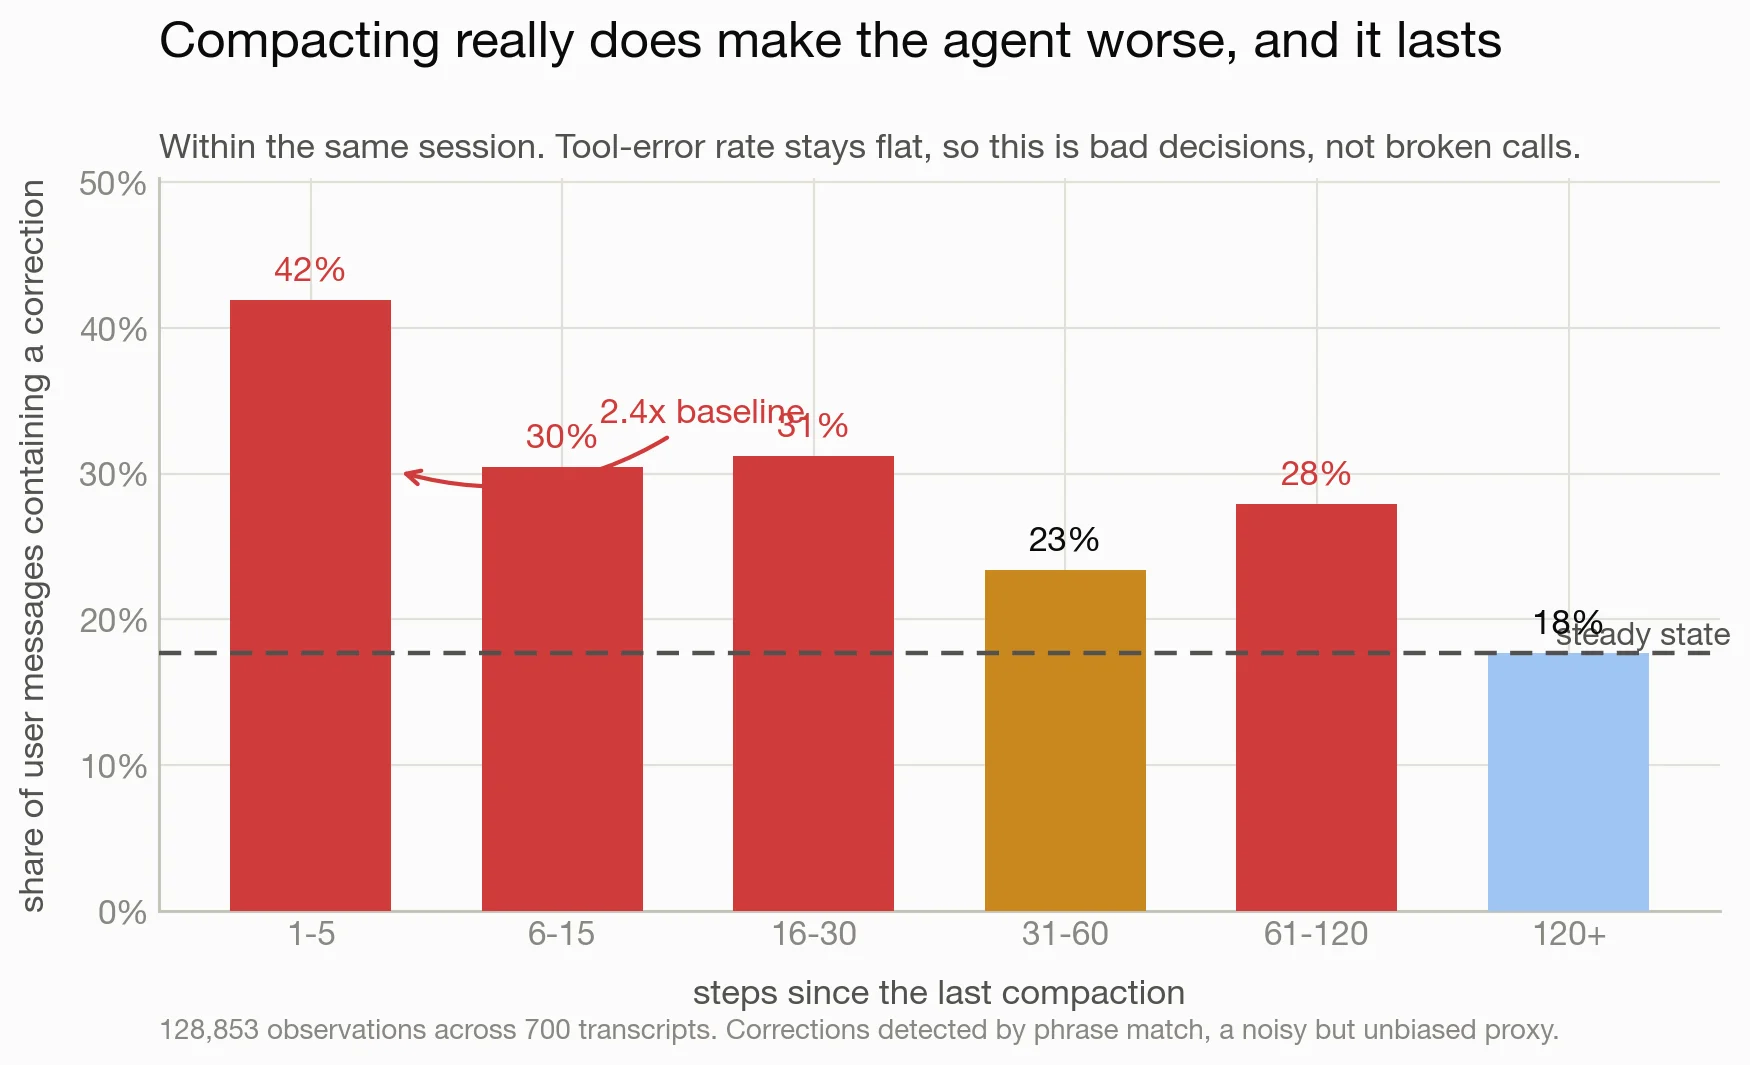
In the five steps after a compaction, 41.9% of my messages contain a correction against a steady-state baseline of 17.7%. That is 2.37x, it stays elevated for at least 30 steps, and it has not fully recovered by 120. Over the same window the tool-error rate is flat at 2.6% to 3.2%: the calls still work, the decisions behind them got worse.
Measuring the compaction event itself explains why. Across those 873 compactions, the median one takes a 574,875-token window down to a 4,382-token summary: slightly under 1% of the raw material survives, and each event costs a median 142 seconds of wall clock.
Compaction frequency then compounds it. A 30-step disruption inside a 105-step cycle, which is what a 220k threshold gives you, means about 29% of all your steps happen inside the post-compaction fog. At a 577k threshold the cycle is 348 steps and the figure drops to 9%. Compacting often does not just cost rediscovery, it keeps putting you back in the worst part of the cycle.
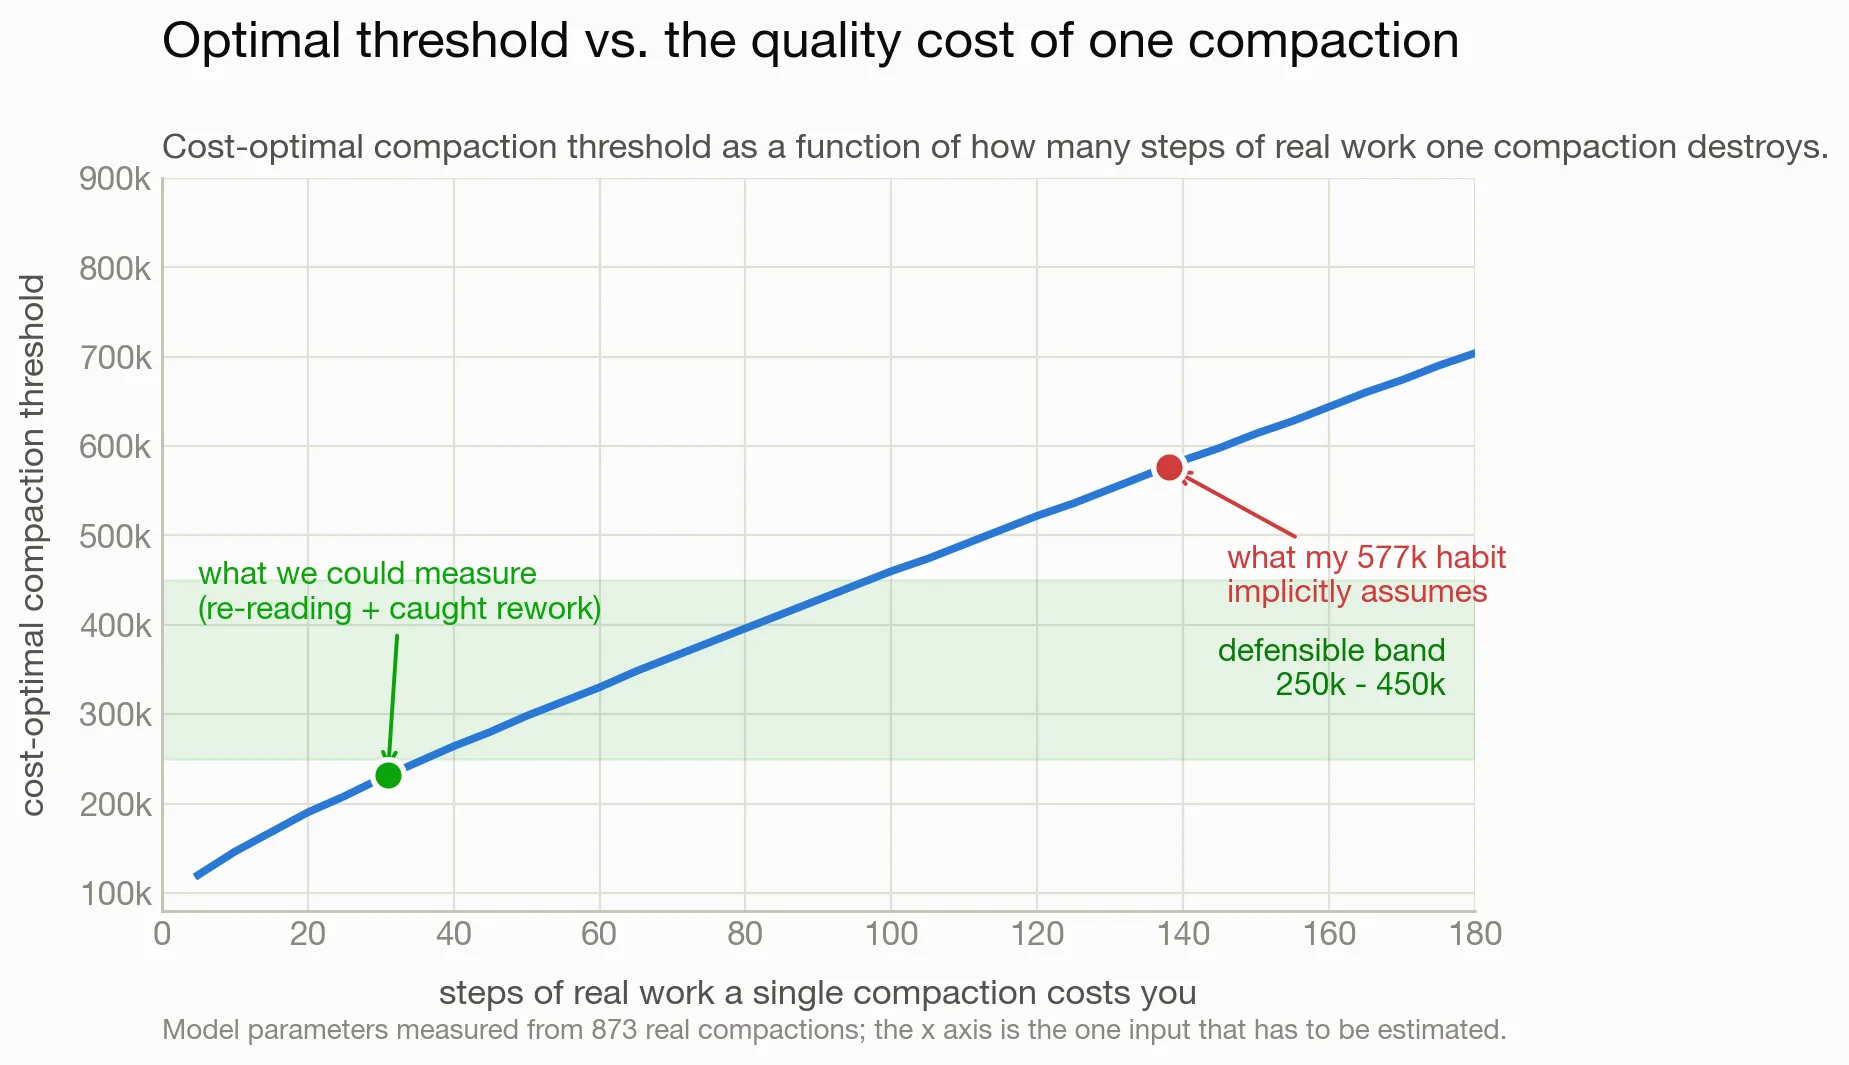
So the optimum depends almost entirely on one hard-to-measure parameter: how many steps of real work a single compaction destroys.
| If one compaction really costs | Cost-optimal threshold |
|---|---|
| 28 steps (rediscovery only, measured) | 220,000 |
| 31 steps (plus rework I visibly caught) | 232,000 |
| 65 steps | 350,000 |
| 113 steps | 500,000 |
| 138 steps | 577,000 |
| 145 steps | 600,000 |
About 31 steps is what I could measure. Running a 600k threshold, as I do, implicitly asserts that a compaction costs around 145 steps, five times the measurable figure. Given a correction rate still elevated past 100 steps, that is not an unreasonable belief. It is also not an established one, and I want to be clear about which of those I am claiming.
What the wide window actually costs
The wide window does not pay for itself on token economics either. Going from a 232k threshold to 600k costs an extra 139M tokens per 1,000 productive steps and removes 6.1 compaction disruptions, so you are paying about 23M tokens per disruption avoided. For that to break even, one escaped defect would have to cost between 46M and 229M tokens depending on how often a disruption leaks one, and a thorough debugging session costs a few million.
If you want to defend the wide window, defend it on what a production defect really costs: engineer hours, customer trust, the weeks between shipping and noticing. None of that shows in this dataset, so the most this analysis can give you is the exchange rate.
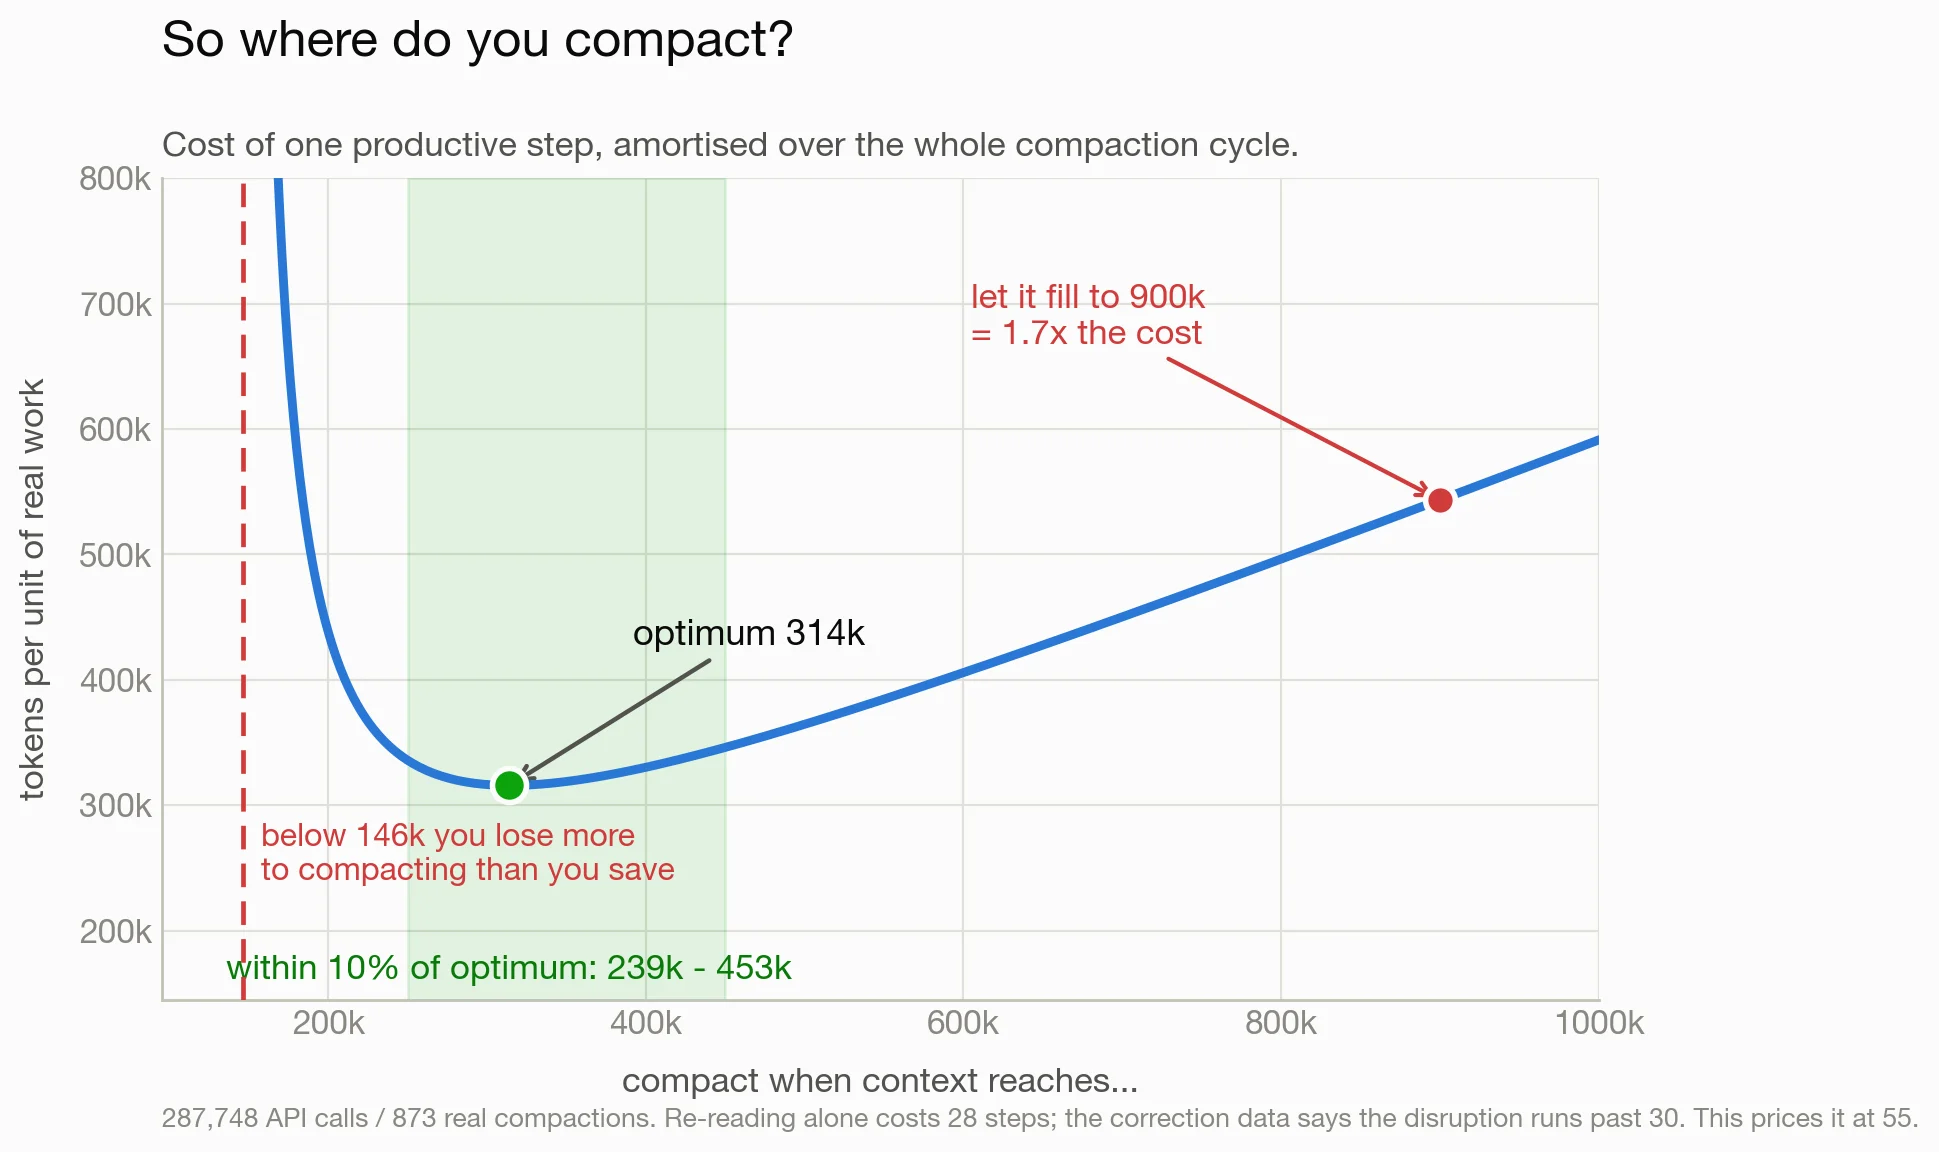
So I re-ran the same model, this time charging a compaction 55 steps of lost work instead of 28, since the correction data says the damage runs well past the re-reading. The cheapest threshold moves from 220k to 314k, and anything between 239k and 453k lands within 10% of it. That band is where the recommendation below comes from, and the model produced it rather than me.
The floor at 146k is the more interesting number though. A compaction drops you to about 66k, and context grows by roughly 1,470 tokens a step, so setting the threshold at 146k buys you 55 steps before the next compaction is due. If each compaction costs you 55 steps of degraded work, you spend the whole cycle recovering from the one that started it and never get a clean step out of it. Compacting more often than that buys nothing at all.
Where it lands
Three of the four measurements point to the same place: 220k from the cost model, 240k from coverage per unit of cost, and 120k to 190k from the audit. The fourth, the post-compaction correction spike, pushes the other way. Reconciling them gives a range instead of a number.
| Kind of work | Suggested threshold | Why |
|---|---|---|
| Driving a PR | 200k to 250k | 2% verbatim dependence, nothing materially degraded |
| Research | 250k to 300k | self-contained, nothing materially degraded |
| QA and dogfooding | 250k to 350k | fast decay, but 6% materially degraded |
| Building | 300k to 450k | highest verbatim dependence, exact-string edits |
| Code understanding | 300k to 450k | slowest decay, value stays cumulative |
Below about 200k the post-compaction fog starts eating your working time. Above about 600k you are paying a large premium for a benefit I could not find in any of these measurements.
If you want the method rather than the argument, the whole study is written up formally in Finding the Optimal Context Window for Coding Agents, with the cost model, the sensitivity analysis and the parameter tables.
There is a bigger lever than the threshold, though. The harm concentrates at the moment of the cut, and only 0.8% of the window survives it today. Keeping a 30k to 60k verbatim tail instead of a 4,382-token digest attacks the degraded window directly: under the same model, a 350k threshold with a 60k preserved tail costs 25% less per unit of work than a 600k threshold with a digest, and it makes each disruption shallower instead of only less frequent.
And the biggest variable of all is where an agent starts. A fresh subagent begins near 30k. One forked from a loaded parent begins wherever the parent was: the two that opened this post began at 523K and 304K and paid the power-law toll from a running start.
Caveats
All of this is my own usage: mostly agentic coding, mostly on the LangWatch codebase. Your constants will differ. I would expect the shapes (the power law, the flat useful-context line, the post-compaction spike) to travel better than the exact numbers, but I have only verified them here.
Kind of work and window size are confounded in my data, so the per-task curves only mean something across the range each one covers.
The utility audit carries the survivorship bias described above: it scores steps that happened, and cannot see steps that went wrong later. The correction-rate measurement exists to cover exactly that hole.
The correction measurement is observational, not an experiment: sometimes I compact because things are already going badly, which by itself would inflate the post-compaction spike. Elevation persisting past 100 steps is harder to explain that way, but a harness that compacts on a fixed token trigger would settle it. If you run one, I want to see your numbers.
Method
All of it comes from local session transcripts over 162 days plus gateway traces for the incident reconstruction. Usage records are deduplicated by message id (Claude Code repeats the same usage object on every content-block line, which inflates naive sums by 1.7x). Context per call is cache reads plus cache writes plus fresh input.
The cumulative cost curve takes, per agent, the running total at the first call reaching each 25k band, then the median across agents. Compaction events come from explicit boundary records, n=873, which also carry pre-compaction context, trigger type and duration. Rediscovery is excess context ingested in the 25 steps after a compaction relative to that agent's own median step growth, in step-equivalents. Reference distance is measured between successive touches of the same file path, reset at boundaries. The quality proxies run over 700 transcripts, corrections detected by phrase match in user messages that are not tool results.
Put this into production with LangWatch.
Trace your agents, run evaluations, and turn failures into repeatable tests.