
LangWatch Research
Finding the Optimal Context Window for Coding Agents: A Case Study
Rogerio Chaves
August 2, 2026 · 287,748 API calls · 2,451 agents · 162 days · 873 compactions · 201 audited steps
Abstract
Coding agents re-send their entire accumulated context on every step, so practitioners must decide when to discard that history and replace it with a summary, an operation called compaction. The decision is currently made by intuition, and the intuitions in circulation disagree sharply: one camp compacts aggressively to control cost, another runs windows near the model ceiling on the belief that summarisation degrades agent quality. We instrument a single practitioner's full agent fleet over 162 consecutive days and measure both sides of the trade. The cumulative cost of reaching a context of size C grows as approximately C^2.5 (exponent 2.55, R² = 0.994), so each doubling of window size costs roughly six times more, and prompt caching alters the constant rather than the exponent. An LLM-judge audit of 201 agent steps finds that the portion of context a step actually draws on, which we term the active context, is invariant at 6,000 to 8,500 tokens across a 16.6-fold range of window sizes, falling from 47.5% to 2.5% as a share. Two independent optimisations place the cost-optimal threshold at 220,000 and 240,000 tokens. Counter to all three, compaction carries a measurable behavioural cost: operator corrections rise to 41.9% in the five steps after a compaction against a 17.7% within-session baseline, and remain elevated beyond 100 steps. Reconciling the four yields an operating range of 250,000 to 450,000 tokens differentiated by task type rather than a single threshold. On token economics alone the wide-window position does not break even, requiring an escaped-defect cost one to two orders of magnitude above any we directly observed. We conclude that threshold tuning matters less than an unexploited lever: the median compaction preserves 0.8% of the window it replaces, and enlarging that preserved segment dominates widening the window on both cost and measured disruption.
A shorter, narrative version of this study is on the blog: The Context Tax: When to Compact Your Coding Agent.
1. Introduction
An agentic coding session is a loop. The model emits a tool call, the harness executes it, the result is appended to the conversation, and the whole conversation is sent again. Context therefore does not behave like a fixed resource that is either sufficient or insufficient. It behaves like a recurring charge whose rate rises monotonically over the life of the session.
This changes the shape of the design question. Given a model with a one-million-token window, the practitioner question is not "will my task fit" but "how much history should I be re-purchasing on every step, and when should I stop." The available answer today is a compaction threshold: a token count at which the harness replaces the accumulated conversation with a generated summary and continues.
Two positions dominate practice, and they are not reconcilable by argument alone.
The cost-control position holds that most accumulated context is inert, that re-sending it is waste, and that compaction should happen early and often. The fidelity position holds that summarisation is lossy in ways that are invisible at the moment of loss, that agents given digests instead of originals make subtly worse decisions, and that the correct response to a larger window is to use it. Practitioners in the second camp routinely run thresholds at 500,000 tokens and above, arrived at by trial and error against perceived agent quality rather than by measurement.
Both positions make empirical claims. Neither has been measured against production telemetry, largely because the necessary data is awkward to obtain: it requires per-call token accounting across a long horizon, a record of compaction events with their pre-compaction state, and some way of assessing whether context that was sent was context that mattered.
This study assembles those three. Our contributions are:
- A cost model of context accumulation fitted to 287,748 real API calls, establishing the scaling exponent and showing that caching does not change it (Section 4).
- Two independent optimisations of the compaction cycle, one from the cost model and one from a purely mechanical measure of how far back agents reference prior work, which converge (Section 5).
- A judged utility audit of 201 agent steps stratified by task type and window size, measuring what fraction of the sent context each step actually drew on and how much of it required verbatim rather than summarised form (Section 6).
- A behavioural measurement of post-compaction degradation over 128,853 observations, which is the counterweight the audit is structurally unable to see, and a sensitivity analysis showing that the optimal threshold is almost entirely determined by this one parameter (Section 7).
- A reconciled recommendation, an explicit break-even calculation for the fidelity position, and an alternative lever that dominates both (Section 8).
We are deliberate about what this is. It is a case study on a single subject with deep instrumentation, not a controlled experiment and not a multi-subject survey. Section 9 states the resulting limits precisely.
2. Corpus and instrumentation
2.1 Sources
The corpus covers 162 consecutive days, 2026-01-18 to 2026-08-01, of one engineer's agentic coding work: 287,748 API calls distributed across 2,451 distinct agents and threads.
Two independent sources were combined. The first is gateway telemetry: every agent invocation on the subject machine is routed through a wrapper that emits OpenTelemetry spans to LangWatch, so each session materialises as a trace carrying cost, cache reads and cache writes as separate token classes, with every shell command as a child span. The second is the harness's own local session transcripts, which record per-call token usage and, critically, explicit compaction boundary records.
The two sources agree to within approximately 18% on any given day. The discrepancy is attributable to sessions started outside the instrumented wrapper. We use the local transcripts for all per-call analysis, since they are complete for the subject machine, and gateway traces for incident reconstruction and cross-validation.
2.2 A deduplication hazard
The harness writes one transcript line per content block of a streamed assistant message, and every such line repeats the same usage object verbatim. Naive summation of usage records inflates totals by approximately 1.7x.
We flag this because we made the error ourselves before catching it, and because any replication of this work on the same transcript format will hit it. All figures reported here are deduplicated by message identifier. Context per call throughout is defined as cache_read_input_tokens + cache_creation_input_tokens + input_tokens.
2.3 Segmentation and task classification
We segment the corpus into 3,036 runs, where a run spans from a session start or a compaction boundary to the next such boundary. A run is therefore the natural unit of "a context window as it was actually experienced," and its length in tokens is the quantity a compaction threshold controls.
Each run is classified into one of five task types by tool and command signature: code understanding, research, building, QA and dogfooding, and driving a PR to merge. Runs are additionally assigned to context bands by the median window size observed within them.
3. A motivating incident
The study was prompted by an operational failure in the corpus. On a single day the subject's fleet consumed 2.25 billion tokens, exhausting the provider session limit four times. Of that total, 82% originated from subagents rather than from operator-initiated turns.
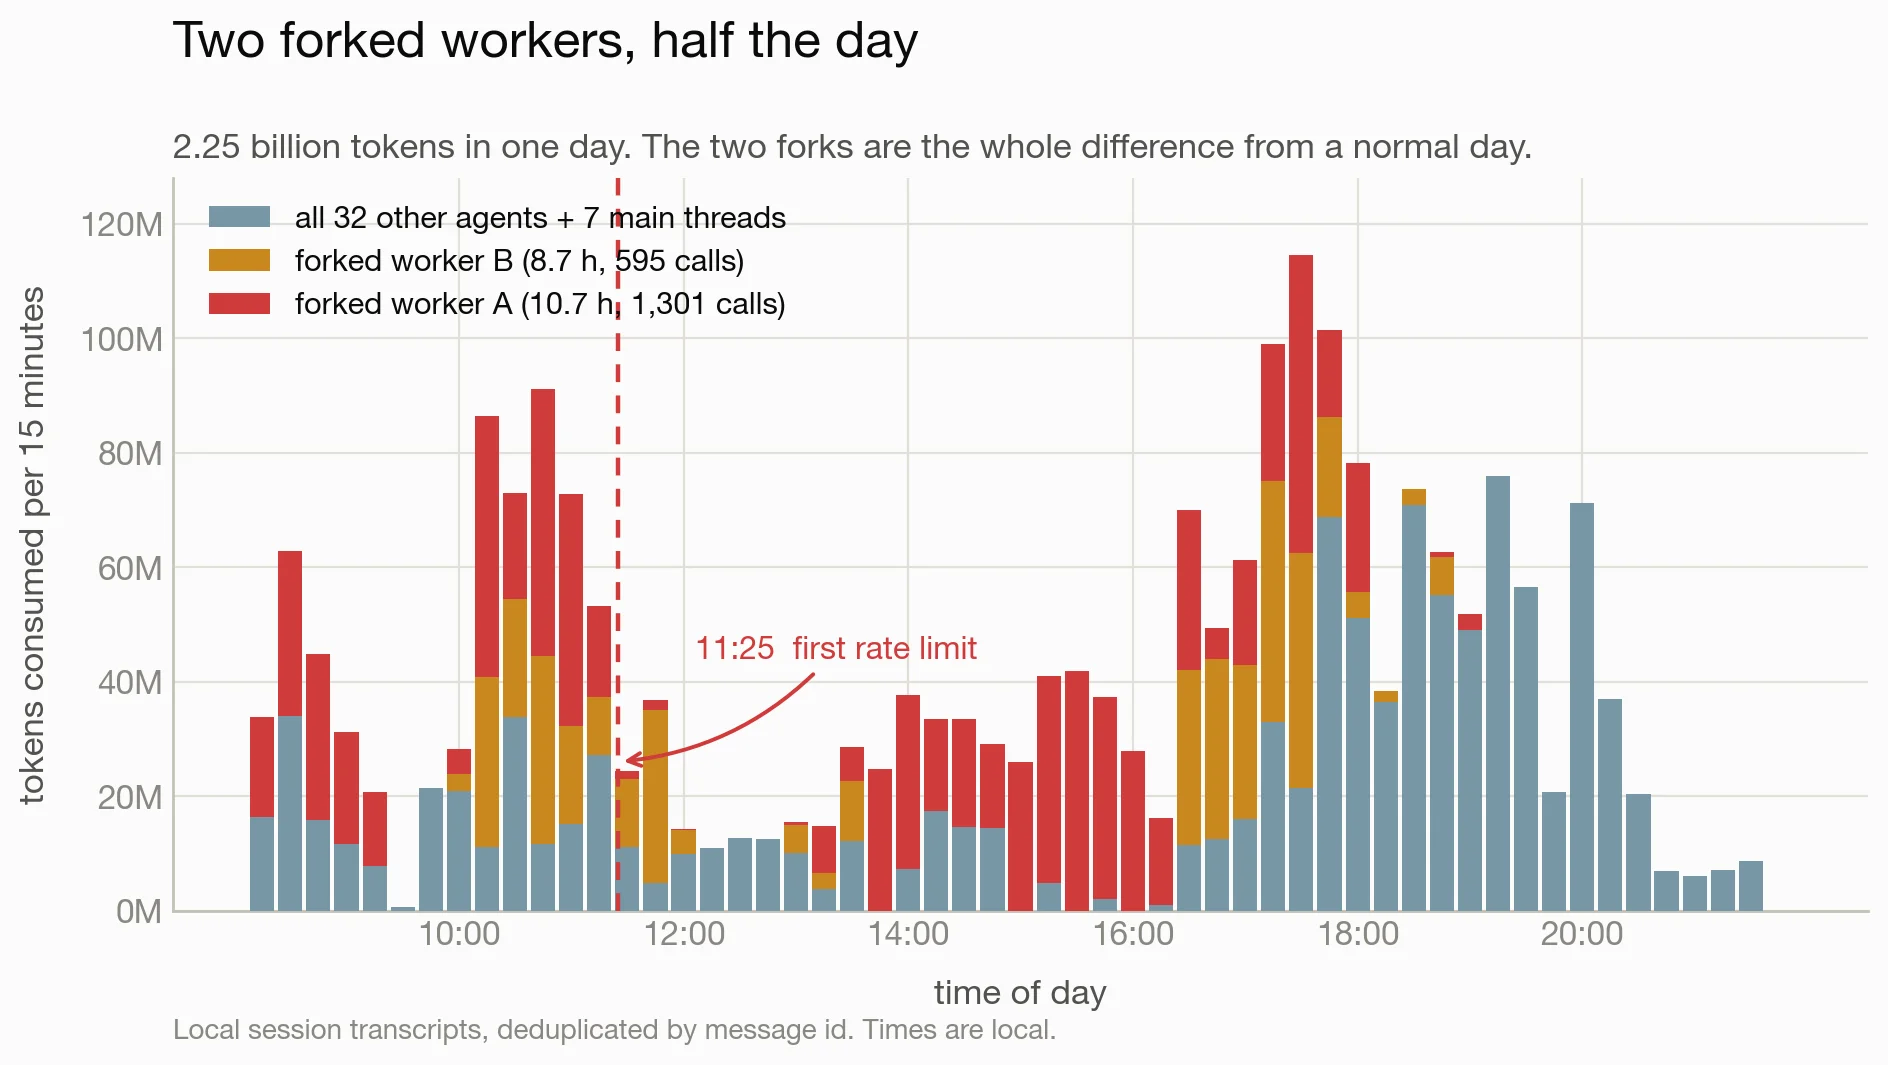
Figure 1. Token consumption over the incident day. Two subagents out of thirty-four account for 1.14 billion tokens, slightly over half the day's total.
The concentration is extreme: two agents out of thirty-four account for 1.14 billion tokens. Both were forks, meaning they were instantiated holding a full copy of the parent coordinator's conversation rather than a fresh context. One ran 10.7 hours and 1,301 API calls, the other 8.7 hours and 595 calls, in both cases far exceeding the single-directive briefing they were given.
Three ordinary design decisions compose into the outcome. Fork instantiation set the two agents' starting contexts at 523,544 and 304,404 tokens, against roughly 30,000 for a fresh subagent. Long-lived workers accumulate from wherever they start, and the larger of the two peaked at 997,634 tokens, within 0.3% of the model ceiling. And a building agent iterates through the shell: the same worker issued 1,112 shell commands, each of which re-transmits the entire window. At its mean context, a single test invocation cost approximately 568,000 tokens before the test itself executed.
No individual decision here is unsound. Their composition is what produced two agents that each cost more per step than most agents in the corpus cost per task, and then took hundreds of steps. The incident establishes that the quantity of interest is not window size but the integral of window size over the life of a session, which is what Section 4 measures.
4. The cost of context
4.1 Scaling
For every agent in the corpus we compute the cumulative tokens consumed at the moment its context first reaches each 25,000-token band, then take the median across agents. This measures the total price of arriving at a given window size, which is the quantity a compaction threshold actually governs.
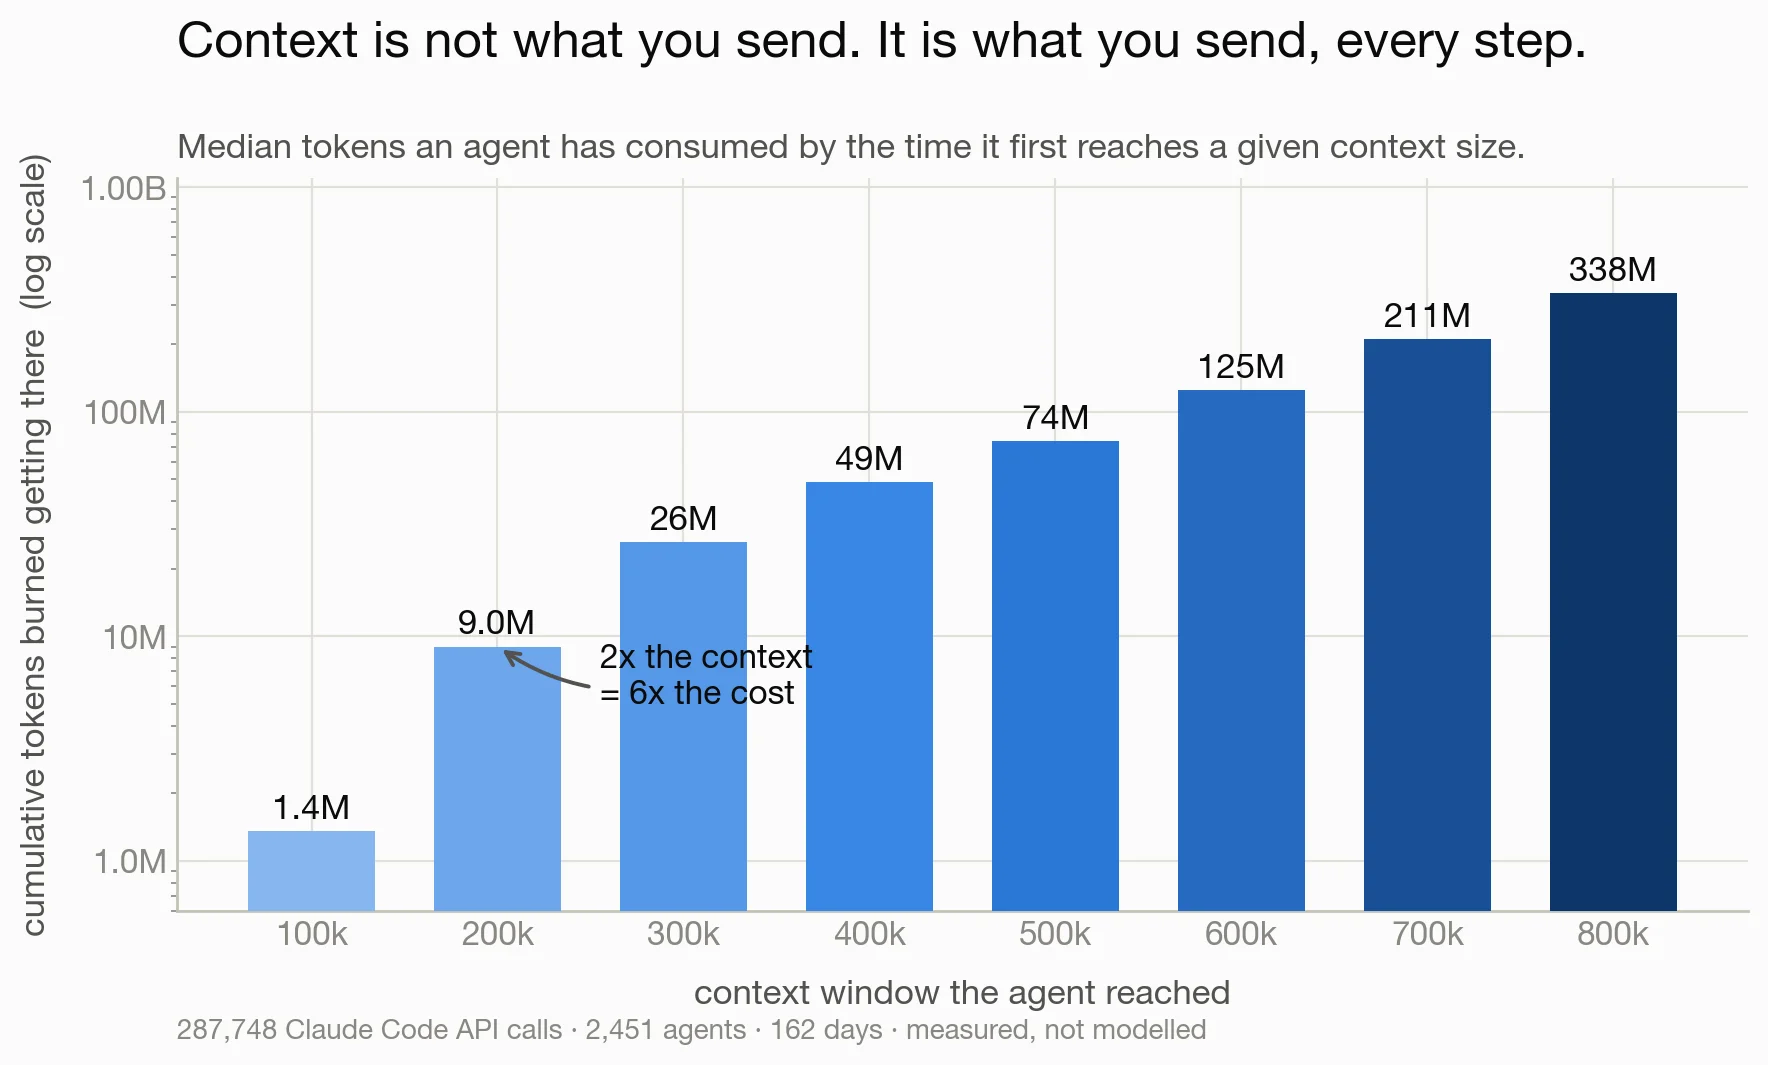
Figure 2. Median cumulative cost of reaching a given context size, across 2,451 agents. The fitted exponent is 2.55 with R² = 0.994.
Reaching 100k of context costs a median of 1.4M tokens. Reaching 200k costs 9M. Reaching 800k costs 338M, which is 250 times the 100k figure for eight times the window.
A log-log fit gives an exponent of 2.55 with R² = 0.994, and refits on sub-ranges hold between 2.36 and 2.66, so the relation is a stable power law rather than an artefact of the tails. We note that "exponential" is the term usually reached for in practitioner discussion, and it is not supported: an exponential does not lie on a power law this cleanly across a fortyfold range. The defensible summary is that cost scales as approximately C^2.5, or that each doubling of context costs roughly 6x.
4.2 Why the exponent exceeds two
Pure quadratic scaling is what results if each step adds a constant increment of context: the per-step price rises linearly and the step count rises linearly. The observed excess half-power has a measurable cause. The context added per step shrinks as the window fills, from approximately 3,200 tokens per step below 50k to a stable 1,470 tokens above 200k.
The upper region of a window is therefore accumulated in small increments, and each increment pays the full price of the window beneath it. Sessions do not merely get more expensive as they grow; they get less efficient at growing.
4.3 Caching does not change the exponent
Cache reads are billed at a lower rate per token, and it is common to treat this as neutralising the problem. It does not. On the incident day, cache reads were 95% of all tokens consumed. A cached token is still a token purchased on every subsequent step. Caching multiplies the constant and leaves the exponent untouched.
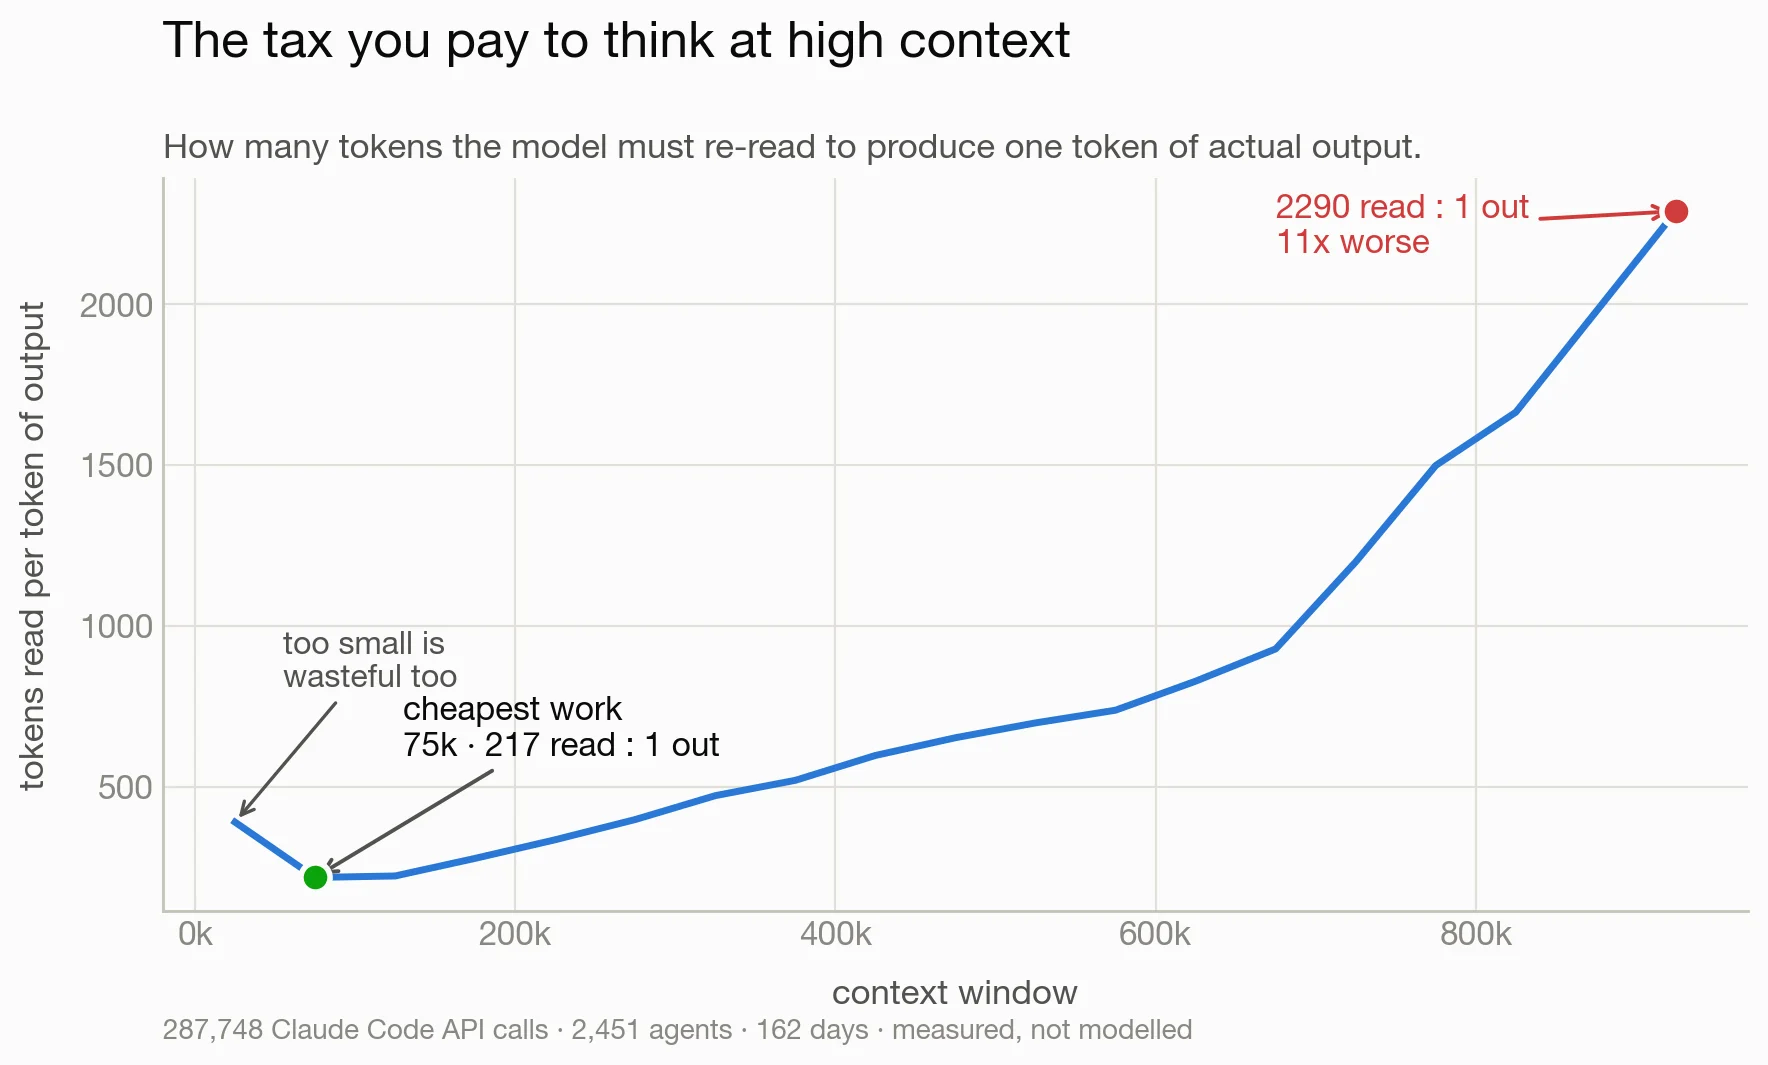
Figure 3. Read amplification, defined as tokens read per token of output, against window size. The curve is U-shaped with a minimum near 75,000 tokens.
Dividing tokens read by tokens of output gives the amplification factor directly. The curve is U-shaped, not monotonic. It reaches a minimum near 75k at 217 tokens read per token produced, and rises to 2,290:1 at 900k.
The left arm is as informative as the right. Below approximately 50k the agent has insufficient accumulated state to produce substantial output, so small windows are also inefficient. This is the first evidence in the study against the strong cost-control position: there is a floor as well as a ceiling, and "compact constantly" is not free.
4.4 Step count is close to unpredictable
Total cost is window size multiplied by step count, so a practitioner who could forecast step count could plan around it. The distribution says otherwise.
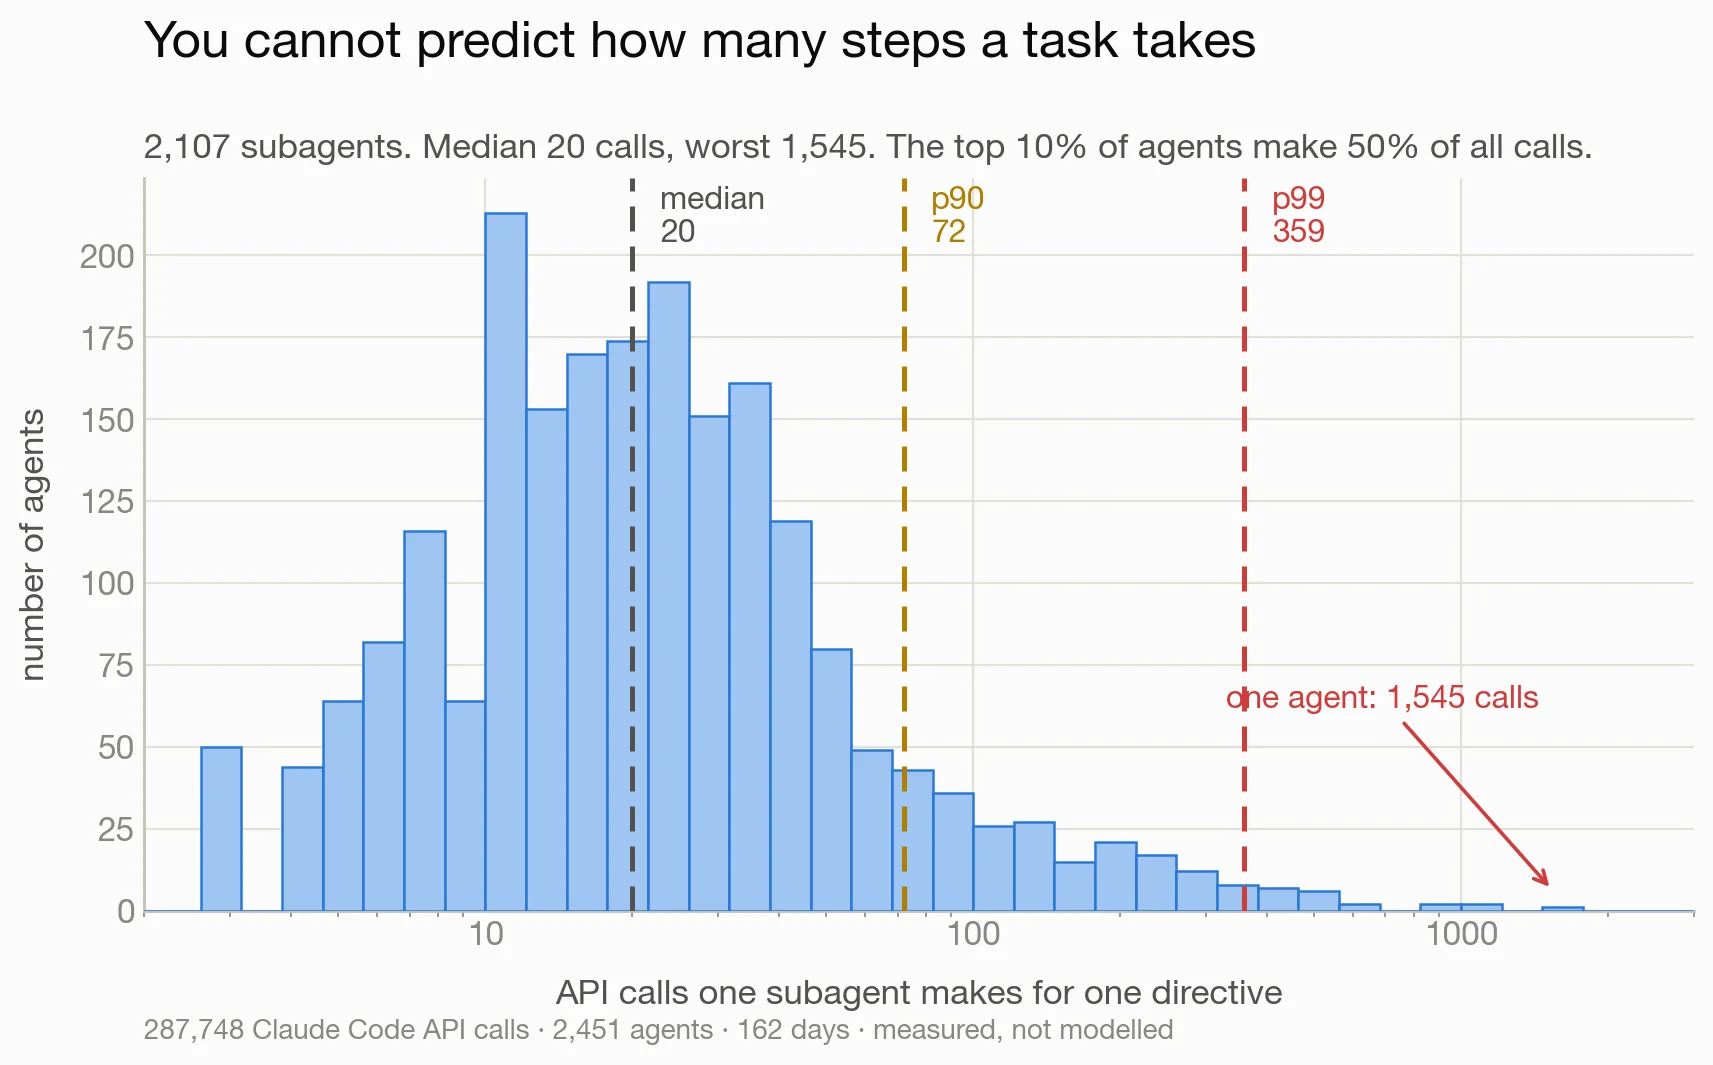
Figure 4. API calls per subagent, across 2,107 subagents each issued exactly one directive.
Across 2,107 subagents, each given exactly one directive, the median consumes 20 API calls. The 90th percentile is 72, the 99th is 359, and the maximum observed is 1,545. The top decile accounts for half of all calls in the sample.
Task inspection does not identify which regime a given directive will fall into. Whatever context an agent is initialised with is multiplied by a quantity that is not knowable in advance, which is a structural argument for controlling the initialisation point independently of the threshold. We return to this in Section 8.
5. The cost-optimal threshold
5.1 A cycle model
Compaction converts a large window into a small summary, so a session under a fixed threshold executes a repeating cycle: grow from the post-compaction size to the threshold, compact, repeat. All parameters of this cycle are directly measurable in the corpus.
Across 873 compaction events, a compaction lands the session at a median of 65,588 tokens (denote S). Context then grows at 1,470 tokens per step (D). For approximately 28 steps afterwards the agent ingests context above its own steady-state rate, re-reading files and re-establishing state, which we take as the measured rediscovery penalty (P) in step-equivalents.
Amortised cost per productive step at threshold T is then
where the first term is the integrated cost of growing from S to T over n steps, the second is the compaction call itself plus the resulting summary (SUMM = 4,382 tokens measured), and the denominator discounts the steps lost to rediscovery.
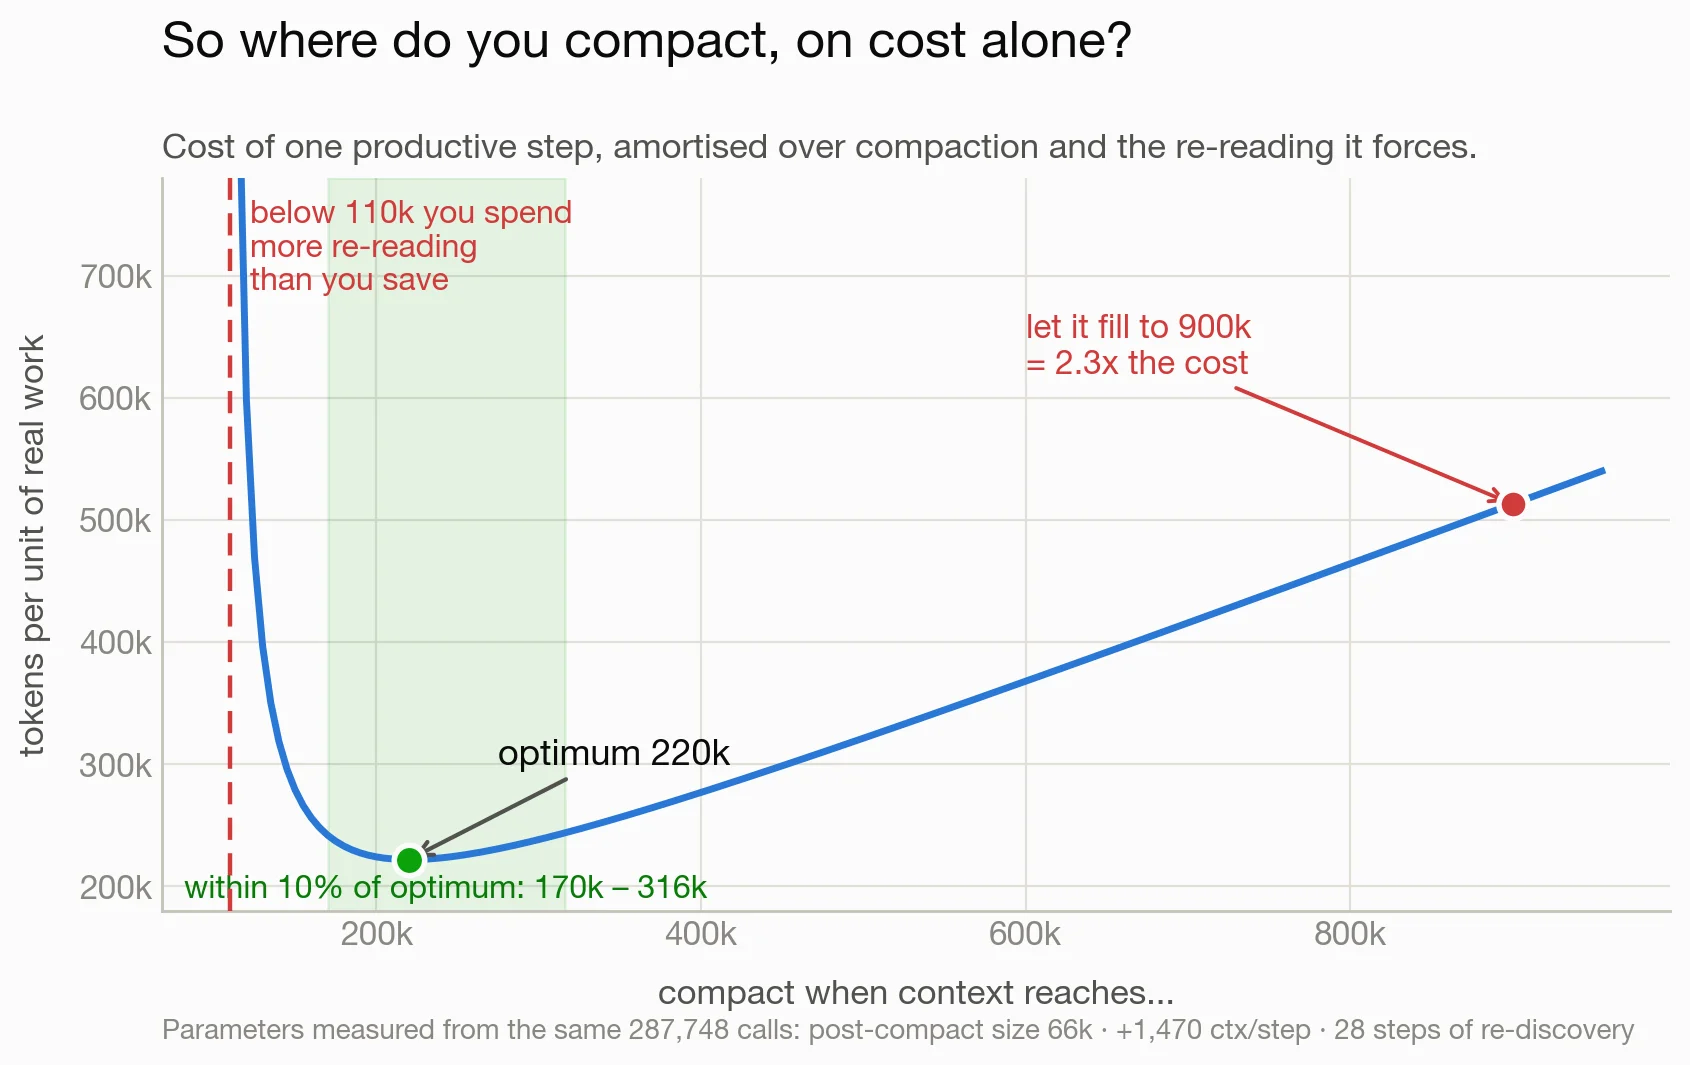
Figure 5. Amortised cost per unit of productive work as a function of compaction threshold, with parameters measured from 873 real compactions.
The curve is a bathtub with a steep left wall. The minimum is at 220,000 tokens; the region from 170k to 316k lies within 10% of optimal; and below approximately 110k the cycle fails outright because rediscovery consumes more steps than the cycle returns.
The asymmetry is the practically useful property. Compacting 90k early costs 1.79x the optimum, while compacting 96k late costs 1.10x. Under uncertainty, erring late is the lower-variance choice. The model also bears directly on million-token models: allowing the window to fill before compacting is 2.3x worse than compacting at 220k, so a larger ceiling is additional rope rather than a free capability upgrade.
5.2 An independent check
A model whose conclusion depends on its own parameter estimates warrants a check that shares none of them. We therefore measured, for every file an agent touched, the token distance back to the previous touch of that same path, resetting at boundaries. This involves no model, no judge and no cost assumptions; it is a mechanical property of file access order.
Across 10,037 repeat references the median distance is 7,430 tokens, with a long tail. A 100k window captures 72.4% of repeat references, 200k captures 77.6%, and 500k captures 82.6%. The residual 17% span millions of tokens and are unreachable at any window size, so 82.6% is an asymptotic ceiling rather than a point on a rising curve.
A 200k window therefore reaches 94% of everything any window can reach, and coverage per unit cost peaks at 240,000 tokens.
5.3 Convergence
Two optimisations sharing no parameters, one a cost model calibrated on compaction events and one a mechanical reference-distance frontier, land at 220,000 and 240,000. We treat this convergence as the strongest quantitative result in the study, subject entirely to the objection developed in Section 7.
6. The utility of context
Sections 4 and 5 price context. They cannot address whether the priced context deserved to be present, because a token is billed identically whether it contributes to the response or not. We therefore ran a judged audit.
6.1 Design
From the 3,036 segmented runs we sampled steps stratified by task type and by the context actually present at that step. Each sampled run was presented to an Opus judge as a packet containing: the operative directive; any inherited compaction summary, explicitly labelled as a lossy digest; a numbered inventory of every accumulated conversation item with its token count; and three sampled steps showing exactly what the agent had before it and what it did.
Judges marked which inventory items each step actually drew on, which we call the active context, and which were merely helpful. Token fractions were computed by us from the returned item identifiers rather than requested as a percentage, which keeps the reported quantity out of the judge's hands. Judges were prohibited from reading source transcripts, so their view was exactly the agent's view.
Every step also received a counterfactual: if everything except the most recent 30,000 tokens were replaced by a 5,000-token summary, would this step be unaffected, slightly degraded, materially degraded, or impossible.
201 steps were judged, 195 at medium or high confidence.
6.2 The active context is invariant to window size
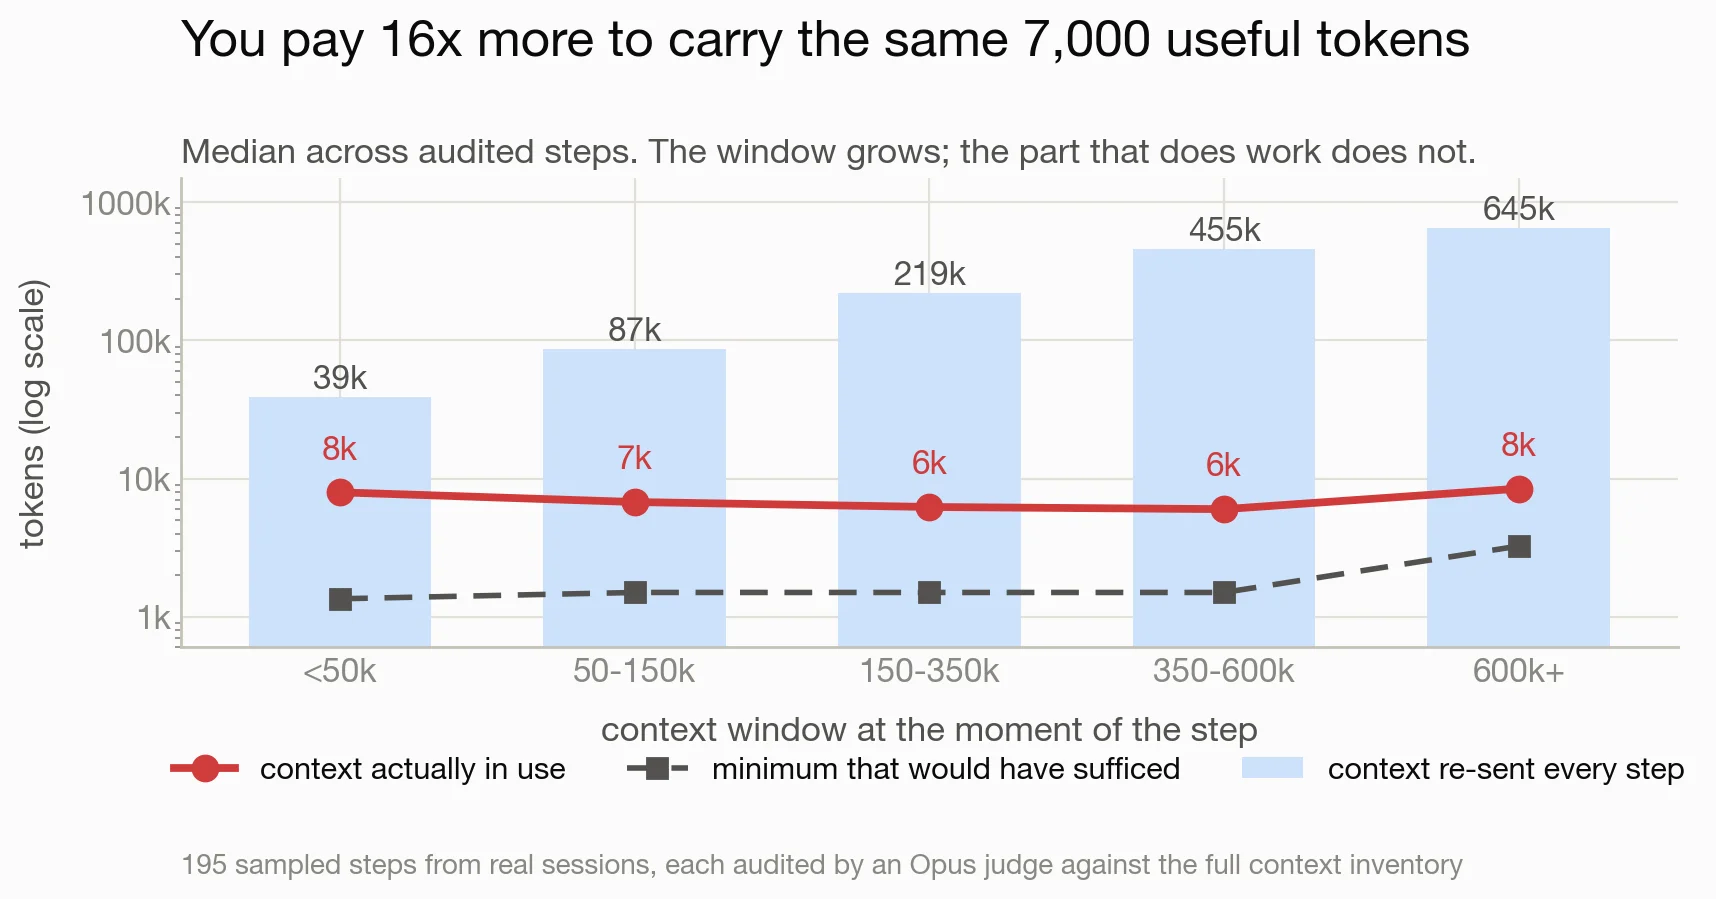
Figure 6. Window size, active context and judged minimum sufficient context, by context band.
Across bands the median window grows 16.6x, from 38,886 to 644,962 tokens. The active context moves from 7,949 to 8,452 tokens, which is to say it does not move. The judged minimum that would have sufficed for the same step sits near 1,500 tokens in every band except the largest.
Expressed as a share, the active context falls from 47.5% below 50k to 2.5% above 600k. What grows with the window is not the quantity of context that helps. It is the quantity carried in order to have it.
6.3 The decay is present in every task type
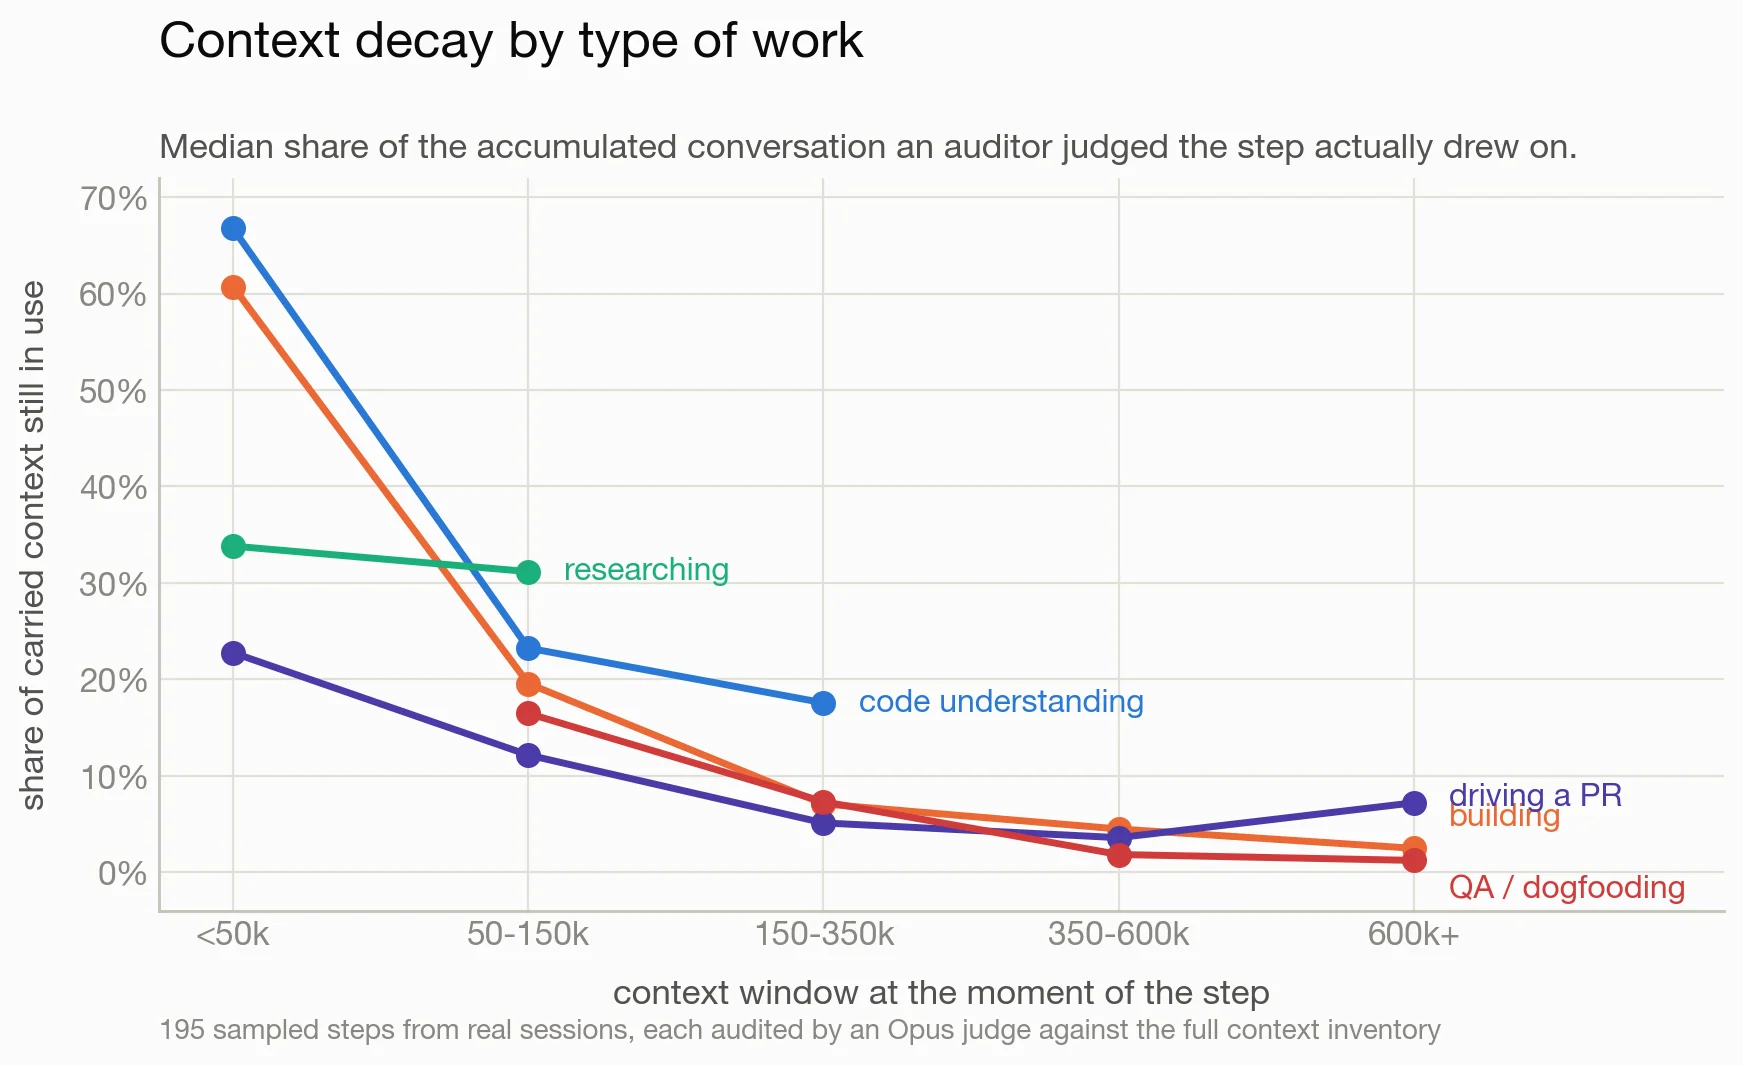
Figure 7. Active context as a share of the window, against context band, disaggregated by task type.
The decay appears in all five task types, and the ordering is interpretable. Code understanding retains value longest, still 18% at the 150k to 350k band, because reading is cumulative and each file read remains relevant to the explanation under construction. QA and PR driving decay fastest, because each browser check or review reply is a closed loop whose output supersedes its inputs.
One confound governs this figure and we state it plainly. In this corpus, task type and window size are correlated: research and code understanding rarely run past 150k, while QA and PR driving rarely begin below it because they occur late in long sessions. Only building spans all five bands, so it carries the only clean gradient, and every other series should be read solely across the range it covers. Section 9 proposes the experiment that would break this confound.
6.4 Verbatim dependence is real and narrow
The fidelity position makes a specific claim: that the verbatim original conversation carries information no digest preserves. This is directly testable. Judges were asked, for each step, whether the verbatim form of older context was doing work a summary would not capture.
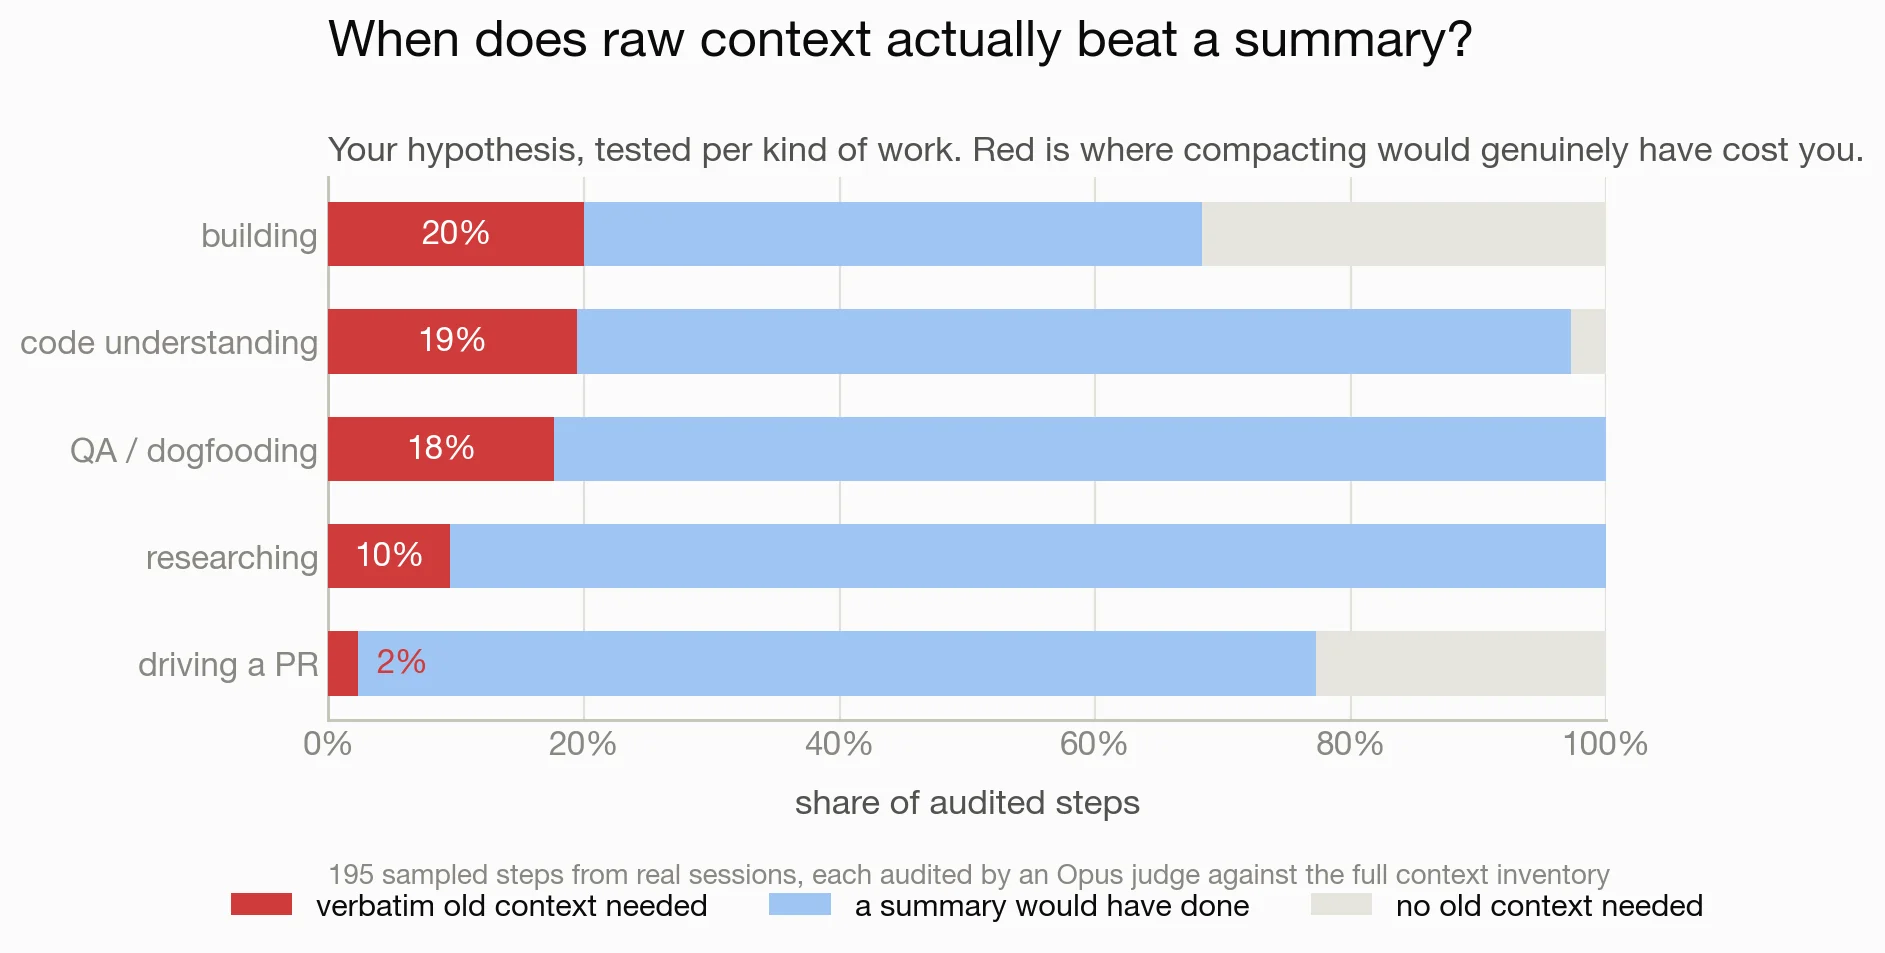
Figure 8. Verbatim dependence by task type.
The claim is supported and it is narrow. 28 of 195 steps, 14%, genuinely required verbatim old context. The cases cluster tightly around exact-string reproduction: an edit whose search text must match a previously read file character for character requires the verbatim read; a restart command reusing literal connection strings from 390 inventory items earlier requires the verbatim command. Where the dependency was a decision, a constraint or a finding rather than a literal, a summary carried it adequately. In one step at 622k of context, the single old fact the step depended on reached it through a hand-written digest, which is a direct counterexample to the strong form of the fidelity claim.
The dispersion by task type is large enough to act on. Building, code understanding and QA sit at 18% to 20% verbatim dependence. Driving a PR sits at 2%, with zero steps judged materially degradable by compaction.
On the counterfactual, 85% of steps returned unaffected, 15% slightly degraded, and 4 of 195 materially degraded. None were judged impossible.
Taken in isolation, Sections 4 through 6 converge on a single recommendation: compact early, in the region of 150k to 220k, and lower still for mechanical work.
7. The cost of compaction
7.1 A structural blind spot
The audit has a limitation that is not incidental but definitional. Judges scored steps that were taken. A step that went subtly wrong because a relevant detail had been summarised away does not present as a bad step; it presents as an ordinary step whose consequences surface later, in review or in production. The instrument cannot observe its own most important failure mode, and this biases every compaction verdict optimistic by an unknown amount.
This is precisely where the fidelity position lives, and it cannot be dismissed on the audit's evidence. It can, however, be attacked from a different direction. Quality is hard to measure; behaviour is not.
7.2 Behavioural proxies
We computed two proxies over 128,853 observations drawn from 700 transcripts: the rate at which tool calls return errors, and the rate at which operator messages contain a correction, detected by phrase match. Both are measured against steps elapsed since the last compaction, which confines every comparison to within a single session and broadly controls for task difficulty.
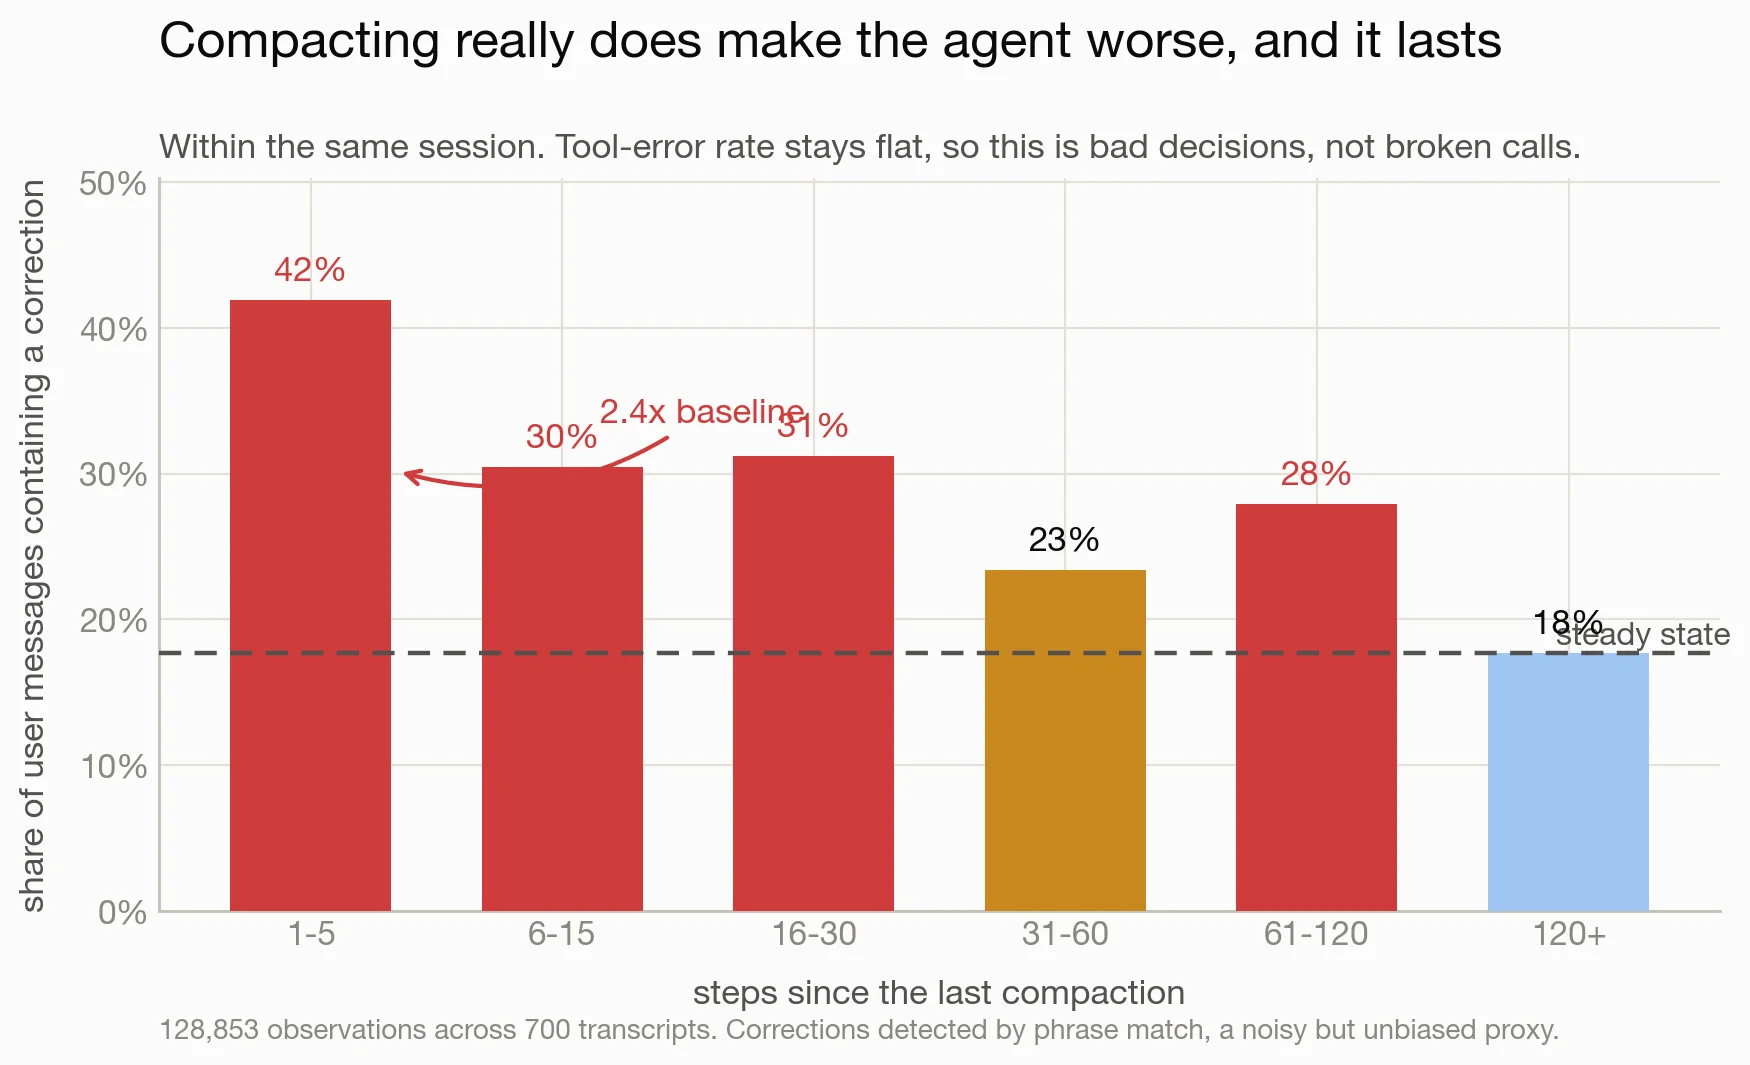
Figure 9. Correction rate against steps since last compaction. The tool-error rate over the same interval is flat at 2.6% to 3.2%.
In the five steps following a compaction, 41.9% of operator messages contain a correction, against a steady-state baseline of 17.7%. The ratio is 2.37x. Elevation persists for at least 30 steps and has not fully resolved by 120. Over the same interval the tool-error rate is flat at 2.6% to 3.2%.
The dissociation is the finding. The agent is not issuing malformed calls. It is issuing well-formed calls that the operator judges to be wrong. Post-compaction degradation is a decision-quality effect, not an execution effect, which is consistent with the fidelity position and inconsistent with treating compaction as cost-free.
7.3 The event itself
The mechanism is unmysterious once the event is measured directly. Across the 873 compactions, the median event reduces a 574,875-token window to a 4,382-token summary. Slightly under 1% of the raw material survives. Each event costs a median of 142 seconds of wall clock.
This reframes the frequency question. A 30-step disruption inside the 105-step cycle implied by a 220k threshold means approximately 29% of all steps are spent inside the post-compaction degraded region. At a 577k threshold the cycle is 348 steps and the figure falls to 9%. Frequent compaction does not merely incur rediscovery cost; it repeatedly returns the session to its worst-performing interval.
7.4 Sensitivity
Re-running the cycle model of Section 5.1 while varying the penalty parameter P shows that the optimum is almost entirely a function of this single quantity.
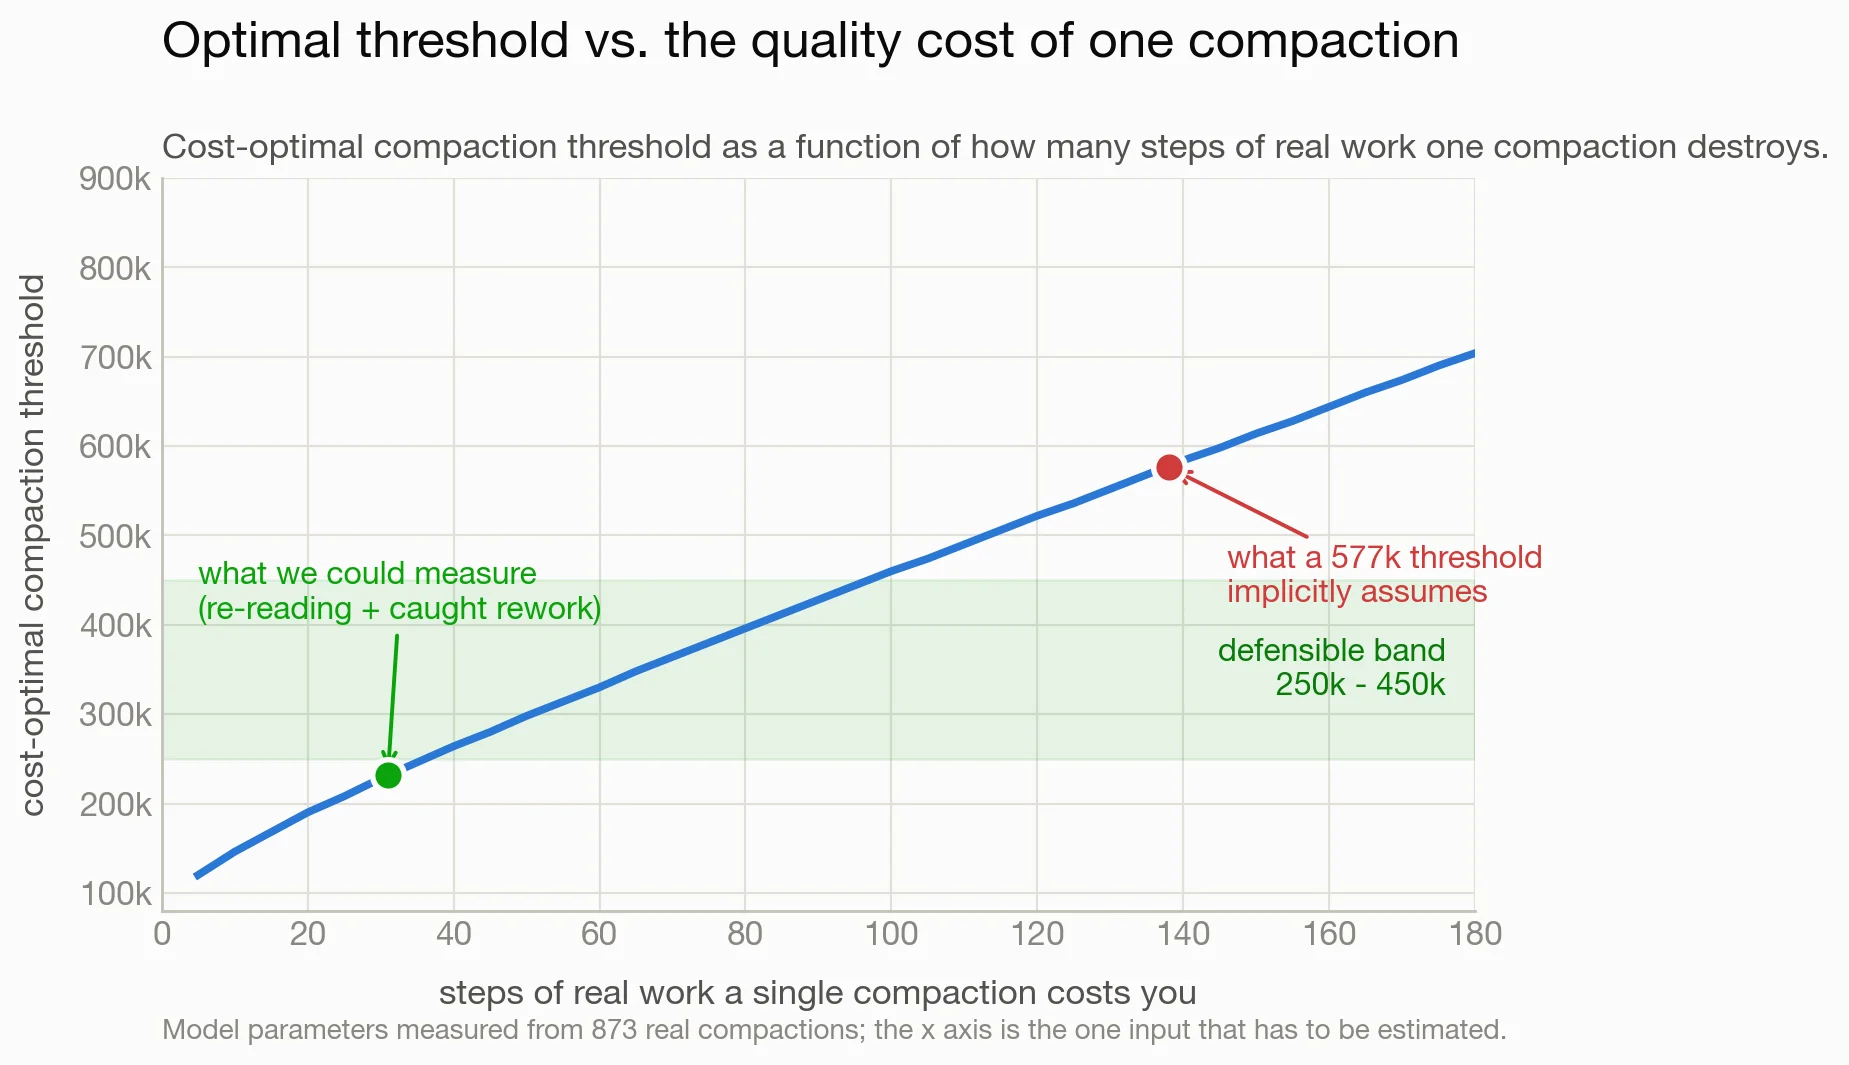
Figure 10. Cost-optimal threshold against the assumed per-compaction penalty in wasted steps. The measurable region and the region implied by common practitioner settings are marked.
| Assumed cost of one compaction | Cost-optimal threshold |
|---|---|
| 28 steps (rediscovery only, measured) | 220,000 |
| 31 steps (plus visibly caught rework) | 232,000 |
| 65 steps | 350,000 |
| 113 steps | 500,000 |
| 138 steps | 577,000 |
| 145 steps | 600,000 |
Table 1. Sensitivity of the optimal threshold to the per-compaction penalty.
Approximately 31 steps is what we can measure. A practitioner running a 600k threshold is implicitly asserting a penalty near 145 steps, roughly five times the measurable figure. Given a correction rate still elevated past 100 steps, that assertion is not unreasonable. It is also not established, and we are explicit about which of the two we are claiming.
7.5 The fidelity position does not break even on tokens
The wide-window position deserves the same scrutiny as the position it opposes. Moving from a 232k threshold to 600k costs an additional 139M tokens per 1,000 productive steps and removes 6.1 compaction disruptions, which prices a disruption avoided at approximately 23M tokens. For this to break even, a single escaped defect would have to cost between 46M and 229M tokens depending on the rate at which a disruption leaks one. A thorough debugging session in this corpus costs a few million.
The conclusion we draw is not that the fidelity position is wrong. It is that the fidelity position is not a token argument and should not be litigated as one. A defect reaching production is paid for in engineer hours, in customer trust, and in the interval between shipping and detection, none of which appear in this dataset. What the analysis supplies is an exchange rate, not a decision. What it does establish is that anyone defending a wide window on cost grounds is defending it on the wrong axis, because on that axis it loses by one to two orders of magnitude.
8. Reconciliation and recommendation
Three of the four measurements price what context buys, and they agree: 220k from the cycle model, 240k from the coverage frontier, and 120k to 190k from the audit's view of how much active context a window must hold. The fourth prices what compaction costs and pushes in the opposite direction. Reconciling them yields a range differentiated by task type rather than a scalar.
A single re-run of the cycle model makes the reconciliation concrete rather than negotiated. Setting the compaction penalty to 55 steps, roughly double the 28 attributable to re-reading alone and consistent with a correction rate still elevated well past 30 steps, moves the optimum from 220,000 to 314,000 tokens. The region lying within 10% of that optimum spans 239,000 to 453,000. The model's lower bound moves correspondingly, from approximately 110,000 to 146,000 tokens. The mechanism is direct. A compaction leaves the session at 65,588 tokens and context accumulates at 1,470 tokens per step, so a 146,000-token threshold yields 55 steps per cycle. When the penalty is also 55 steps, the entire cycle is spent recovering from the compaction that began it and net productive work is zero. Thresholds below that point are dominated by not compacting at all.
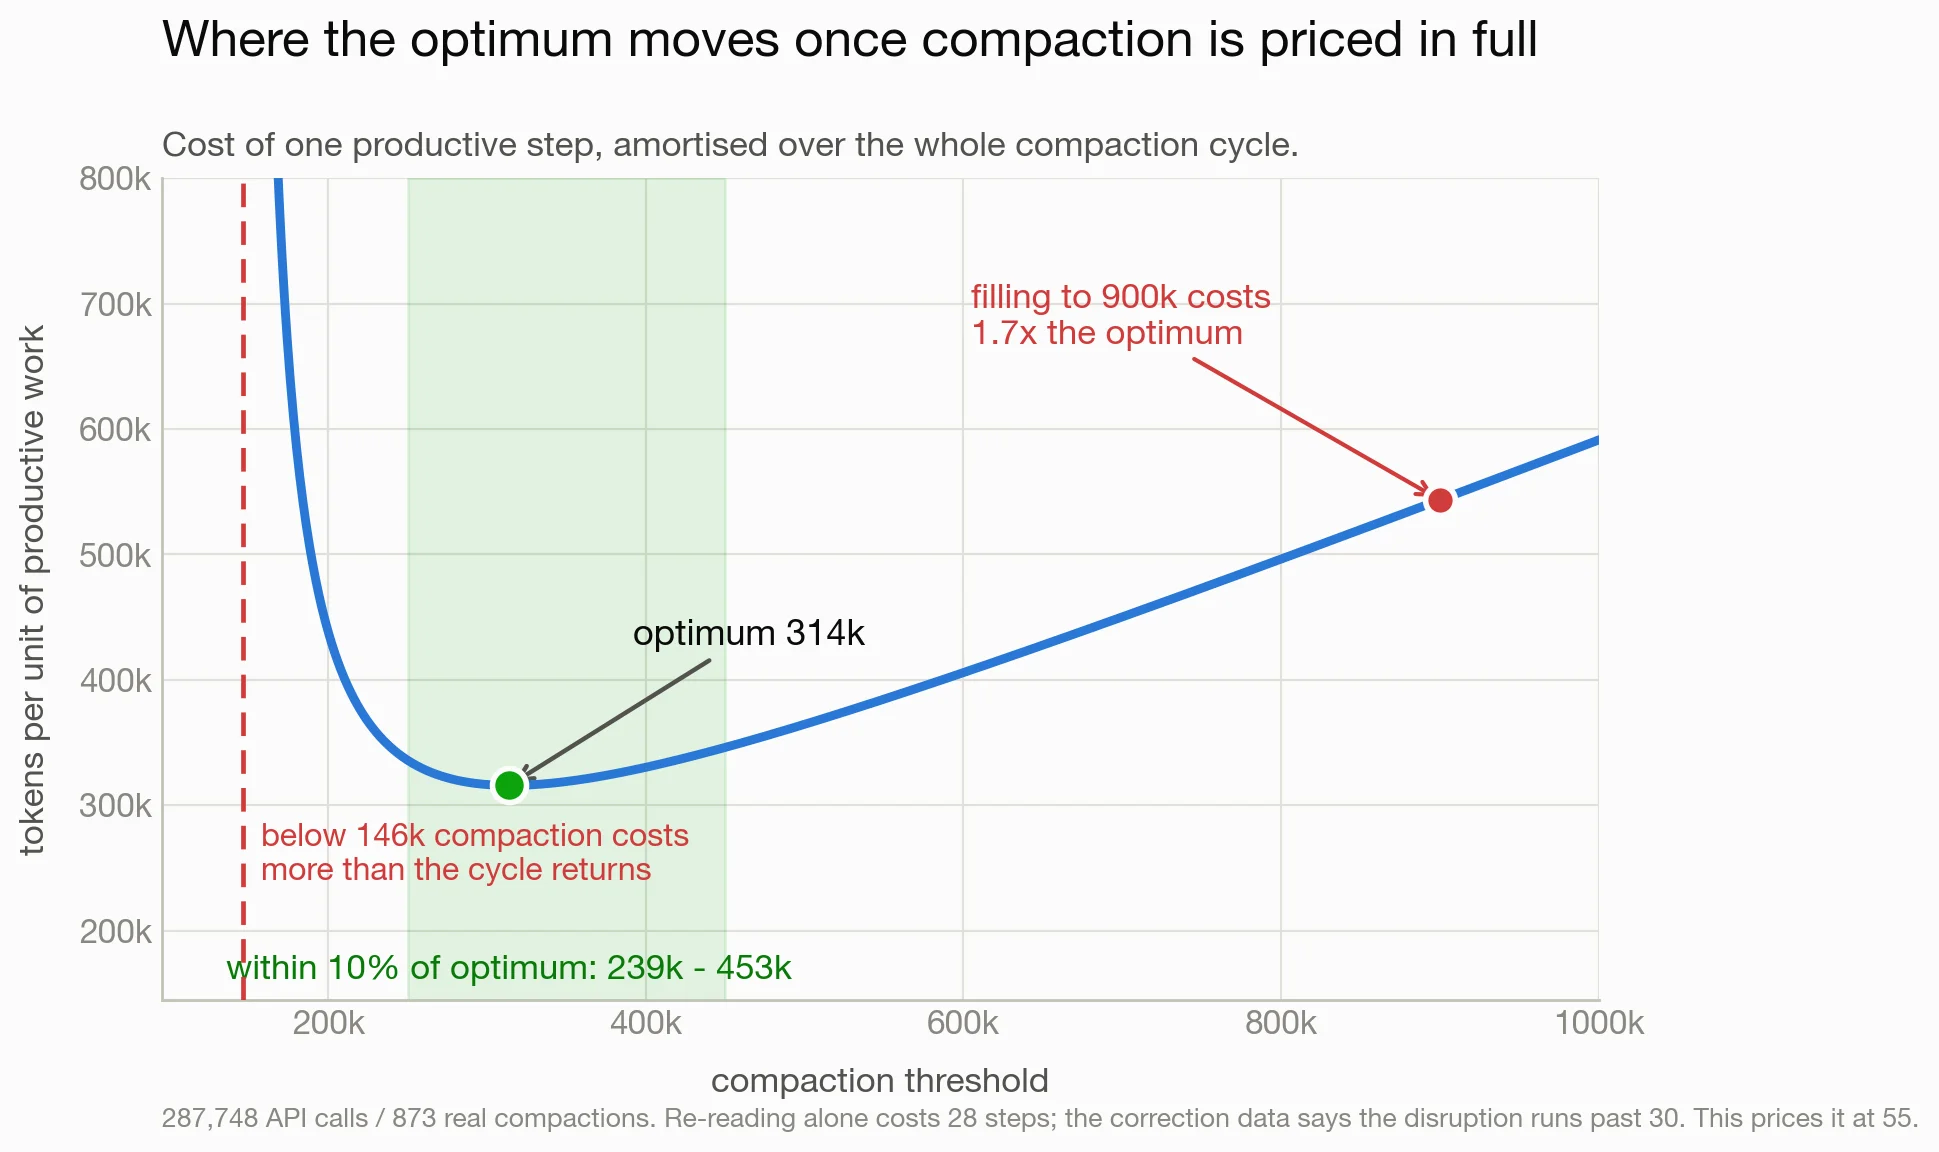
Figure 11. Amortised cost per productive step with the compaction penalty set at 55 steps rather than the 28 measurable from re-reading alone. The within-10% region reproduces the recommended range, so Table 2 is derived from the model rather than asserted alongside it.
We note one quantity that moves counterintuitively between Figures 5 and 11. The penalty for allowing the window to fill to 900k falls from 2.3x to 1.7x the optimum. The absolute cost of operating at 900k is nearly unchanged (512k against 543k tokens per productive step); what changes is the baseline, since a higher compaction penalty raises the cost at the optimum from 221k to 316k. Every ratio in this section is therefore relative to a baseline that is itself a function of the penalty parameter, and the direction is correct: the more expensive compaction is, the less the never-compact strategy is penalised in relative terms.
A reader may reasonably ask why the penalty for a 900,000-token window is only 1.7x when Section 4 establishes cost scaling of approximately . Three distinct quantities describe the same window, and they should not be conflated.
- Marginal cost of a call. A call bills approximately the current window, so a call issued at 900,000 tokens costs 2.87x one issued at 314,000.
- Amortised cost per unit of completed work, which is what Figure 11 plots. The session is not held at the threshold but climbs to it, so the relevant quantity is the mean window over a cycle: 482,794 against 189,794 tokens, a factor of 2.54. The wider setting then recovers part of that, because it incurs the 55-step penalty once per 568 steps rather than once per 169. The net is 1.72x.
- Cumulative cost of reaching the size once, which is what the power law of Section 4 measures. This is the largest of the three, since every step of the climb pays for the window beneath it, and it is the least decision-relevant here: reaching 900,000 tokens also entails 3.36x more steps of work along the way.
Infrequent compaction is therefore genuinely more efficient per compaction event. It does not recover the cost of carrying 2.5x the window on every step, which is the finding, but the effect is real and is why the amortised penalty is smaller than the marginal one.
| Task type | Suggested threshold | Basis |
|---|---|---|
| Driving a PR | 200k to 250k | 2% verbatim dependence, zero materially degraded |
| Research | 250k to 300k | self-contained, zero materially degraded |
| QA and dogfooding | 250k to 350k | fast decay, but 6% materially degraded |
| Building | 300k to 450k | highest verbatim dependence, exact-string edits |
| Code understanding | 300k to 450k | slowest decay, value remains cumulative |
Table 2. Recommended compaction thresholds by task type.
Below approximately 200k the post-compaction degraded region begins to consume a large fraction of working time. Above approximately 600k the practitioner is paying a substantial premium against a benefit that has not been measured by anyone, including us.
8.1 The dominant lever is not the threshold
Two findings suggest that threshold tuning is the smaller of the available levers.
The first follows from Section 7.3. The harm is concentrated at the discontinuity, and the discontinuity is severe precisely because 0.8% of the window survives it. Preserving a verbatim tail of 30k to 60k tokens rather than a 4,382-token digest addresses the degraded interval directly rather than merely reducing how often it occurs. Under the same cycle model, a 350k threshold with a 60k preserved tail costs 25% less per unit of productive work than a 600k threshold with a bare digest, and it reduces the depth of each disruption rather than only the count.
The second follows from Sections 3 and 4.4. The largest single determinant of an agent's total cost is where it starts, not where it compacts. A fresh subagent begins near 30k. A subagent forked from a loaded parent begins wherever the parent was, and then pays the power-law toll from a running start across an unpredictable number of steps. The two agents in Section 3 began at 523,544 and 304,404 tokens. No threshold policy recovers that.
9. Threats to validity
Single subject. This is one engineer's usage, weighted heavily toward agentic coding on a specific harness and model family. The constants are theirs. The shapes should generalise further than the constants, but neither is established outside this corpus.
Confounding of task type and window size. As stated in Section 6.3, only building spans the full range of context bands. Per-task curves are informative only across the range each covers. The clean experiment is available and cheap: compact PR-driving sessions at 200k and building sessions at 400k deliberately for a fixed period, which decorrelates the two variables by construction.
The audit is blind to counterfactual harm. By design it scores steps that occurred. This is the entire reason the behavioural measurement of Section 7 exists, and it should be read as a partial rather than complete correction.
Reverse causation in the correction metric. Compaction on this subject's harness is partly discretionary, and an operator may compact because a session is going badly, which would inflate the post-compaction correction rate without any causal contribution from compaction itself. That elevation persists beyond 100 steps is difficult to explain this way, but the measurement is observational and we do not claim otherwise. A harness that compacts on a fixed token trigger rather than on operator judgement would settle it, and we would welcome that replication.
Correction detection is a noisy proxy. Phrase matching over operator messages captures corrections imprecisely. We take it to be noisy but unbiased with respect to steps-since-compaction, which is the only property the comparison requires.
10. Conclusion
The practitioner debate over context windows has been conducted between two positions that are each half correct, and the halves are separable.
The cost-control position is correct that most of a large window is inert. We measure the active context at 6,000 to 8,500 tokens regardless of whether the window holds 39,000 or 645,000, and we measure the price of carrying the remainder as a power law with exponent 2.5.
The fidelity position is correct that compaction is not free, and more correct than the cost data can express. The 2.37-fold post-compaction correction rate, dissociated from a flat tool-error rate, is a real effect of a size that token accounting cannot represent.
What does not survive is the inference from the second to a very wide window. The exchange rate is approximately 23M tokens per compaction disruption avoided, which requires an implausible escaped-defect cost to justify. The evidence supports compacting, and compacting within 250,000 to 450,000 tokens by task type, rather than either extreme.
The more useful conclusion is that the community has been optimising the wrong parameter. Compaction thresholds are the visible knob, so they receive the attention. But the median compaction discards 99.2% of the window, and the measured harm is concentrated entirely at that discontinuity. Enlarging what survives dominates enlarging what accumulates, on both cost and measured disruption, and it is not exposed as a setting in any harness we are aware of.
We would like to see this replicated on a fixed-trigger harness, which is the one design that resolves the causal ambiguity in our central counterweight. If you operate one and can measure per-call context, the analysis in Sections 5 and 7 reproduces from data you already have.
Appendix A. Measured parameters
| Parameter | Value | Source |
|---|---|---|
| Corpus span | 162 days, 2026-01-18 to 2026-08-01 | local transcripts |
| API calls | 287,748 | deduplicated by message id |
| Agents and threads | 2,451 | local transcripts |
| Cost scaling exponent | 2.55 (R² = 0.994, sub-range 2.36 to 2.66) | log-log OLS, Figure 2 |
| Context added per step | 3,200 below 50k, 1,470 above 200k | per-call deltas |
| Read amplification minimum | 217:1 near 75k | Figure 3 |
| Read amplification at 900k | 2,290:1 | Figure 3 |
| Steps per subagent directive | median 20, p90 72, p99 359, max 1,545 | n = 2,107 |
| Compaction events | 873 | explicit boundary records |
| Post-compaction context (S) | 65,588 tokens | median of 873 |
| Compaction summary size | 4,382 tokens | median of 873 |
| Pre-compaction window | 574,875 tokens | median of 873 |
| Fraction of window preserved | 0.8% | derived |
| Compaction wall clock | 142 seconds | median of 873 |
| Rediscovery penalty (P) | 28 steps | excess ingestion vs own median |
| Repeat file references | 10,037, median distance 7,430 tokens | path-level, boundary-reset |
| Coverage ceiling | 82.6% | asymptote of reference distance |
| Audited steps | 201 (195 medium or high confidence) | LLM judge |
| Active context | 7,949 to 8,452 tokens across 16.6x window range | Figure 6 |
| Active context as a share | 47.5% below 50k, 2.5% above 600k | Figure 6 |
| Verbatim dependence | 14% overall, 2% PR driving, 18 to 20% building | Figure 8 |
| Behavioural observations | 128,853 across 700 transcripts | phrase match |
| Correction rate, steps 1 to 5 | 41.9% vs 17.7% baseline | Figure 9 |
| Tool-error rate, same interval | 2.6% to 3.2%, flat | Figure 9 |
Appendix B. Method notes
Context per call is defined as cache reads plus cache writes plus fresh input tokens. Usage records are deduplicated by message identifier before any aggregation.
The cumulative cost curve takes, per agent, the running token total at the first call reaching each 25,000-token band, then the median across agents at each band. Compaction events are read from explicit harness boundary records, which carry pre-compaction context, trigger type, duration and the identifiers of preserved messages. Rediscovery is computed as excess context ingested in the 25 steps following a compaction relative to that agent's own median step growth, expressed in step-equivalents.
Reference distance is measured between successive touches of the same file path within an agent, reset at compaction boundaries. Judge packets reconstruct the agent's exact visible state at a step, including replaying preserved-message identifiers across compaction boundaries so that the preserved verbatim tail is represented rather than dropped.