
4 best tools for monitoring LLM & agent applications in 2026
Comprehensive guide to monitoring, observability, evaluation, and optimization for production LLM and AI agent applications with LangWatch.
 Bram P · January 30, 2026 · LLM Evals
TL;DR: Top LLM monitoring tools to watch in 2026
All-in-one: LangWatch - combines monitoring, evaluations, and experimentation in a single platform
Enterprise: Confident AI - standardizes evaluations, observability, red teaming, and AI governance across product teams and technology stacks
Cross-stack monitoring: Datadog - useful for organizations that want AI workloads monitored alongside the rest of their software stack
Open-source: Langfuse - self-hosted LLM observability with strong community adoption
If you’re running production LLM applications and need observability that goes beyond logs, built-in evaluations, token-level usage tracking, and accurate cost attribution, LangWatch stands out as the most comprehensive option today.
Shipping an LLM to production is easy. Keeping it reliable, affordable, and consistently high-quality is the hard part.
Without proper LLM production monitoring, you’re flying blind. You don’t actually know how your AI behaves once real users start interacting with it. Latency spikes, silent quality regressions, and runaway costs can creep in unnoticed. By the time customers complain, you’ve often already blown your budget - or worse, eroded trust.
LLM monitoring tools close this gap by tracing every request across your LLM pipeline. They capture prompts, responses, token usage, latency, and costs end to end. With this visibility, teams can evaluate output quality, debug failures, and continuously optimize performance using online evaluations - before small issues turn into production incidents.
Why monitoring LLM applications matters
LLM monitoring platforms typically focus on three core challenges:
Cost control
LLM APIs price per token, which means a single inefficient prompt or workflow can explode costs overnight. Token-level monitoring shows exactly where spend is coming from and highlights expensive calls. Without this insight, usage and bills grow unpredictably.
Quality assurance
LLMs are inherently non-deterministic. They hallucinate, lose context, and behave inconsistently as inputs vary. Monitoring enables continuous, automated quality evaluation in production. An assistant that performed flawlessly during testing can start returning incorrect or misleading answers once users ask novel or edge-case questions - monitoring is how you catch that early.
Performance debugging
Modern LLM systems are rarely a single call. They’re multi-step pipelines with tools, retrieval, and agent logic. Real-time observability makes it possible to pinpoint exactly where latency or failures occur, instead of guessing across the stack.
Ultimately, LLM monitoring shifts AI operations from reactive firefighting to proactive control - surfacing problems early, long before they escalate into customer-facing failures.
The 4 best LLM monitoring tools in 2026
| Tool | Category | Best for | Pricing |
|---|---|---|---|
| LangWatch | All-in-one · open source | Monitoring, evaluations, and experimentation in one platform | Free (200K events/mo); from €29/seat/mo |
| Confident AI | Enterprise | Standardizing evaluations, observability, and governance across teams | Free plan; usage-based paid |
| Datadog | Cross-stack monitoring | AI observability alongside the rest of your software stack | Free tier; from $15 per host per month |
| Langfuse | Open-source | Self-hosted observability with full data ownership | Free self-host; cloud from $29 per month |
1. LangWatch
LangWatch is an end-to-end platform that brings LLM production monitoring, evaluation, and agent testing together in one workflow. Tracing is OpenTelemetry-native with full GenAI spec support, so it captures multi-step LLM and agent workflows from any framework or language, with no proxy in your request path and no vendor lock-in. Every trace logs inputs, outputs, token usage, latency, and cost, with attribution by user, feature, model, or experiment, and multi-agent runs render as topology and sequence diagrams so handoffs and unexpected tool-call patterns are obvious at a glance.
What sets LangWatch apart is that monitoring feeds a proof loop instead of ending at a dashboard. Online evaluations (LLM-as-a-judge over single outputs or whole conversations) score production traffic in real time, built-in guardrails add PII and prompt-injection protection, and any observed failure can be converted into a multi-turn agent simulation that verifies the fix and gates the release in CI. The platform is open source (Apache-2.0) and self-hostable on any plan, and is trusted in production by enterprises in banking and payments including Deloitte, Backbase, and PagBank.
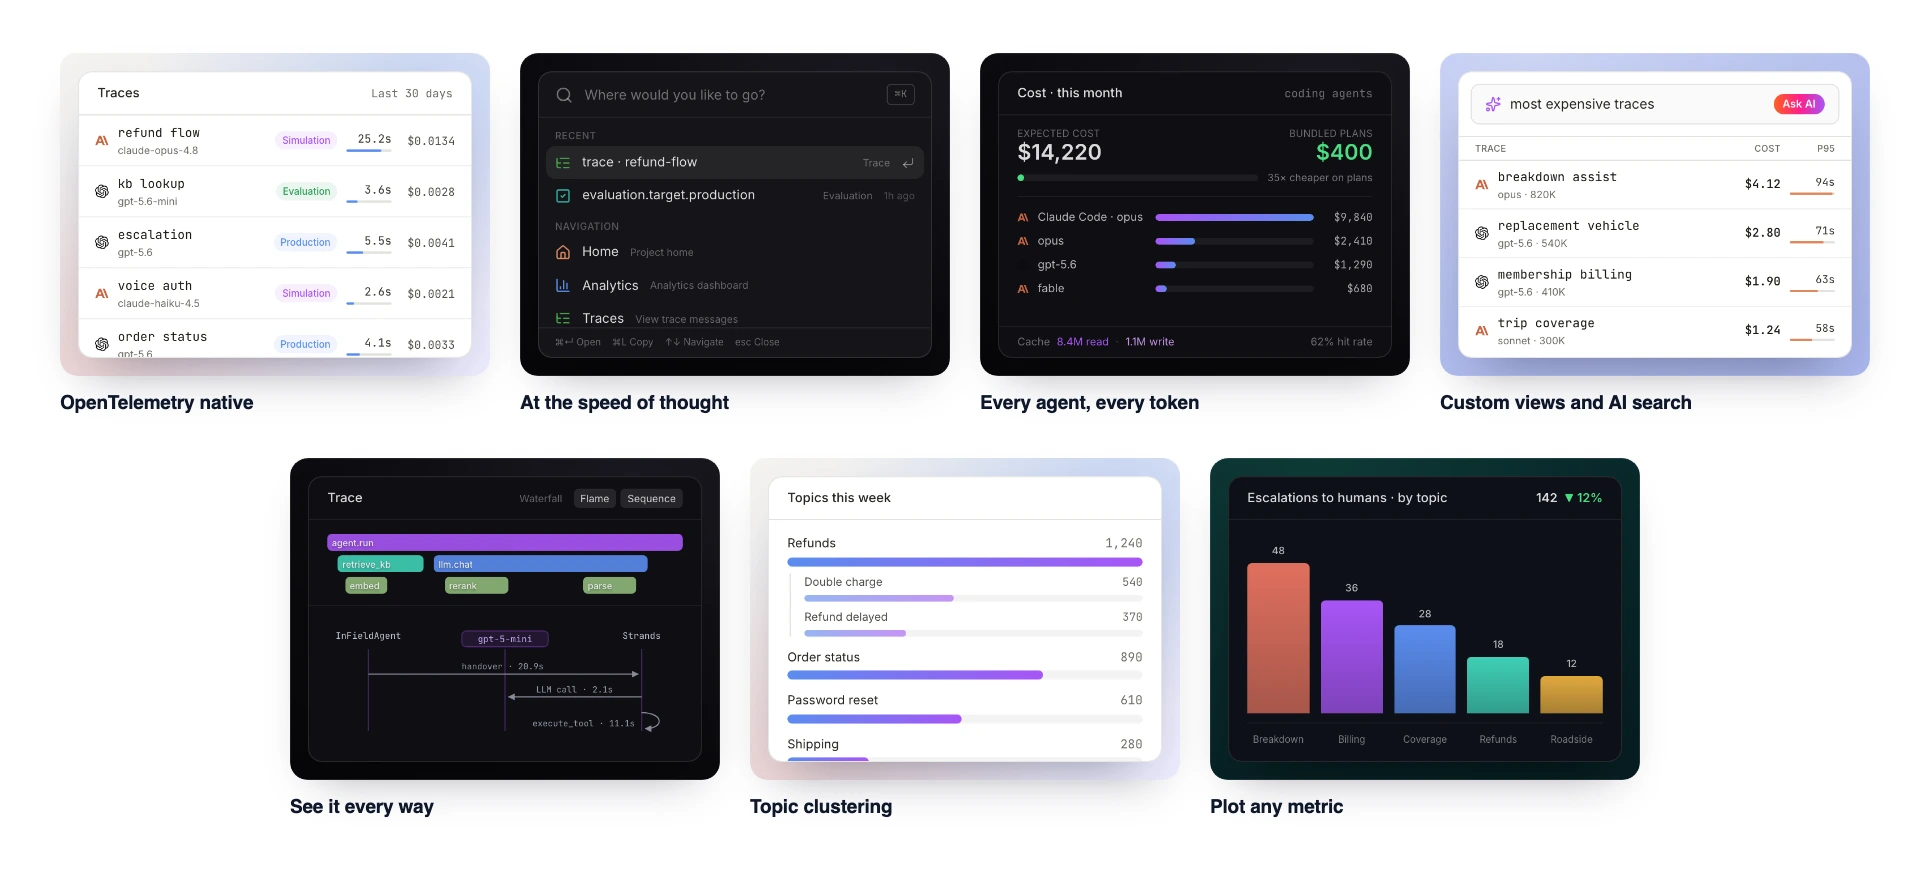
LangWatch trace explorer: OpenTelemetry-native traces with per-agent cost breakdowns, sequence-diagram views, AI-powered search, and linked evaluations.
Inside the new trace explorer
Agentic systems fail between calls, in tool invocations, retries, and agent-to-agent handoffs, and request-level loggers render all of that as a flat list. LangWatch's rebuilt trace explorer is built for reading runs, not requests:
-
AI-powered Asks (new): query traces in plain language, like "show me the top 10 traces with errors" or "which traces cost the most this week," instead of hand-building filters. Debugging becomes a conversation with your production data.
-
Sequence diagrams and topology (new): agent-to-agent handoffs and unexpected tool-call patterns are legible at a glance, alongside flame charts and span lists, with token cost and latency on every span, and any input or output readable as a rendered view, raw text, JSON, or Markdown.
-
Waterfall with a full audit trail: every step in the exact order it ran, durations stacked in time, so you see what ran when, what blocked what, and where latency accumulates across a long agent run. The causal picture flat logs cannot give you.
-
Filters linked to evaluations (improved): filter by model, project, labels, and metadata, and now by origin, so eval traffic is separated from real user traffic, then build a dataset from any selection and feed it straight into evaluations, closing the observe-to-test loop.
-
Lenses (new): save your filters, columns, and visualization as a named view, so your team standardizes on the lenses that matter.
Everything you already relied on, errors, costs, tokens, durations, models, evaluations, annotations, and analytics graphs built on the same traces, stays in one place, just faster to reach. No other tool on this list pairs this depth of agent tracing with evaluations running on the same data.
Pros
-
OpenTelemetry-native tracing built for multi-agent systems: waterfall, flame graph, topology, and sequence-diagram views
-
Online and offline evaluations on one scale, so the same judges score experiments in development and live traffic in production
-
Built-in guardrails with PII and prompt-injection protection on production traffic
-
Production traces convert into agent simulations and CI regression gates, so observed failures become repeatable tests
-
Token-level cost attribution by user, feature, model, or experiment, with budgets and alerts
-
Open source (Apache-2.0) with self-hosted, hybrid, or EU/US/UK/APAC cloud deployment
Cons
-
Purpose-built for LLM and agent systems, so infrastructure APM (hosts, services, databases) is out of scope
-
Full value requires adopting evaluation and simulation workflows, which is more than teams seeking basic request logging need
-
Younger open-source community than the longest-standing tracing projects
Best for
Teams building production LLM or agent applications, including enterprises in regulated industries, that need monitoring, quality evaluation, and agent testing in a single platform with self-hosting and EU data control.
Pricing
Free tier (200K events per month). Paid from €29 per seat per month with unlimited lite seats and $1 per additional 100K events, plus custom Enterprise plans for self-hosted and hybrid deployments. See pricing details →
2. Confident AI
Confident AI is an AI quality platform built for enterprise teams to standardize evaluations and observability across the organization. It provides tracing across LLM calls, agents, tools, and retrieval steps, alongside online evaluations and signals that monitor quality on real production traffic.
Unlike tools focused on a single product team, Confident AI lets platform teams define a consistent quality and security standard that applies across different teams, models, frameworks, and use cases. The same standard can be enforced before deployment and continuously in production through AI governance and native red teaming.
Pros
-
Enterprise-wide standardization for evaluations and observability
-
Full tracing for LLM, RAG, and agent workflows
-
Online evaluations and signals on production traffic
-
Native red teaming and vulnerability monitoring
-
AI governance across pre-deployment and production
-
Vendor- and stack-agnostic
Cons
-
More extensive than smaller teams may need
-
Best suited to organizations managing multiple AI teams or use cases
-
Observability pricing is based on GB-month data usage, which can make costs less predictable
Best for
Enterprises that need to standardize and govern how AI applications are evaluated, monitored, and secured across the organization.
Pricing
Free plan available. Paid plans scale with usage, with custom Enterprise and self-hosted options.
3. Datadog
Datadog has expanded its infrastructure observability platform to include LLM monitoring features. It records traces for calls to providers like OpenAI and Anthropic and links them directly with existing APM and infrastructure metrics.
Pros
-
Single platform for both infrastructure and LLM observability
-
Seamless fit for teams already using Datadog
-
Advanced alerting, dashboards, and anomaly detection
Cons
-
Higher cost than purpose-built LLM monitoring solutions
-
Minimal support for AI quality evaluations
-
LLM tooling feels added on rather than core
-
Excessive complexity for teams focused mainly on AI workloads
Best for
Large organizations already standardized on Datadog that want basic LLM visibility without introducing a new observability tool.
Pricing
Includes a free tier with 1-day metric retention and up to five hosts. Paid plans start at $15 per host per month.
4. Langfuse
Langfuse is an open-source platform focused on LLM observability, providing detailed logging for traces and user sessions. It supports hierarchical tracing for chains and agent workflows, organizes interactions into sessions, and keeps track of prompt iterations over time.
Pros
-
Open-source with the option to self-host
-
Session-based views that tie related LLM requests together
-
Strong observability for multi-step chains and agent workflows
-
Prompt version history linked directly to execution traces
Cons
-
Most frameworks require manual setup and instrumentation
-
Few built-in templates for automated quality evaluation
-
Interface can become noisy when handling high trace volumes
Best for
Teams that prioritize data ownership and want a self-managed LLM observability stack.
Pricing
Self-hosted version is free. Managed cloud plans start at $29 per month with usage-based pricing.
Read our comparison of Langfuse vs. LangWatch.
How to choose the right LLM monitoring tool
Pick a platform that fits your stage, risk profile, and team setup.
For early-stage products
If you just need quick visibility, open-source Langfuse or LangWatch’s free tier are the fastest ways to get started. As soon as cost control and output quality start to matter, which happens very early in real production, teams typically graduate to LangWatch, where evaluations, tracing, and experimentation live in one place.
For quality-critical applications
LangWatch is built specifically for teams where output quality is non-negotiable. It combines continuous AI evaluations with deep production observability and experimentation workflows. Confident AI is a strong fit when an enterprise needs to enforce one evaluation and security standard, including red teaming, across many product teams at once.
For teams with existing monitoring stacks
Langfuse is a solid option if you want open-source tooling and full self-hosting control. Datadog makes sense if you’re already deeply invested in their infrastructure monitoring. That said, both lack the tightly integrated evaluation and experimentation workflows that make LangWatch more effective for LLM-native development.
For cost-sensitive deployments
Fine-grained token tracking and cost attribution are essential. LangWatch provides per-request cost visibility, tagging, and alerts that help teams understand why costs increase not just that they did. Langfuse tracks spend, but without the evaluation context needed to drive real optimization. Datadog adds additional platform costs on top of LLM usage.
For complex multi-agent systems
Multi-step chains and agent workflows demand full trace visibility. LangWatch renders multi-agent runs as topology and sequence-diagram views with per-agent cost, so agent-to-agent handoffs and unexpected tool-call patterns are obvious, then runs evaluations on specific steps to surface where quality breaks down. Langfuse captures traces but lacks built-in evaluation.
For enterprise teams
Security, compliance, and data residency matter. Langfuse supports self-hosting, and Confident AI adds organization-wide governance and native red teaming across pre-deployment and production. LangWatch offers enterprise plans with ISO 27001, GDPR, SSO/SCIM, RBAC, and audit logging, and self-hosts on any plan (Docker, Kubernetes, VPC, or hybrid) with EU data residency. LangWatch combines self-hosting and EU residency with the evaluation layer Langfuse lacks, which is why banks and payment companies run it in production.
For teams shipping fast
LangWatch reduces tool sprawl by unifying monitoring, evaluation, and experimentation. Engineers debug faster because traces, evaluation scores, and prompt versions are visible in one workflow. This is significantly more efficient than stitching together separate logging, evaluation, and experimentation tools.
If you’re running production LLM systems and need more than basic logging, LangWatch offers the most complete approach.
Try LangWatch for free and see how production observability, evaluation, and experimentation work together in practice.
LLM monitoring best practices
Log everything
Capture inputs, outputs, metadata, user identifiers, and timestamps for every request. Storage is cheap; missing data during incidents is not.
Define cost budgets early
Set alerts when token usage crosses 50%, 80%, and 100% of budget thresholds. One runaway prompt can burn thousands overnight.
Automate quality checks
Manual review doesn’t scale. Use automated evaluators to flag risky or low-quality outputs and review only what matters.
Track token efficiency
Rising average token counts usually indicate prompt bloat or unnecessary context. Monitor trends and optimize aggressively.
Version prompts
Every trace should link to a prompt version. When quality drops, you need to know exactly which change caused it.
Decouple logging and evaluation
Log synchronously, evaluate asynchronously. Don’t block user requests to run scorers - batch evaluation keeps systems fast.
Observe full pipelines
Failures often happen outside the LLM call itself. Trace retrieval, tool calls, and post-processing to find real bottlenecks.
Use sampling at scale
For high-volume systems, sample 10 - 20% of requests for full traces while logging basic metrics for all traffic.
Enable anomaly detection
Alert on unusual patterns like sudden cost spikes, latency jumps, or error-rate changes - before users report issues.
Evaluate on production data
Staging environments miss real-world edge cases. Production traffic reveals what test suites can’t.
Set quality baselines
Track stable-period scores and alert on deviations. Even small drops can signal serious regressions.
Review costs weekly
Weekly spend reviews catch gradual increases early. Investigate any sustained growth over ~20%.
Why LangWatch stands out for LLM monitoring
Most tools force teams to choose between basic logging or assembling multiple platforms. LangWatch delivers monitoring, evaluation, and experimentation in a single system, eliminating context switching and data sync headaches.
This unified approach helps teams detect quality regressions earlier, identify cost optimizations faster, and debug complex agent behavior without jumping between dashboards.
For teams serious about building reliable, cost-efficient AI systems in production, LangWatch offers the most purpose-built solution.
Put this into production with LangWatch.
Trace your agents, run evaluations, and turn failures into repeatable tests.
Frequently asked questions
- What are the best LLM monitoring tools in 2026?
- Top choices include LangWatch for all-in-one monitoring, evaluation, and agent testing, Confident AI for enterprise-wide evals and governance, Datadog for cross-stack infrastructure monitoring, and Langfuse for open-source self-hosting.
- Why does monitoring LLM applications matter?
- LLM monitoring tackles cost control, quality assurance, and performance debugging by tracing prompts, responses, token usage, latency, and costs so teams catch regressions before they become customer-facing incidents.
- What is the difference between monitoring and observability?
- Monitoring tracks known metrics like cost, latency, and error rate, while observability lets you explore unknown failures through detailed traces. LangWatch provides real-time observability with full pipeline visibility across multi-step agent runs.
- What makes LangWatch stand out for LLM monitoring?
- LangWatch pairs OpenTelemetry-native agent tracing (waterfall, flame, topology, and sequence-diagram views) with online and offline evaluations on the same data, so monitoring feeds a proof loop instead of ending at a dashboard. It is open source under Apache-2.0 and self-hostable with EU data residency.
- Is LangWatch open source and self-hostable?
- Yes. LangWatch is open source under Apache-2.0 and self-hosts on any plan via Docker, Kubernetes, VPC, or hybrid, with EU, US, UK, and APAC cloud options and EU data residency.