When to use experiments
- Check that a prompt change does not regress quality before you deploy it.
- Compare two prompts, two models or two agent configurations on the same dataset.
- Gate a deployment on a quality threshold from your CI pipeline.
- Test an evaluator itself against a dataset with known answers before you use it in production.
Create an experiment
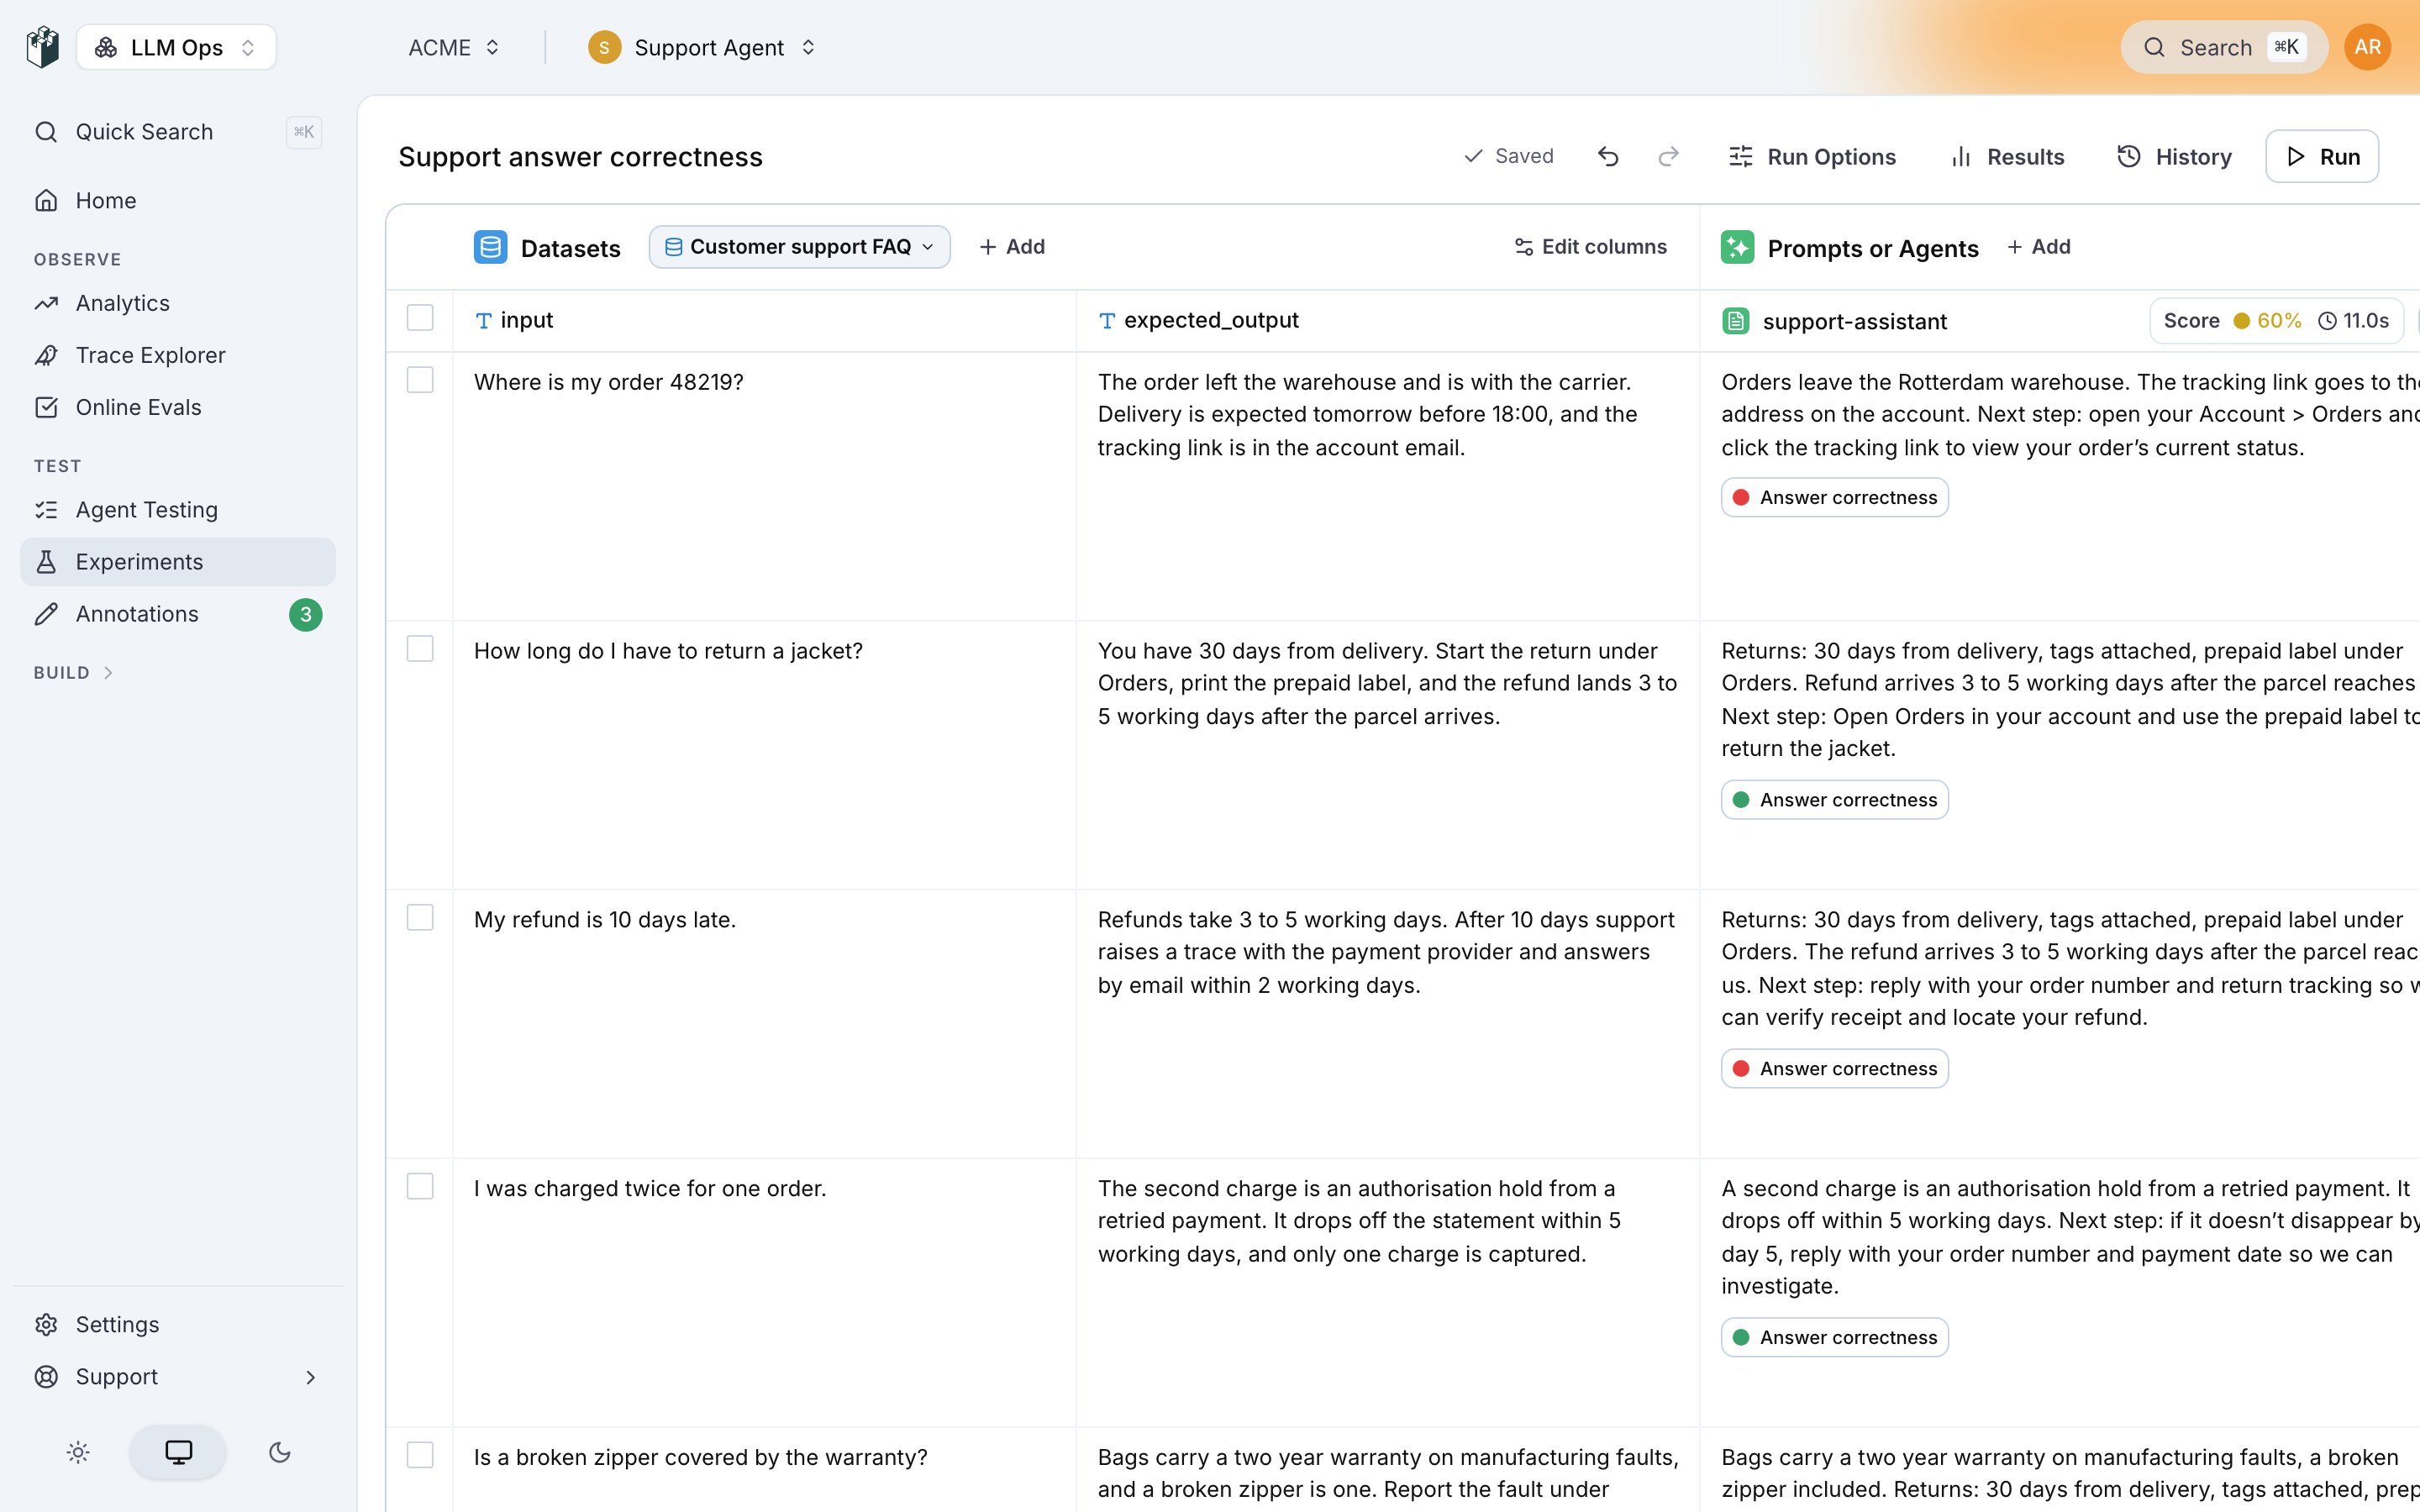
- Open Experiments and click New Experiment, then Create Experiment. The workbench opens with a generated name. Click the name to rename it.
- Under Datasets, click Add and pick Select existing dataset, Upload CSV or Create new. You can edit cells inline. A dataset created inside the workbench stays there until you pick Save as dataset from its tab menu.
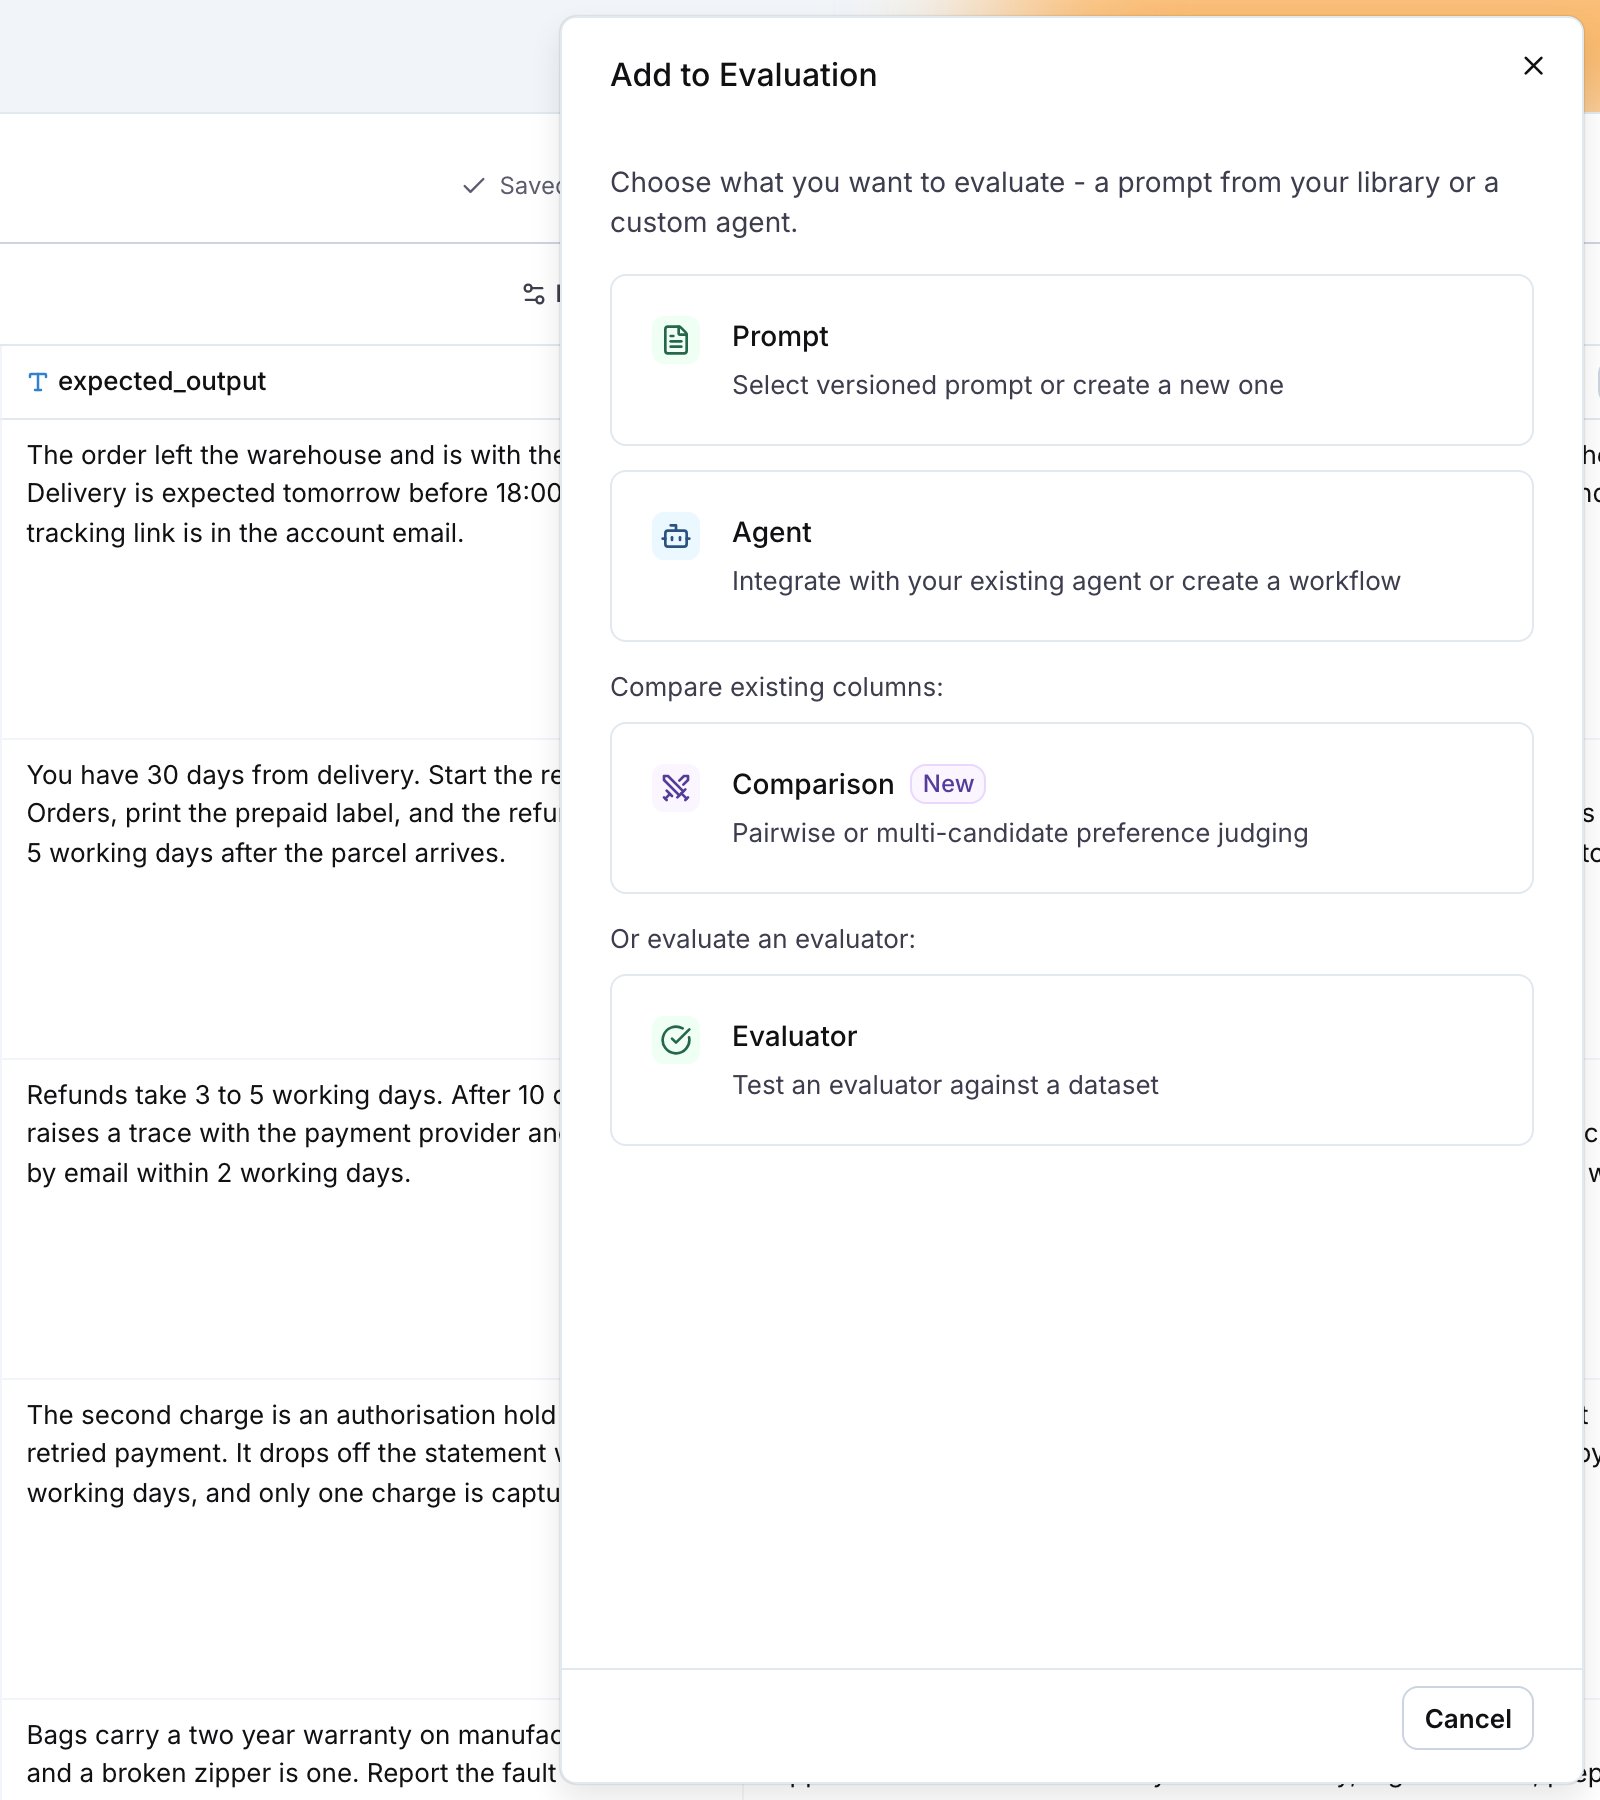
- Under Prompts or Agents, click Add. The Add to Evaluation drawer offers four columns: Prompt, Agent, Comparison and Evaluator.
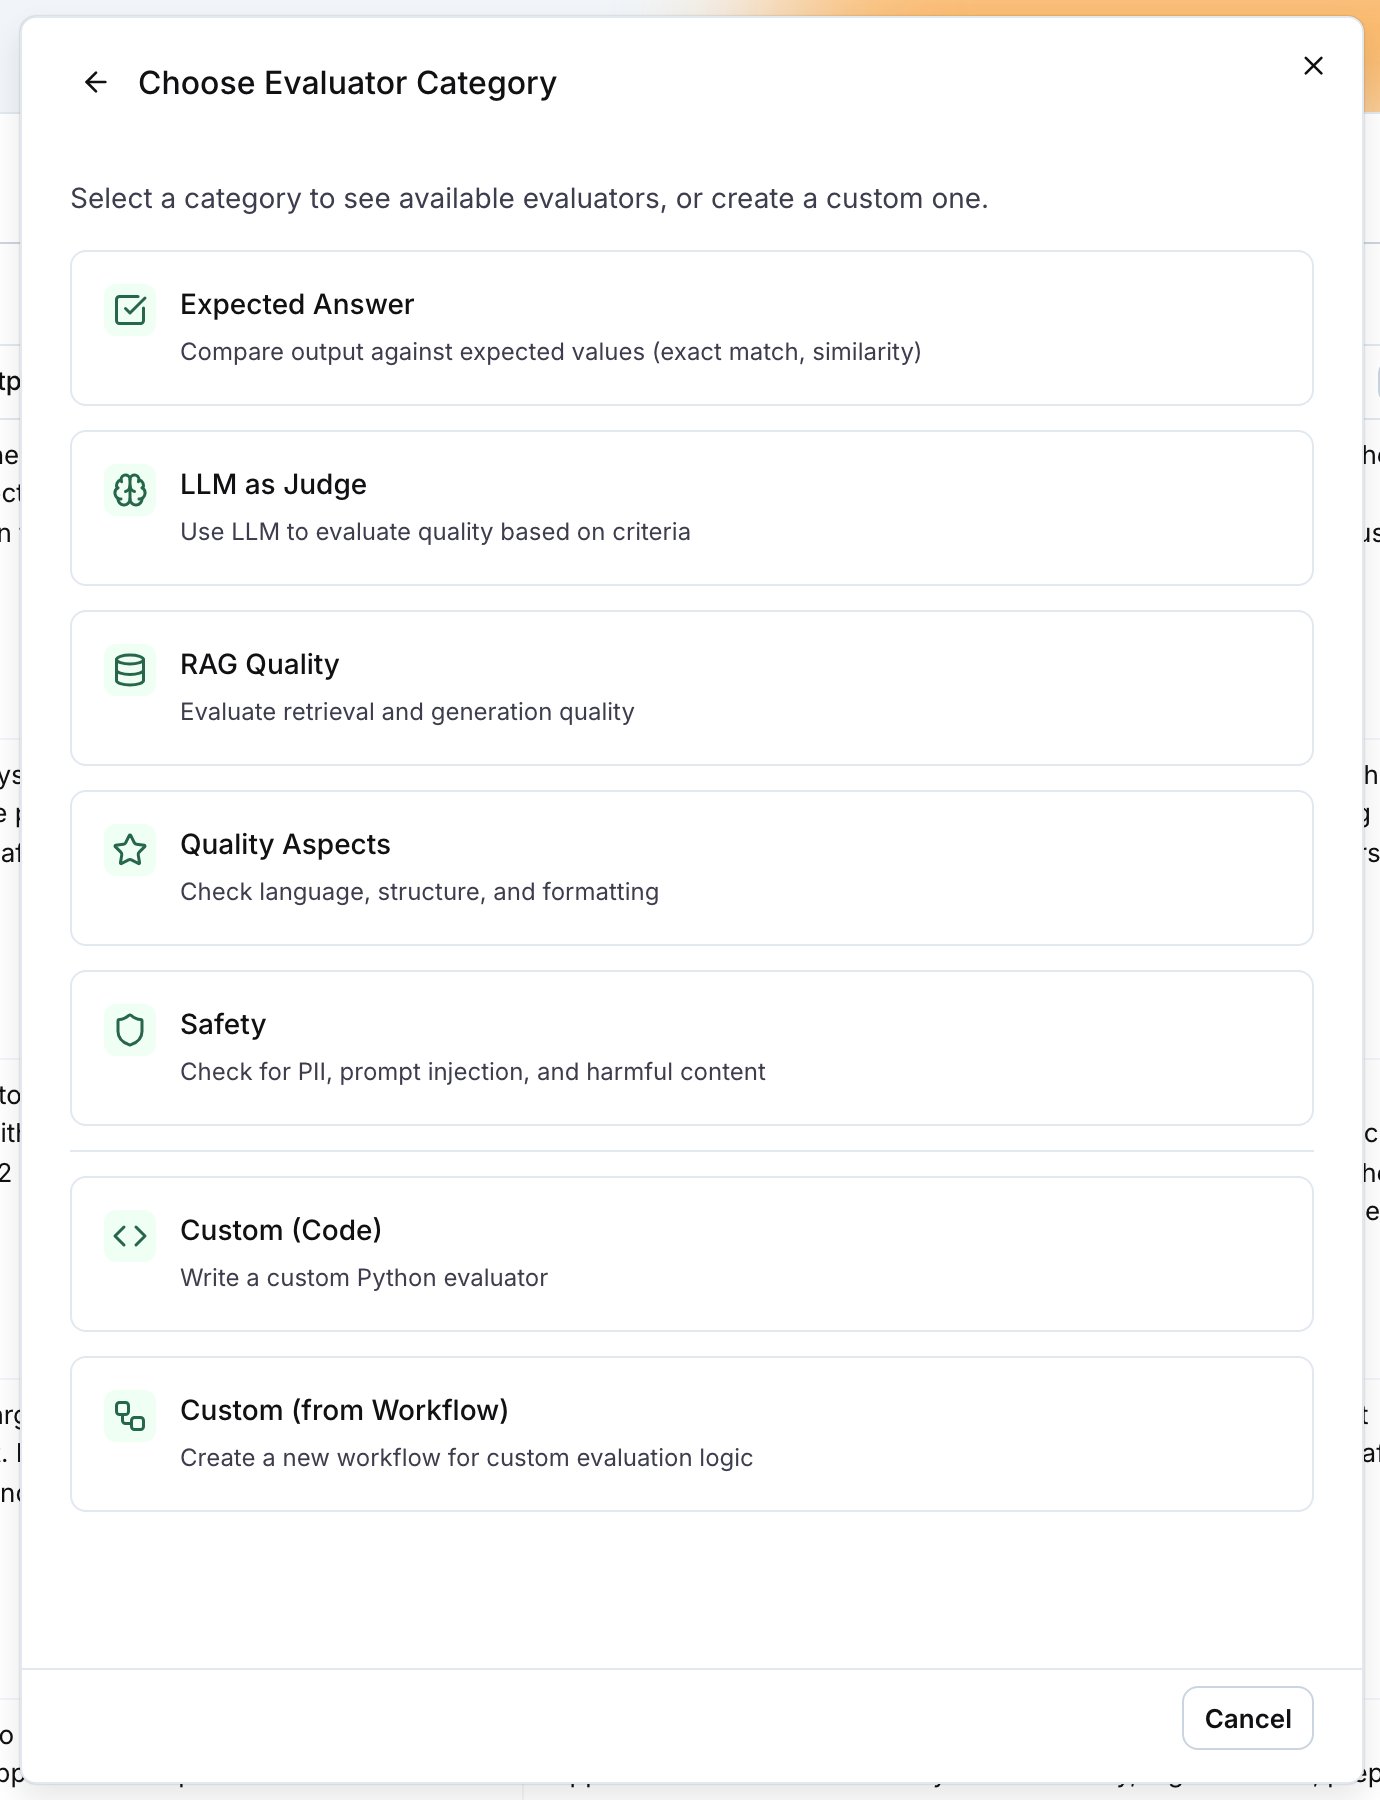
- On a prompt or agent column, click Add evaluator and pick a saved evaluator, or create one from the evaluator categories: Expected Answer, LLM as Judge, RAG Quality, Quality Aspects, Safety, Custom (Code) and Custom (from Workflow).
The workbench autosaves. History lists the saved versions, and Restore writes an old setup forward as a new version.
Map evaluator inputs
Every evaluator declares the fields it reads, for exampleinput, output, expected_output or contexts. The Variables section of the evaluator editor maps each field to a source: the output of the column it is attached to, or a dataset column.
LangWatch fills the mapping for you when the names match. A dataset column named expected_output, expected_answer or ground_truth maps to the evaluator’s expected_output field; the column output maps to output. A field that stays unmapped shows Required, and the run button reads Configure missing mappings first until you map it.
Run
Run in the header runs every column on every row. The play button on a column header runs that column only, the button on a cell runs one row, and the toolbar that appears when you select rows runs the selection. While a run is in progress the button reads Stop. Run Options sets the concurrency and the row height, and Automation shows the request that triggers this experiment from a pipeline. See Run experiments from CI/CD.Read the results
Each cell shows the column output, and each evaluator chip shows its verdict. Click a chip to open its Result block with the status, the score or the label when the evaluator returns one, and the details, for example the reason an LLM judge gave. The same popover has Rerun, Run on all rows and Edit Configuration. The column header shows the pass rate for the column. Hover over it to open the summary: Rows, Pass Rate, Avg Latency, Total Cost, Execution Time, and one line per evaluator with its pass rate or average score.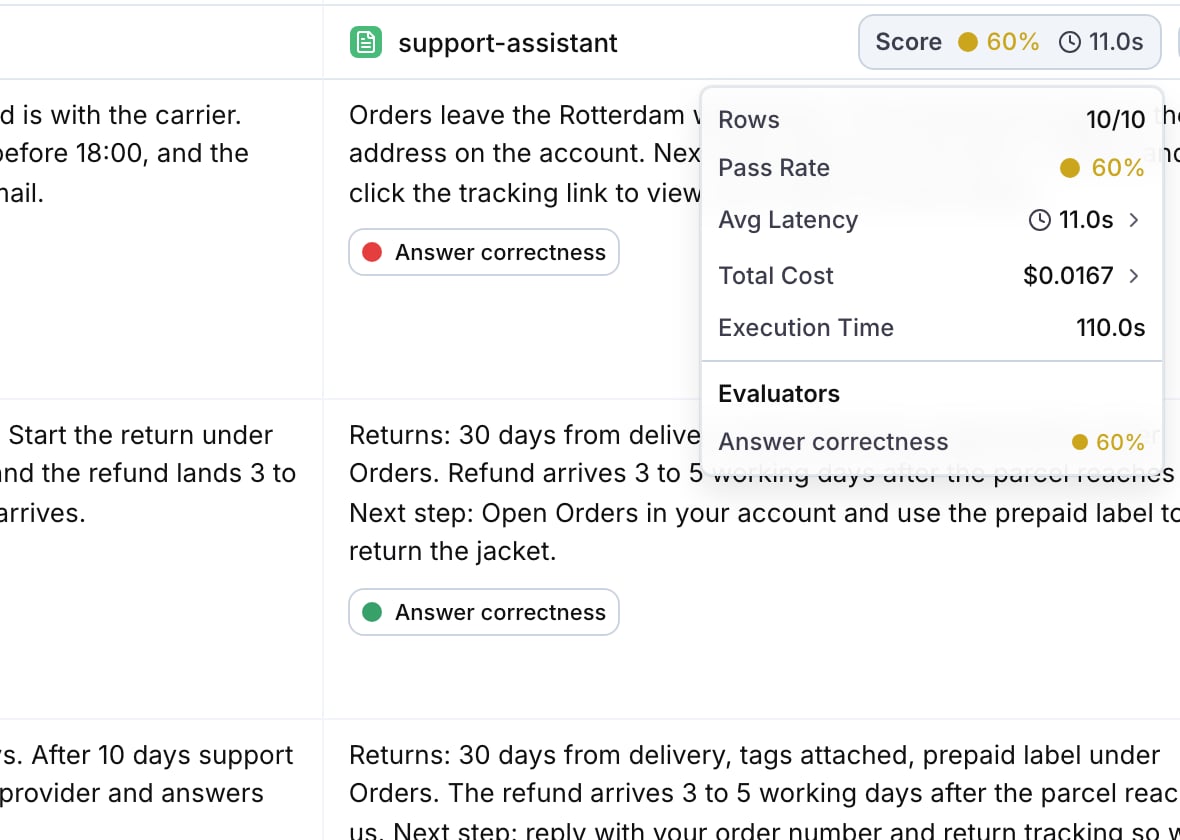
Compare runs
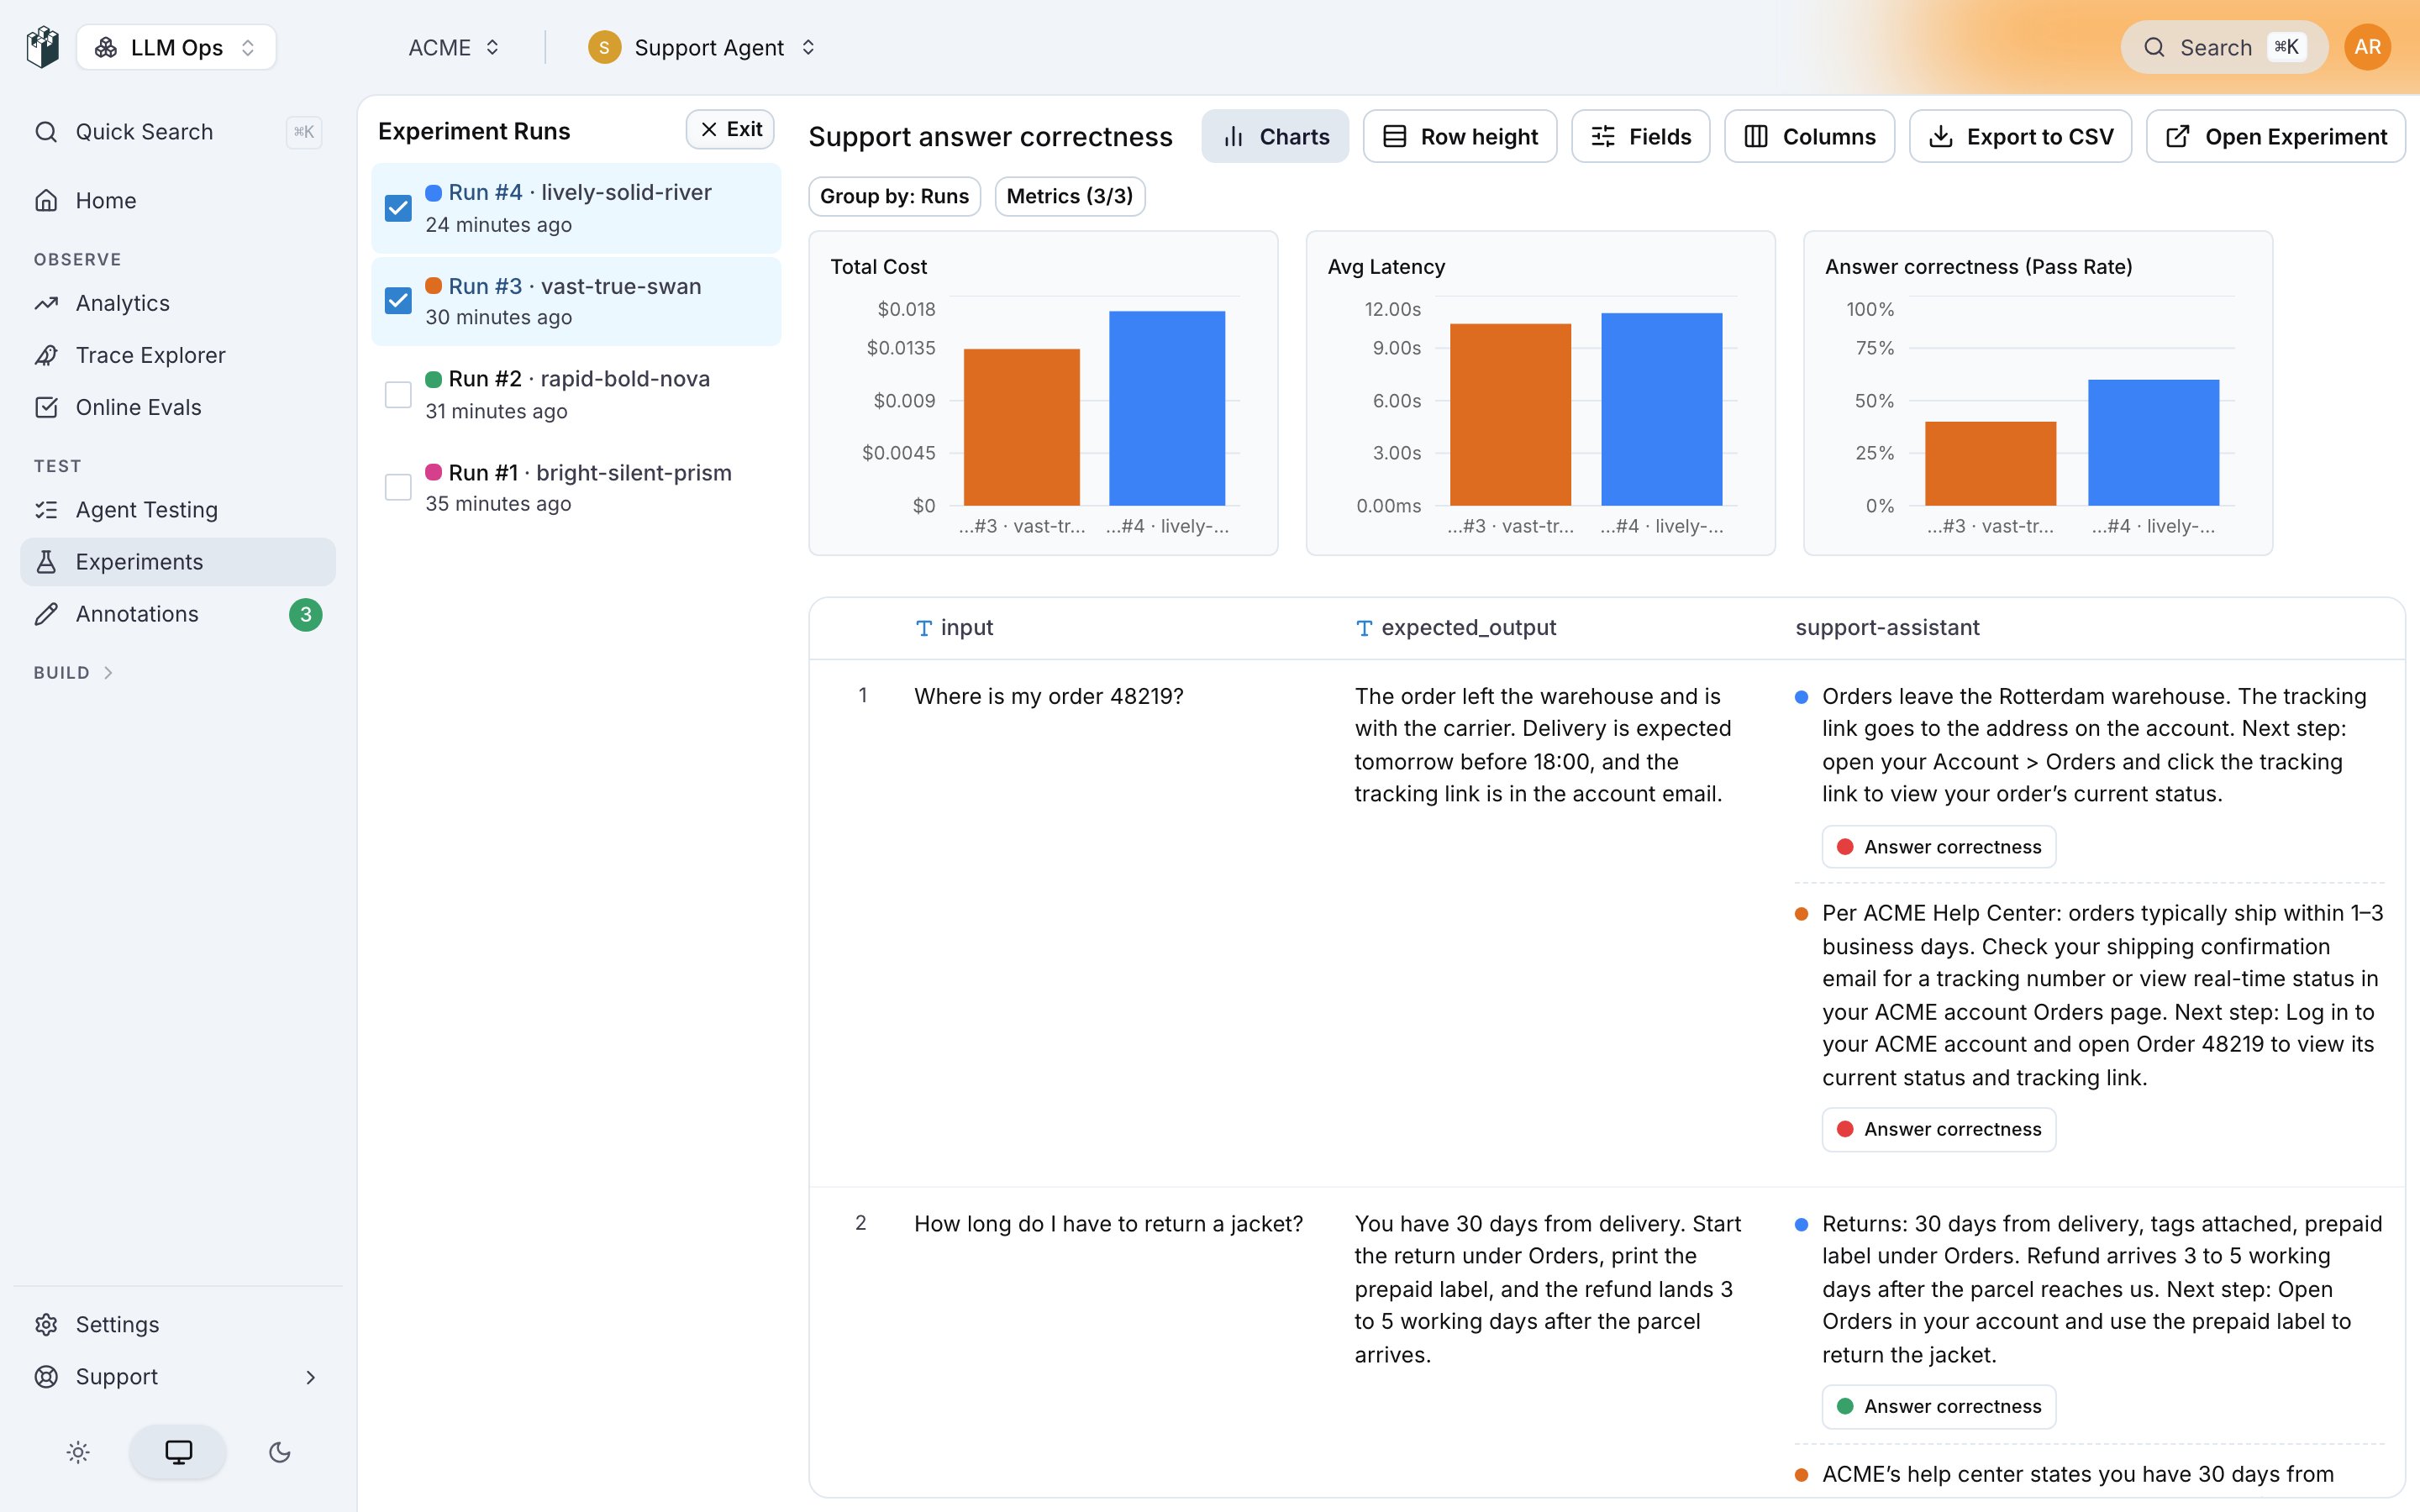
Results in the header opens the results page for the experiment. The Experiment Runs sidebar lists every run, newest first. Tick two runs to see them side by side: one chart per metric (cost, latency, and the pass rate of each evaluator) and, per row, both outputs with their evaluator chips, so you can check that a change fixed the failing rows without breaking the passing ones.