

Quickstart
1. Install the SDK
- Python
- TypeScript
2. Set your API Key
- Python (Notebook)
- Environment Variable
3. Start tracking
- Python
- TypeScript
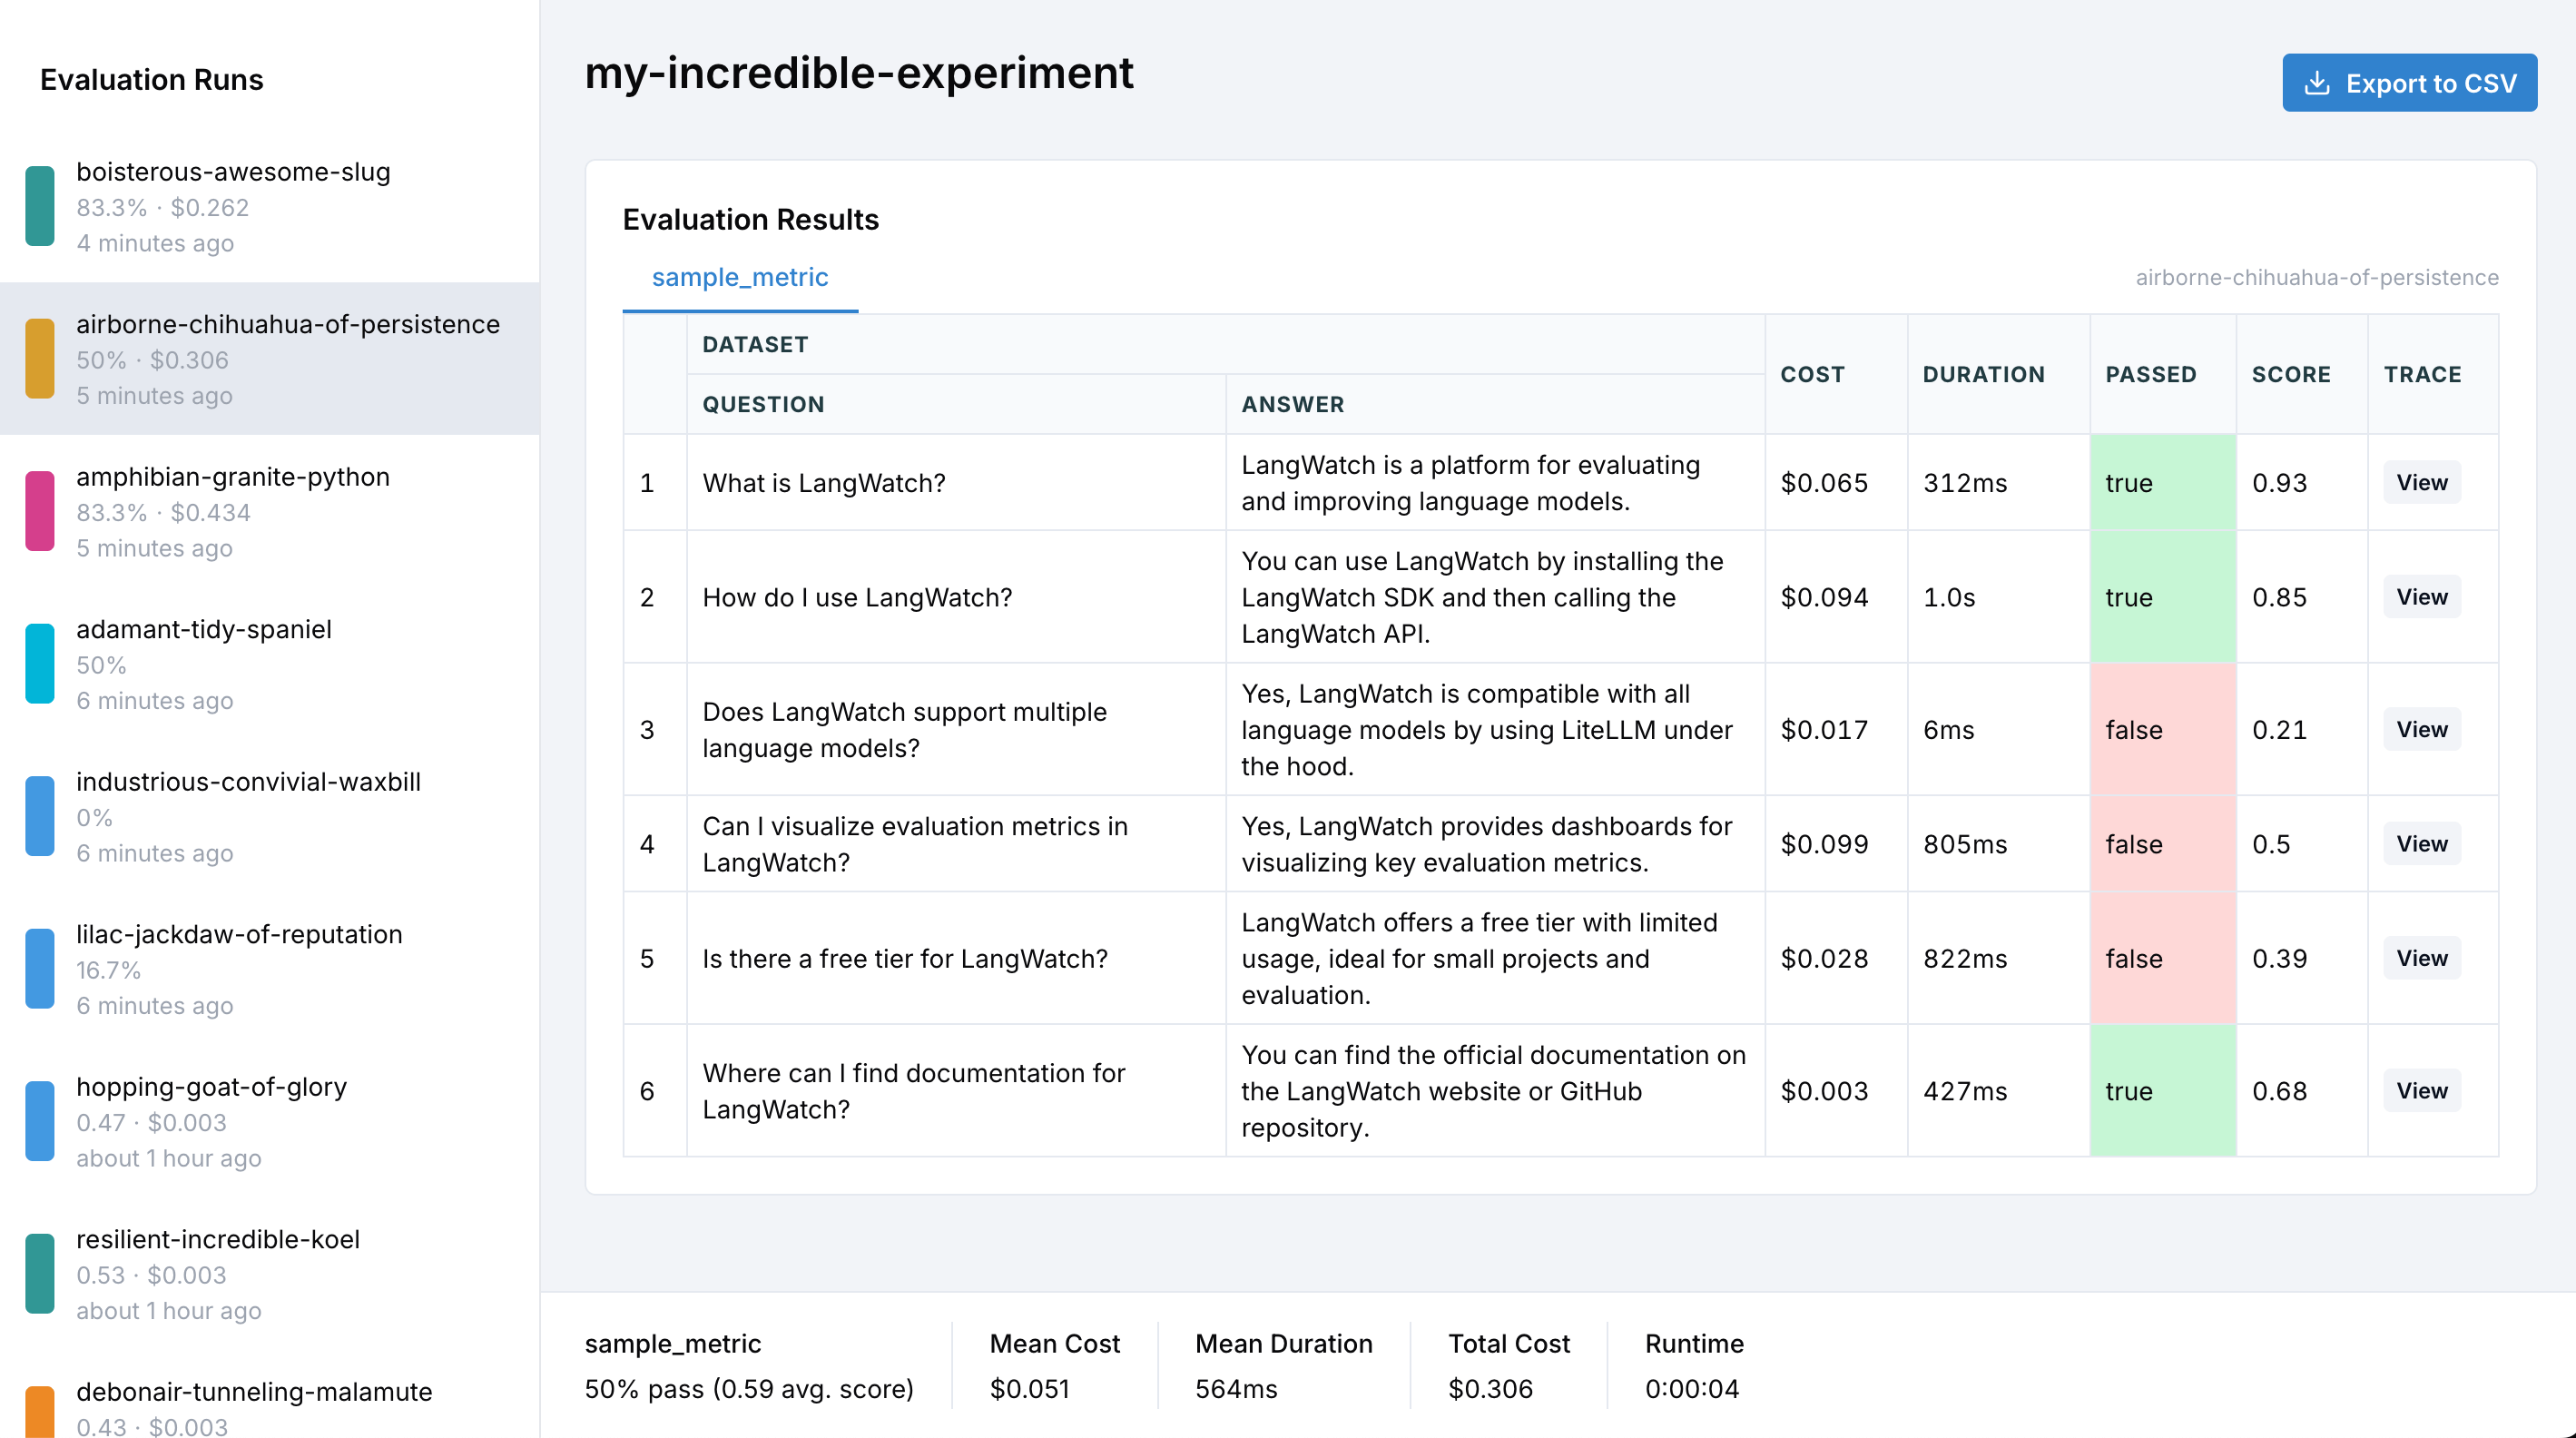
Core Concepts
Evaluation Initialization
The evaluation is started by creating an evaluation session with a descriptive name:- Python
- TypeScript
Iterating over data
- Python
- TypeScript
Use
evaluation.loop() around your iterator so the entries are tracked:Metrics logging
Track any metric you want withevaluation.log():
- Python
- TypeScript
Comparing Multiple Targets
When comparing different models, prompts, or configurations, use targets to organize your results. Both SDKs provide atarget(), withTarget() context that automatically captures latency and enables context inference.
Once a row’s targets have each produced an output, Comparison judges them against each other and names a winner.
- Python
- TypeScript
Use Alternatively, use the
evaluation.target() for automatic latency capture and context inference:evaluation.target() automatically captures latency, creates isolated traces per target, and enables context inference so log() calls don’t need explicit target parameters. Use log_response() to store the model’s output.target parameter directly with evaluation.log():Target Registration
The first time you use a target name, it’s automatically registered with the provided metadata:- Python
- TypeScript
Metadata for Comparison
Target metadata is used for comparison charts in the LangWatch UI. You can group results by any metadata field:- Python
- TypeScript
Parallel Execution
LLM calls can be slow. Both SDKs support parallel execution to speed up your evaluations.- Python
- TypeScript
Use the built-in parallelization by putting the content of the loop in a function and submitting it:Sync callables passed to
By default,
threads=4. Adjust based on your API rate limits and system resources.Async-native mode
The defaultloop(), submit() path above already parallelises, each submitted task runs in a worker thread, so sync and async tasks both speed up with no extra work on your side. That’s the right choice for most users.Reach for aloop(), asubmit() only when your code is fully async-first and your task relies on async state whose identity is tied to one event loop. The threading path spins up a fresh event loop per worker, so those objects raise "Future attached to a different loop" on first use. aloop, asubmit keep every submitted task on the caller’s event loop, so that state stays valid across concurrent items.asubmit are automatically offloaded to a worker thread so they don’t block the event loop for concurrent async siblings.Built-in Evaluators
LangWatch provides a library of evaluation metrics out of the box.- Python
- TypeScript
Use
evaluation.evaluate() with pre-built evaluators:Browse our complete list of available evaluators including metrics for RAG quality, hallucination detection, safety, and more.
Comparison
Scoring each target on its own leaves you calibrating numbers: is0.78 better than 0.74 for your users, or is that noise? Comparison asks the easier question instead. It shows a judge every target output for the same row and asks which one is best.
compare() is the code-first way in. It uses the same judge as the Comparison evaluator in the workbench, so a comparison you run from a notebook and one you set up in the UI read the same way on the results page.
Comparing a row
Every target that produced a non-empty output for the row is a candidate, and one comparison weighs all of them together rather than a round of one-against-one matchups. Behind it the judge is called twice per row by default, the second time with the candidate order reversed, which is whatswap_and_reconcile does; turn that off and one comparison is one judge call.
There is no candidate list to assemble, and no judge prompt you have to choose, since the shipped one runs unless you write your own:
- Python
- TypeScript
log_response() recorded inside each target() block.compare() judges however many candidates the row has, and a target that produced no output for the row, or only an empty output, is not a candidate.
Compare a row once its targets have finished. In Python that is after the row’s last
target() block has closed, and in TypeScript after its withTarget() calls have settled, which under the usual Promise.all is right after the await.compare() names the row the way log() does in the same SDK. Python is handed the index by loop(), so it passes it on as the first argument, and it needs a whole number. TypeScript infers it from the iteration the comparison runs in, so index is only needed when you compare outside a run() callback, and it is a whole number there too.Candidate order is shuffled per row by default, seeded by the row index, so re-comparing the same row presents the candidates in the same order and a different row shuffles differently. randomize_order / randomizeOrder governs it: turn it off and the judge sees the candidates in the order their targets were registered.Judging against a reference answer
By default the judge compares the candidates on their own merits, with no reference answer involved. Passgolden to have it judge each candidate against a reference instead. That one option is the whole switch, so there is no second flag to forget:
- Python
- TypeScript
Customizing the judge prompt
Leaveprompt unset and the judge picks the shipped prompt matching what the row actually carries: a reference answer, task context, both, or neither. The framing for whatever the row lacks is dropped rather than left empty, which is why the default is worth keeping unless you have a rubric of your own.
When you do have one, pass it and it is used exactly as written. Three placeholders are filled in for you:
- Python
- TypeScript
Only those three placeholders are substituted, and they are substituted literally. Any other braces in your prompt reach the judge as written, so a rubric that says
score out of {10} is passed through unchanged.Options
Every option is optional, because the judge already has a default for each one. An option you do not set is not sent at all, so the judge’s default applies to it.The verdict
A verdict carries four things: thestatus, the winner, the judge’s reasoning, and candidates, the target names it actually judged.
A comparison never raises when a judge fails, and never raises on a row too thin to judge. One unreachable judge in a thousand-row run costs you that row, not the run.
Seeing the results
Verdicts show up on the experiment’s results page:- A Winner column names the winning target on each row, with the judge’s reasoning underneath it, so you can see why a row went the way it did.
- A win-rate chart gives each target its share of the wins, plus a bar for ties. A target that never won a single row is still charted, with zero wins.
A complete comparison
Three variants, one comparison per row, and a closing summary that fails a CI build when the run had failures:- Python
- TypeScript
Comparing from an async loop
- Python
- TypeScript
In async-native mode, use
acompare() so the judge is awaited rather than blocked on, leaving the event loop free for the rows running alongside it. It takes the same options and records the same verdict:Complete Example
- Python
- TypeScript
Tracing Your Pipeline
To get complete visibility into your LLM pipeline, add tracing to your functions:- Python
- TypeScript
Learn more in our Python Integration Guide.
Exporting Results to CSV
After running your evaluations, you can export results to CSV for further analysis in spreadsheet tools like Excel or Google Sheets.How to Export
Click the Export to CSV button in the top-right corner of the evaluation results page to download a complete CSV file with all your data.CSV Structure
The exported CSV organizes the data by dataset rows and targets. Here’s the complete column structure:Row Index
Dataset Columns
All columns from your input dataset are included with their original names.Target Columns (per target)
For each target in your evaluation, the following columns are exported:Evaluator Columns (per target, per evaluator)
For each evaluator applied to a target:Comparison Columns (per comparison)
A comparison grades the row as a whole rather than one target, so it gets its own block of columns after every target block, named after the comparison:
What each verdict writes into those three cells:
An empty winner is never a tie. The three cells go empty together for
error and for a row the comparison never ran on, so tie in the winner column always means the judge saw the candidates and called the row even.
no_verdict is the shared export token for inconclusive and skipped. The two are separate in code, on the verdict.status your call returns, but they are recorded under one status, so a row read back from a completed run cannot be sorted into one or the other and naming either in the export would be a guess.
The reasoning cell explains why no verdict was recorded, either in the judge’s own words or, when the judge itself never answered, in the evaluator’s account of what came back. Keep the two apart by reading verdict.status at the point of comparison.
A row’s candidates can be fewer than the comparison’s full set of targets, because a target that produced no output for that row is left out of the matchup. The winner reads unresolved on the rare row where the judge’s answer matches none of the candidates it was shown, and a winner naming a target the run no longer lists is written under its own name.
Example CSV Output
For an evaluation comparing two targets,gpt-5-mini and claude, with a faithfulness evaluator:
Using the Data
The CSV export supports these analysis workflows:Filter and compare models
Filter and compare models
Use spreadsheet filters to compare specific models or configurations:
- Filter by
{target}_modelto analyze specific model performance - Sort by
{target}_{evaluator}_scoreto find best/worst performing samples - Filter by
{target}_errorto identify failed executions
Analyze costs and latency
Analyze costs and latency
Calculate aggregate metrics across your evaluation:
- Sum
{target}_costcolumns for total evaluation cost per model - Average
{target}_duration_msto compare response times - Identify outliers with high latency or cost
Group by metadata
Group by metadata
Analyze performance across different configurations:
- Pivot tables by temperature, max_tokens, or custom metadata
- Compare prompt versions side-by-side
- Track improvements across iterations
Debug failures
Debug failures
Investigate problematic samples:
- Filter rows where
{target}_erroris not empty - Cross-reference
indexwith the UI for detailed inspection - Click through to traces using
{target}_trace_id
All column headers are normalized to lowercase with spaces replaced by underscores for consistency and compatibility with data analysis tools.
Running in CI/CD
You can run SDK experiments in your CI/CD pipeline. Theprint_summary() method outputs a structured summary and exits with code 1 if any evaluations fail:
What’s Next?
CI/CD Integration
Run experiments in your CI/CD pipeline
View Evaluators
Explore all available evaluation metrics
Datasets
Learn about dataset management
View Examples
Check out example notebooks