

Prerequisites
- A dataset with an
inputcolumn and anexpected_outputcolumn. Create one from a CSV on the Datasets page, or create it inside the workbench in step 2. See Datasets. - A model provider configured in Settings, so the prompt column and the LLM Answer Match evaluator can call a model.
Steps
1
Create the experiment
Open Experiments, click New Experiment, then Create Experiment. The workbench opens. Click the generated name in the header and rename it, for example
Support answer correctness.2
Add the dataset
Under Datasets, click Add and pick Select existing dataset. To start from a file instead, pick Upload CSV. To type the rows in, pick Create new and add the 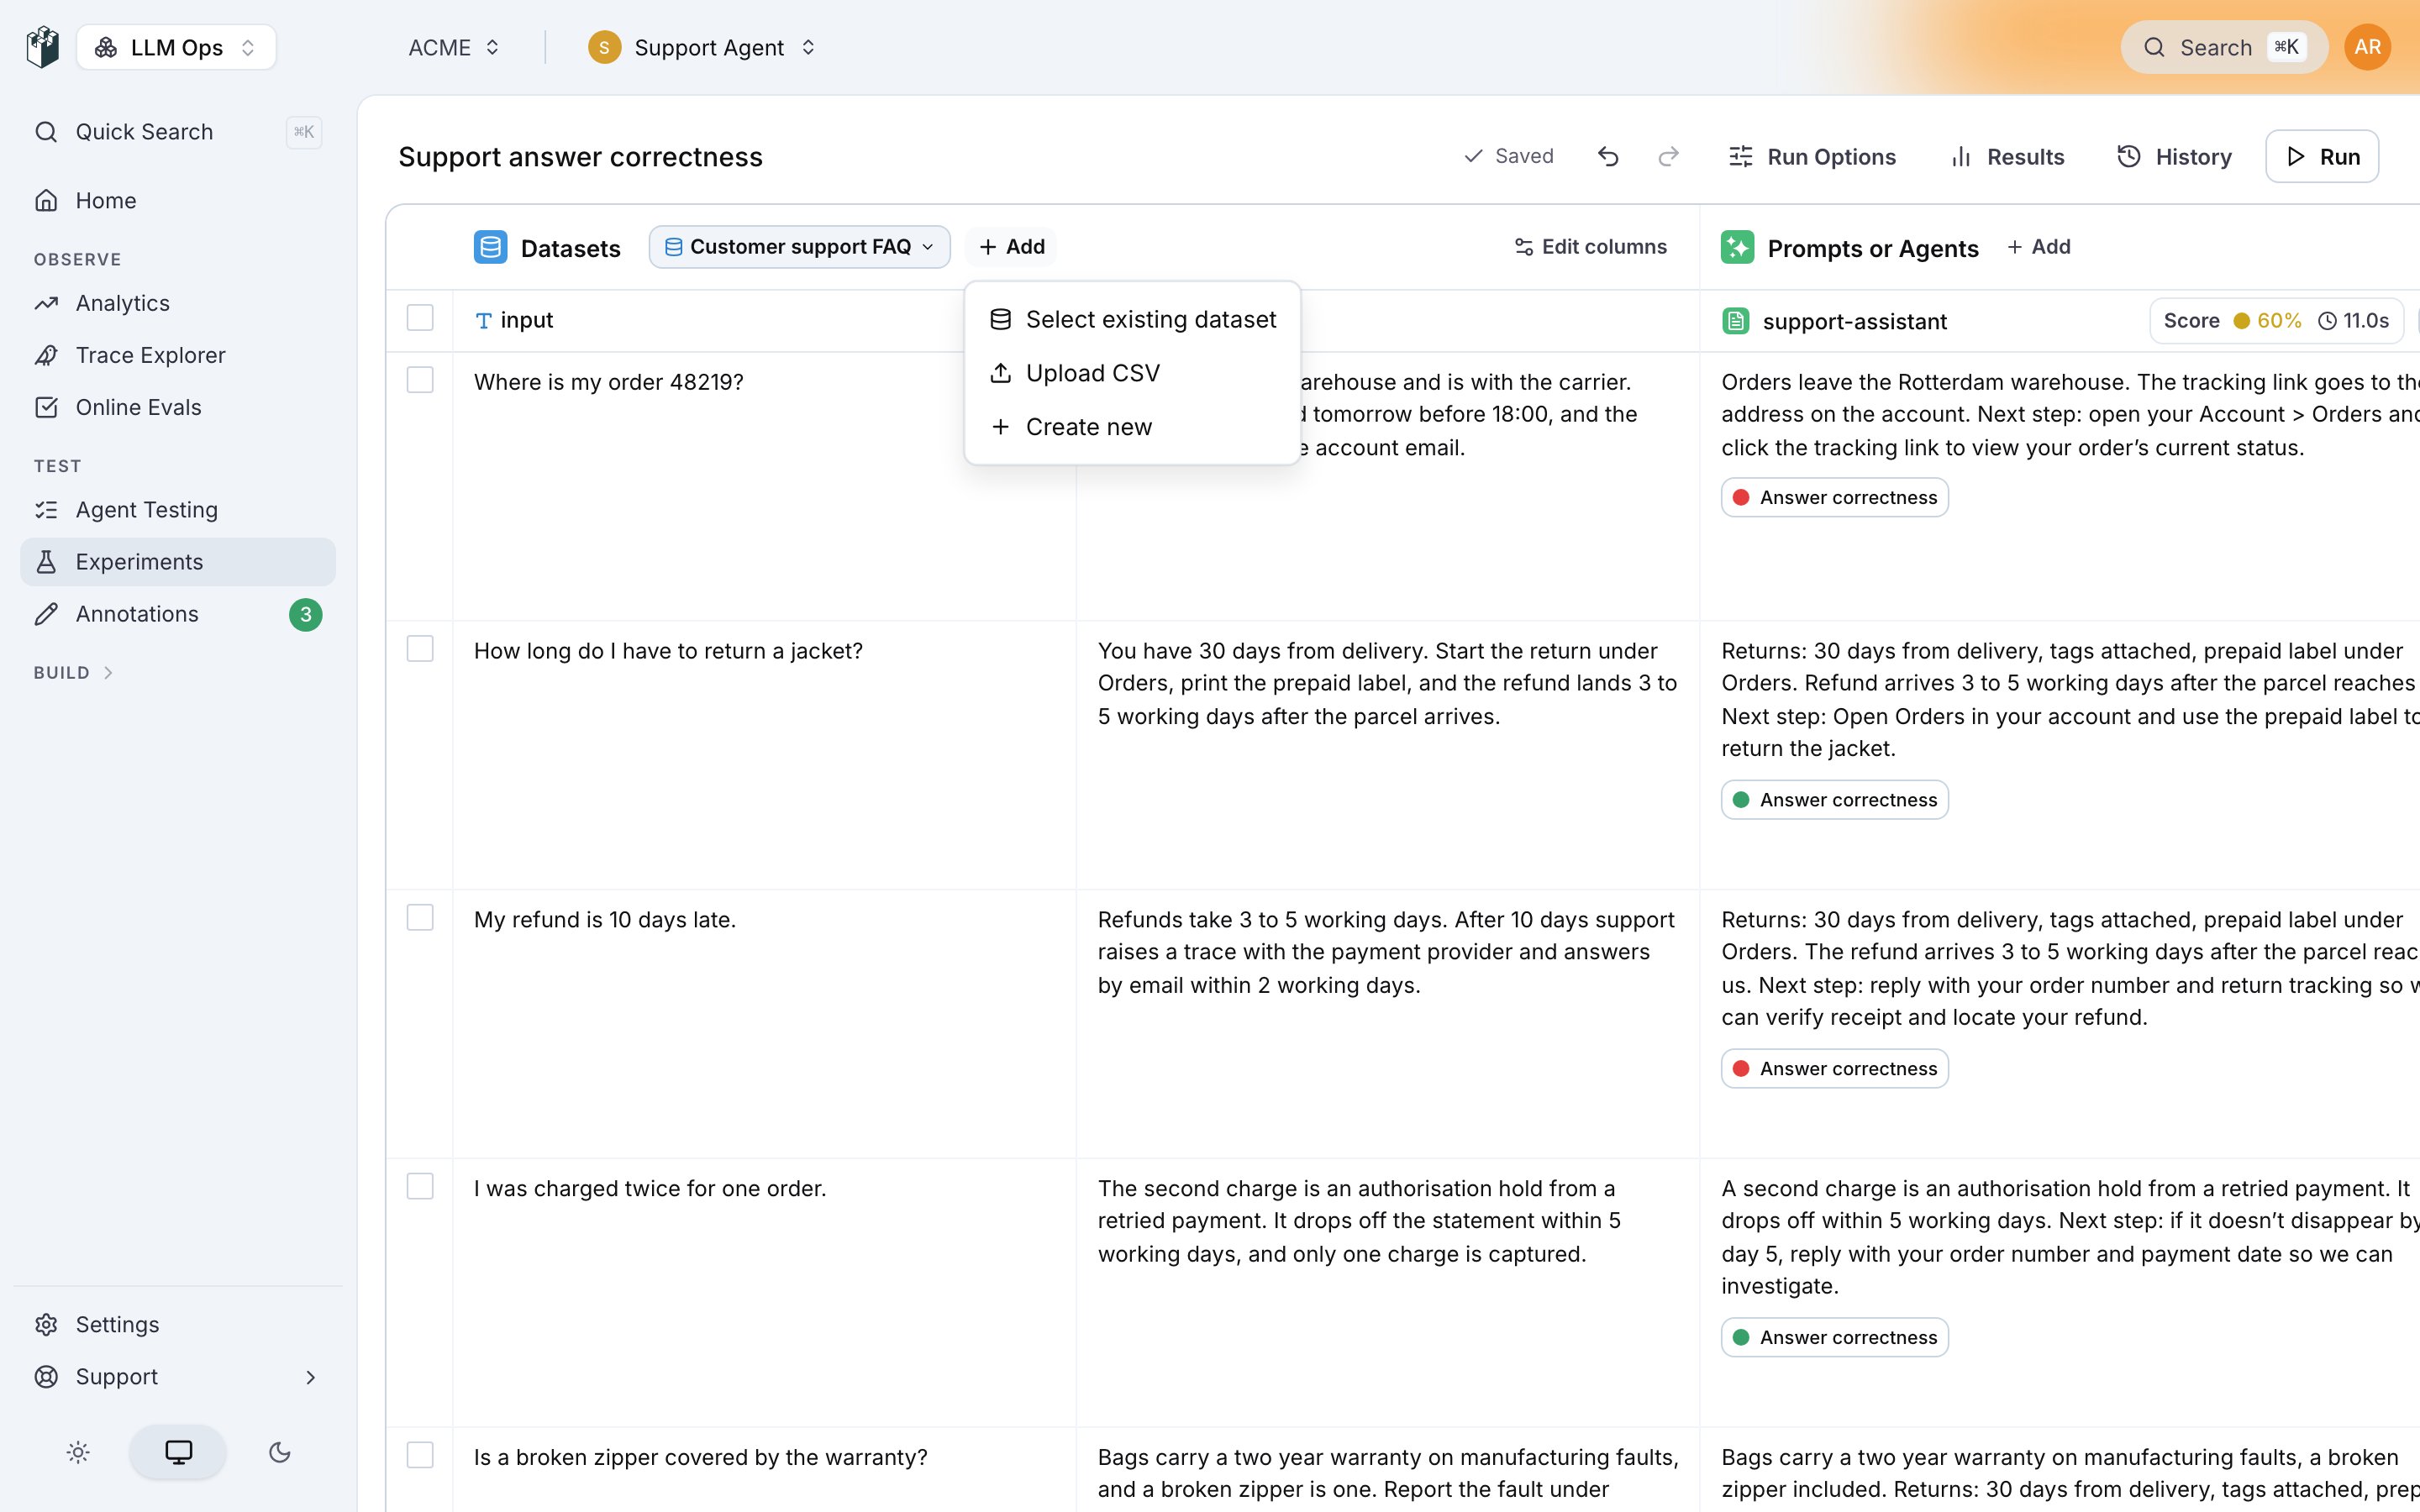
input and expected_output columns.3
Add a prompt column
Under Prompts or Agents, click Add and pick Prompt, then New Prompt. In the editor, pick the model and write the system prompt. For example:In the Variables section, check that 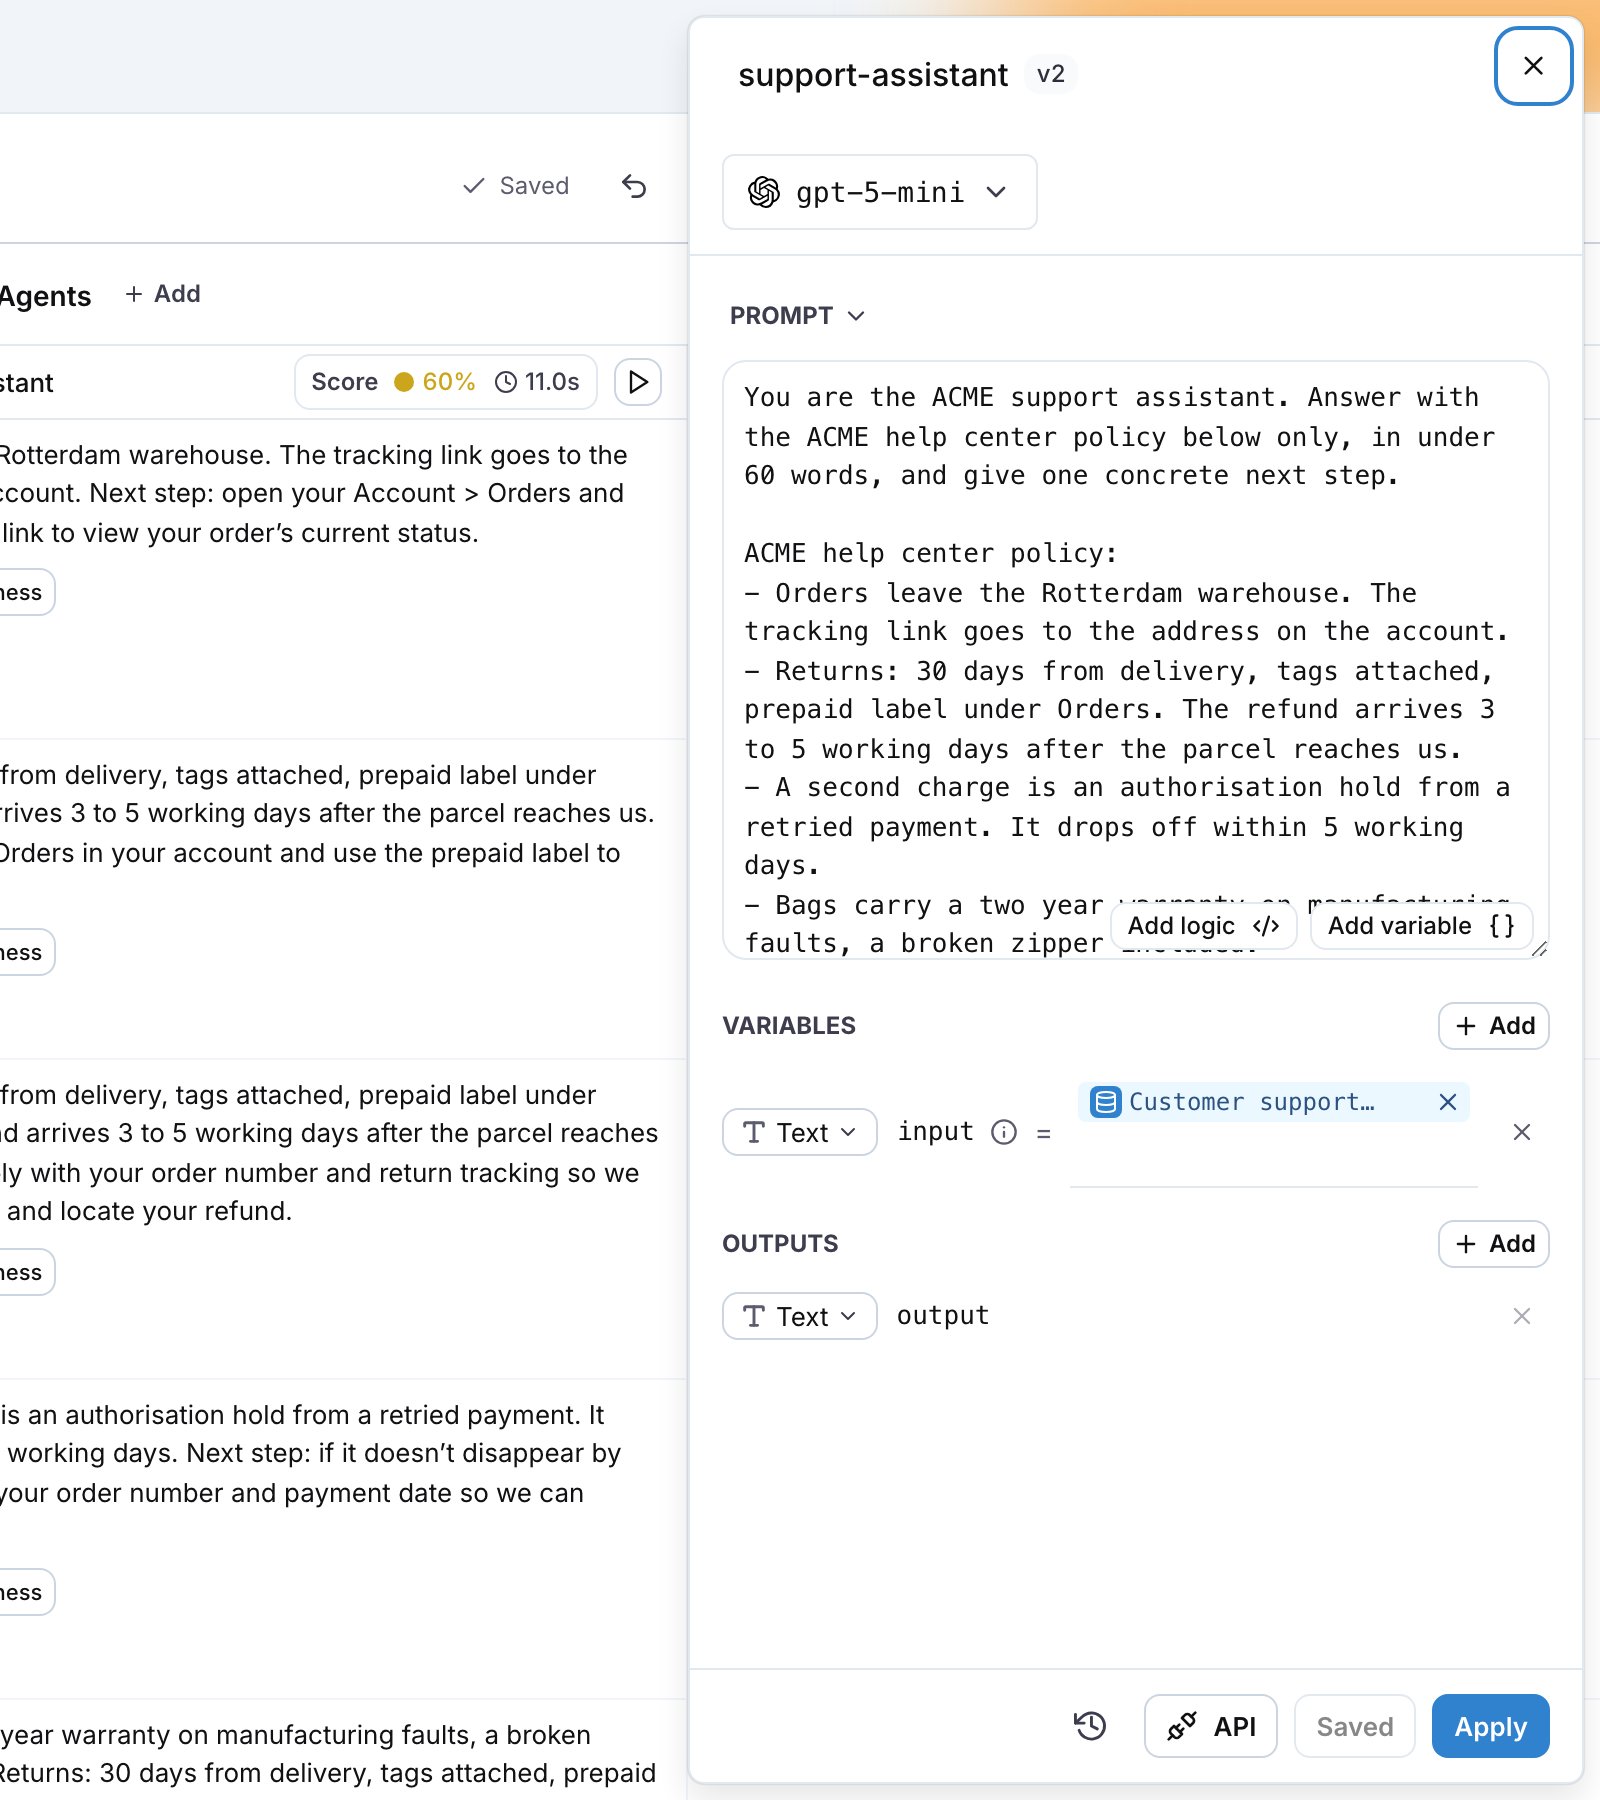
input maps to the dataset’s input column, so each row’s question reaches the model. Click Apply.4
Add the evaluator
On the prompt column, click Add evaluator, then New Evaluator. Pick the Expected Answer category.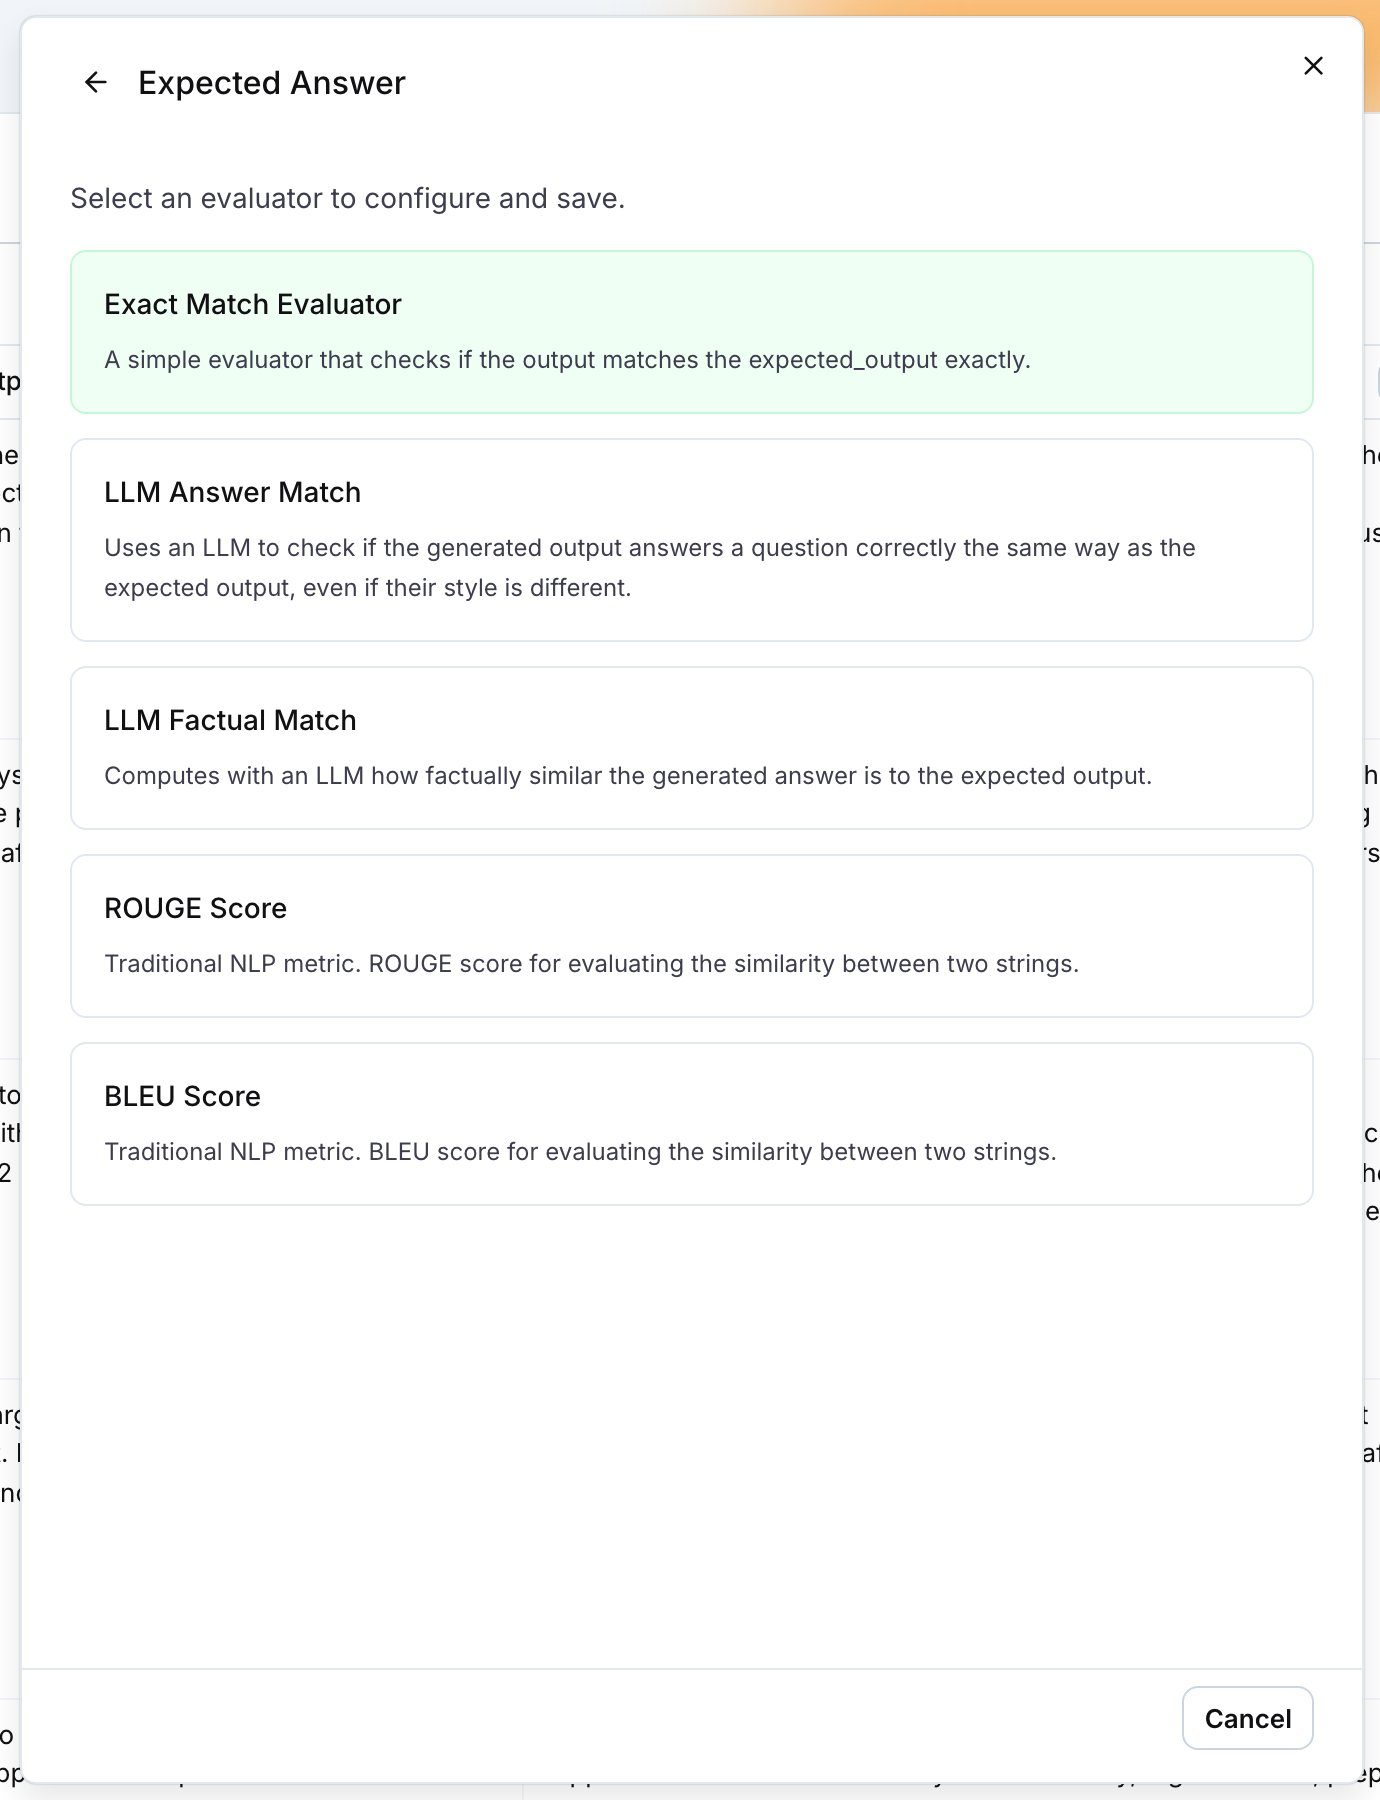
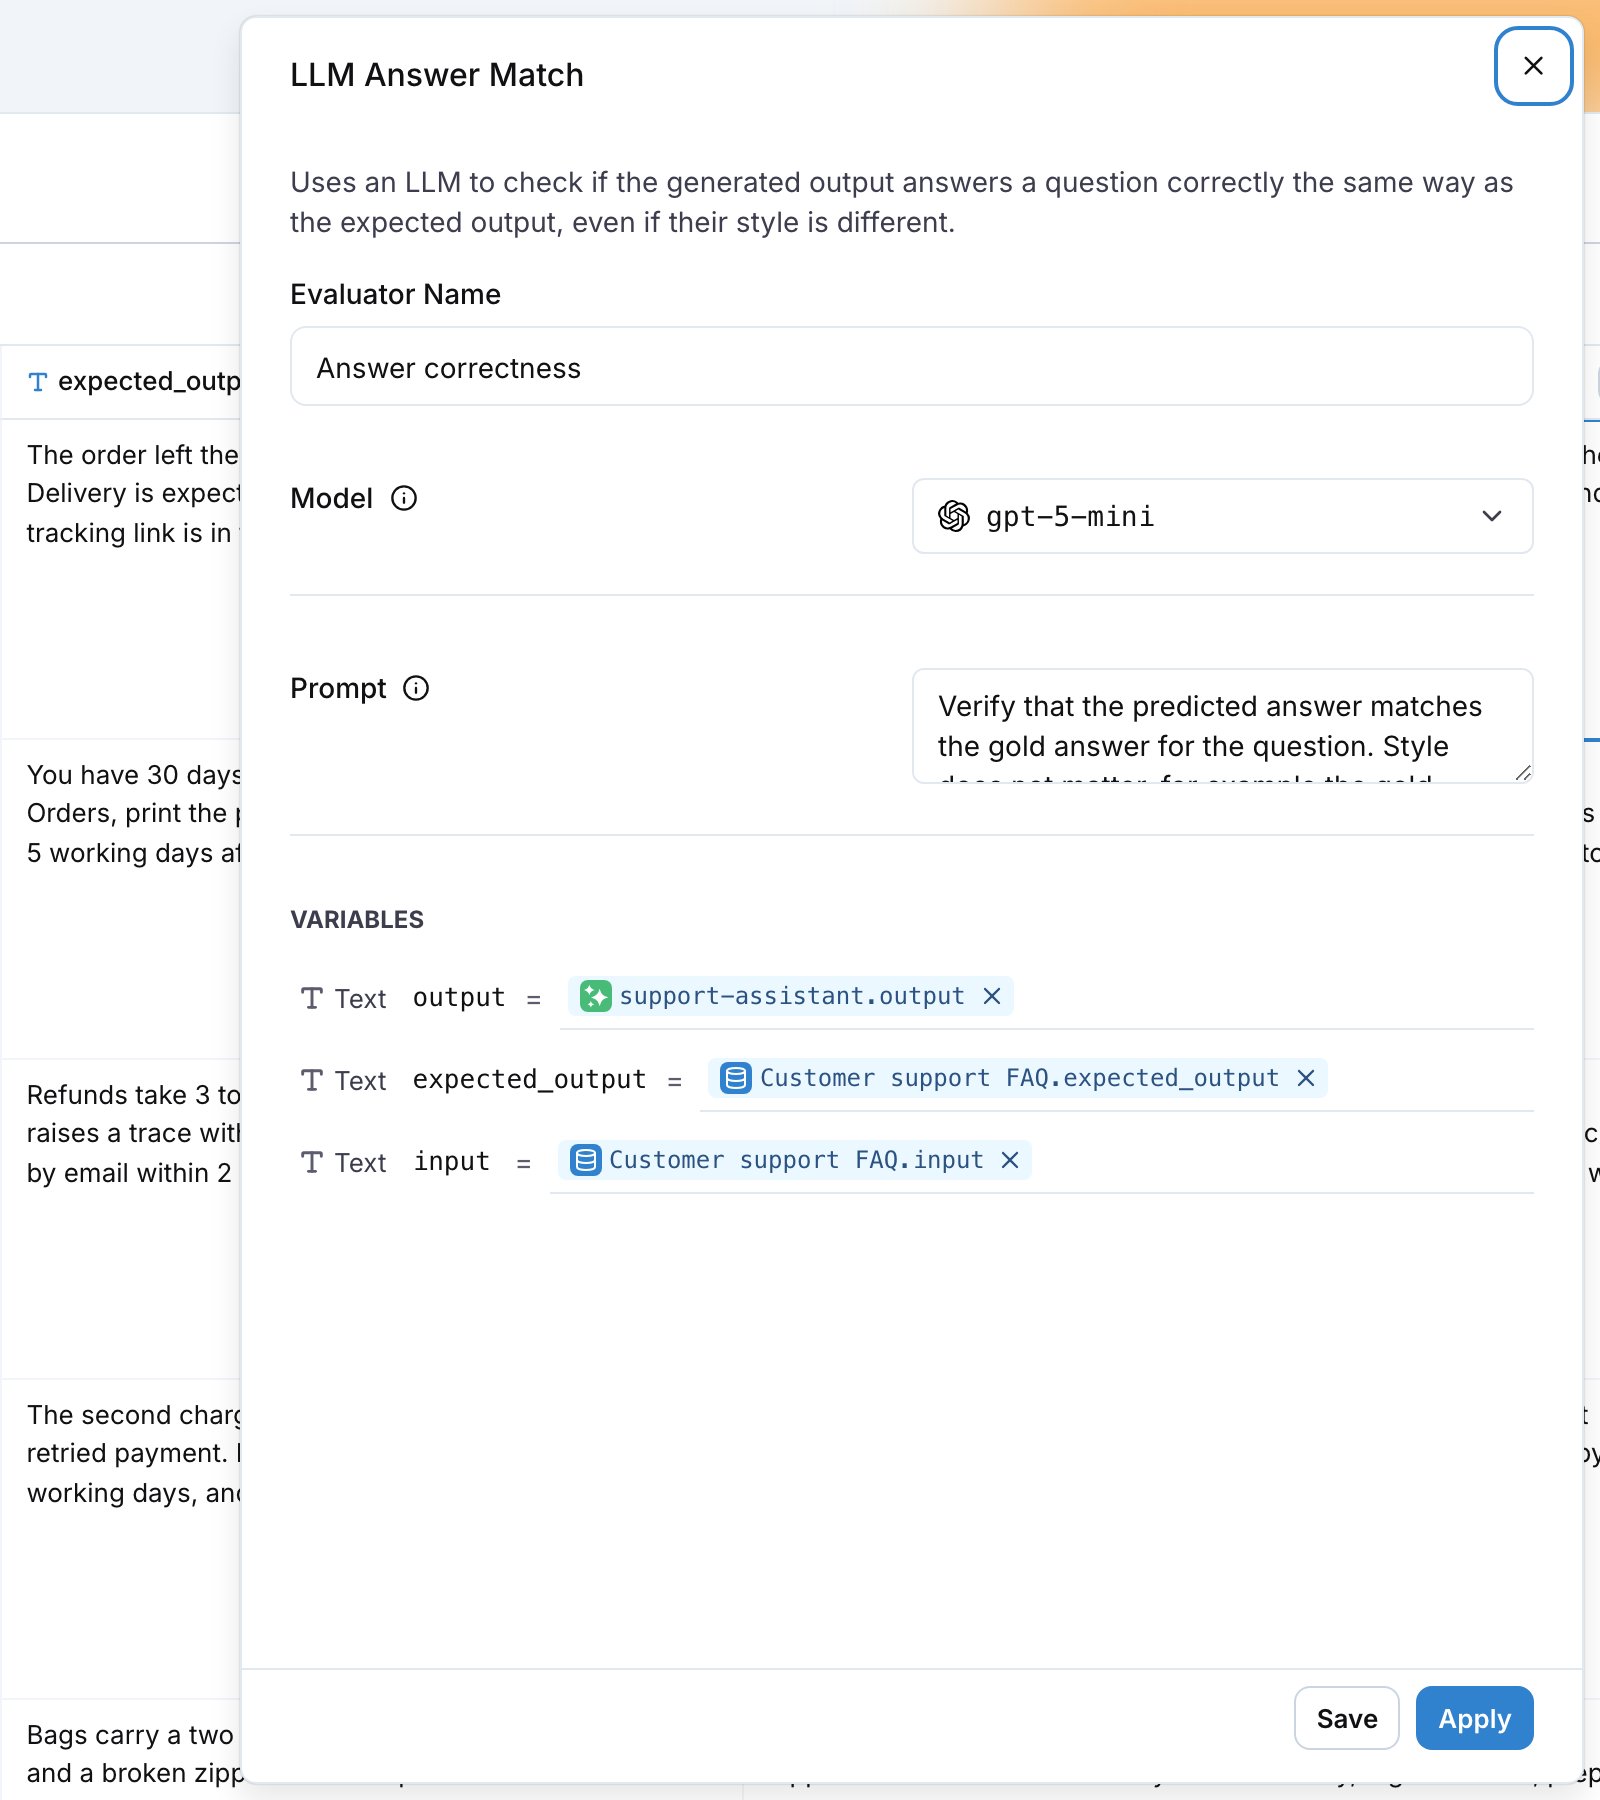
Name the evaluator. In Variables, map
output to the prompt column’s output, expected_output to the dataset’s expected_output column and input to the dataset’s input column, then click Create Evaluator. If a required field stays unmapped, the workbench opens the mapping editor. Map the field there and click Apply.5
Run
Click Run in the header. Each cell fills with the model’s answer and the evaluator chip on each row turns into a pass or a fail. To rerun a single row, use the button on that cell.
6
Read the results
Hover over the summary in the column header. Pass Rate is the share of rows the evaluator passed. Click a failed chip to read the evaluator’s details: for LLM Answer Match, the reason the model gave for the mismatch.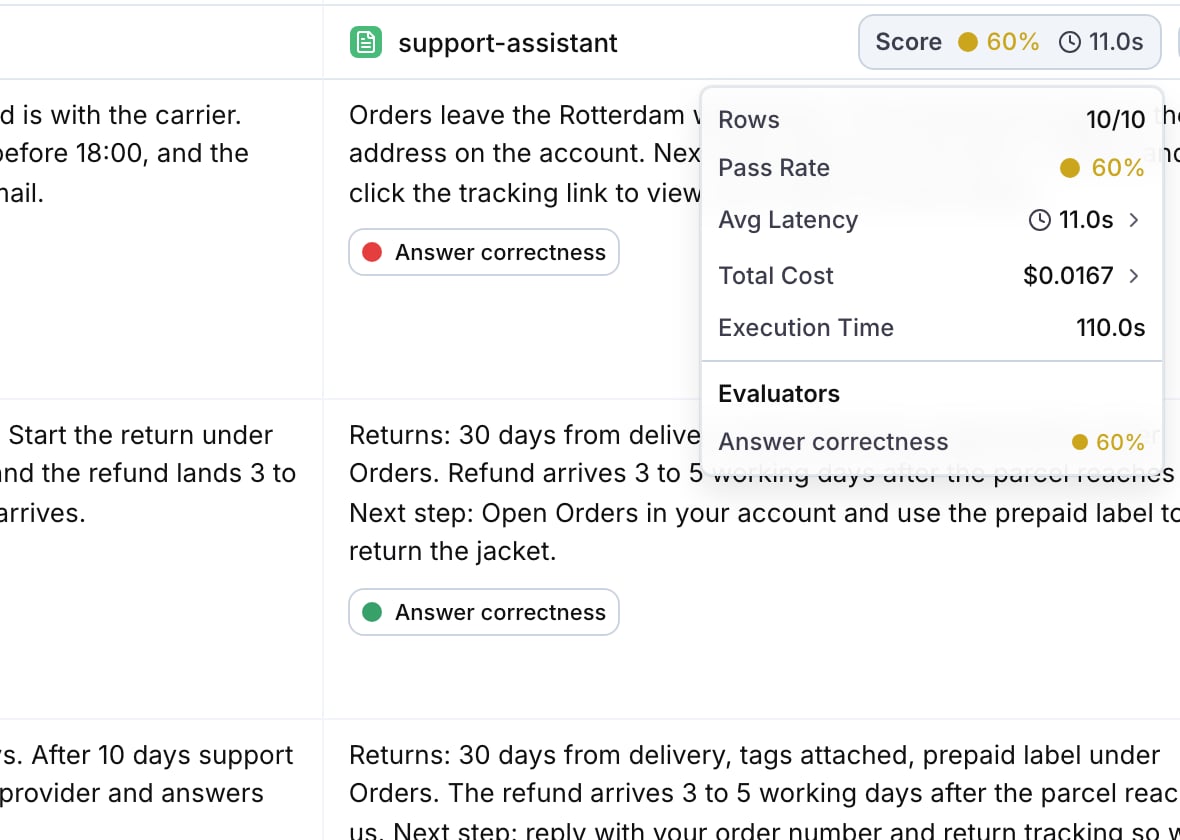
Iterate and compare runs
Edit the prompt to fix the failing rows and click Run again. Every run is kept. Click Results in the header and tick the previous run and the new one in the Experiment Runs sidebar to see both side by side, with the pass rate of each run in the chart and both outputs per row, and check that no row that passed before now fails.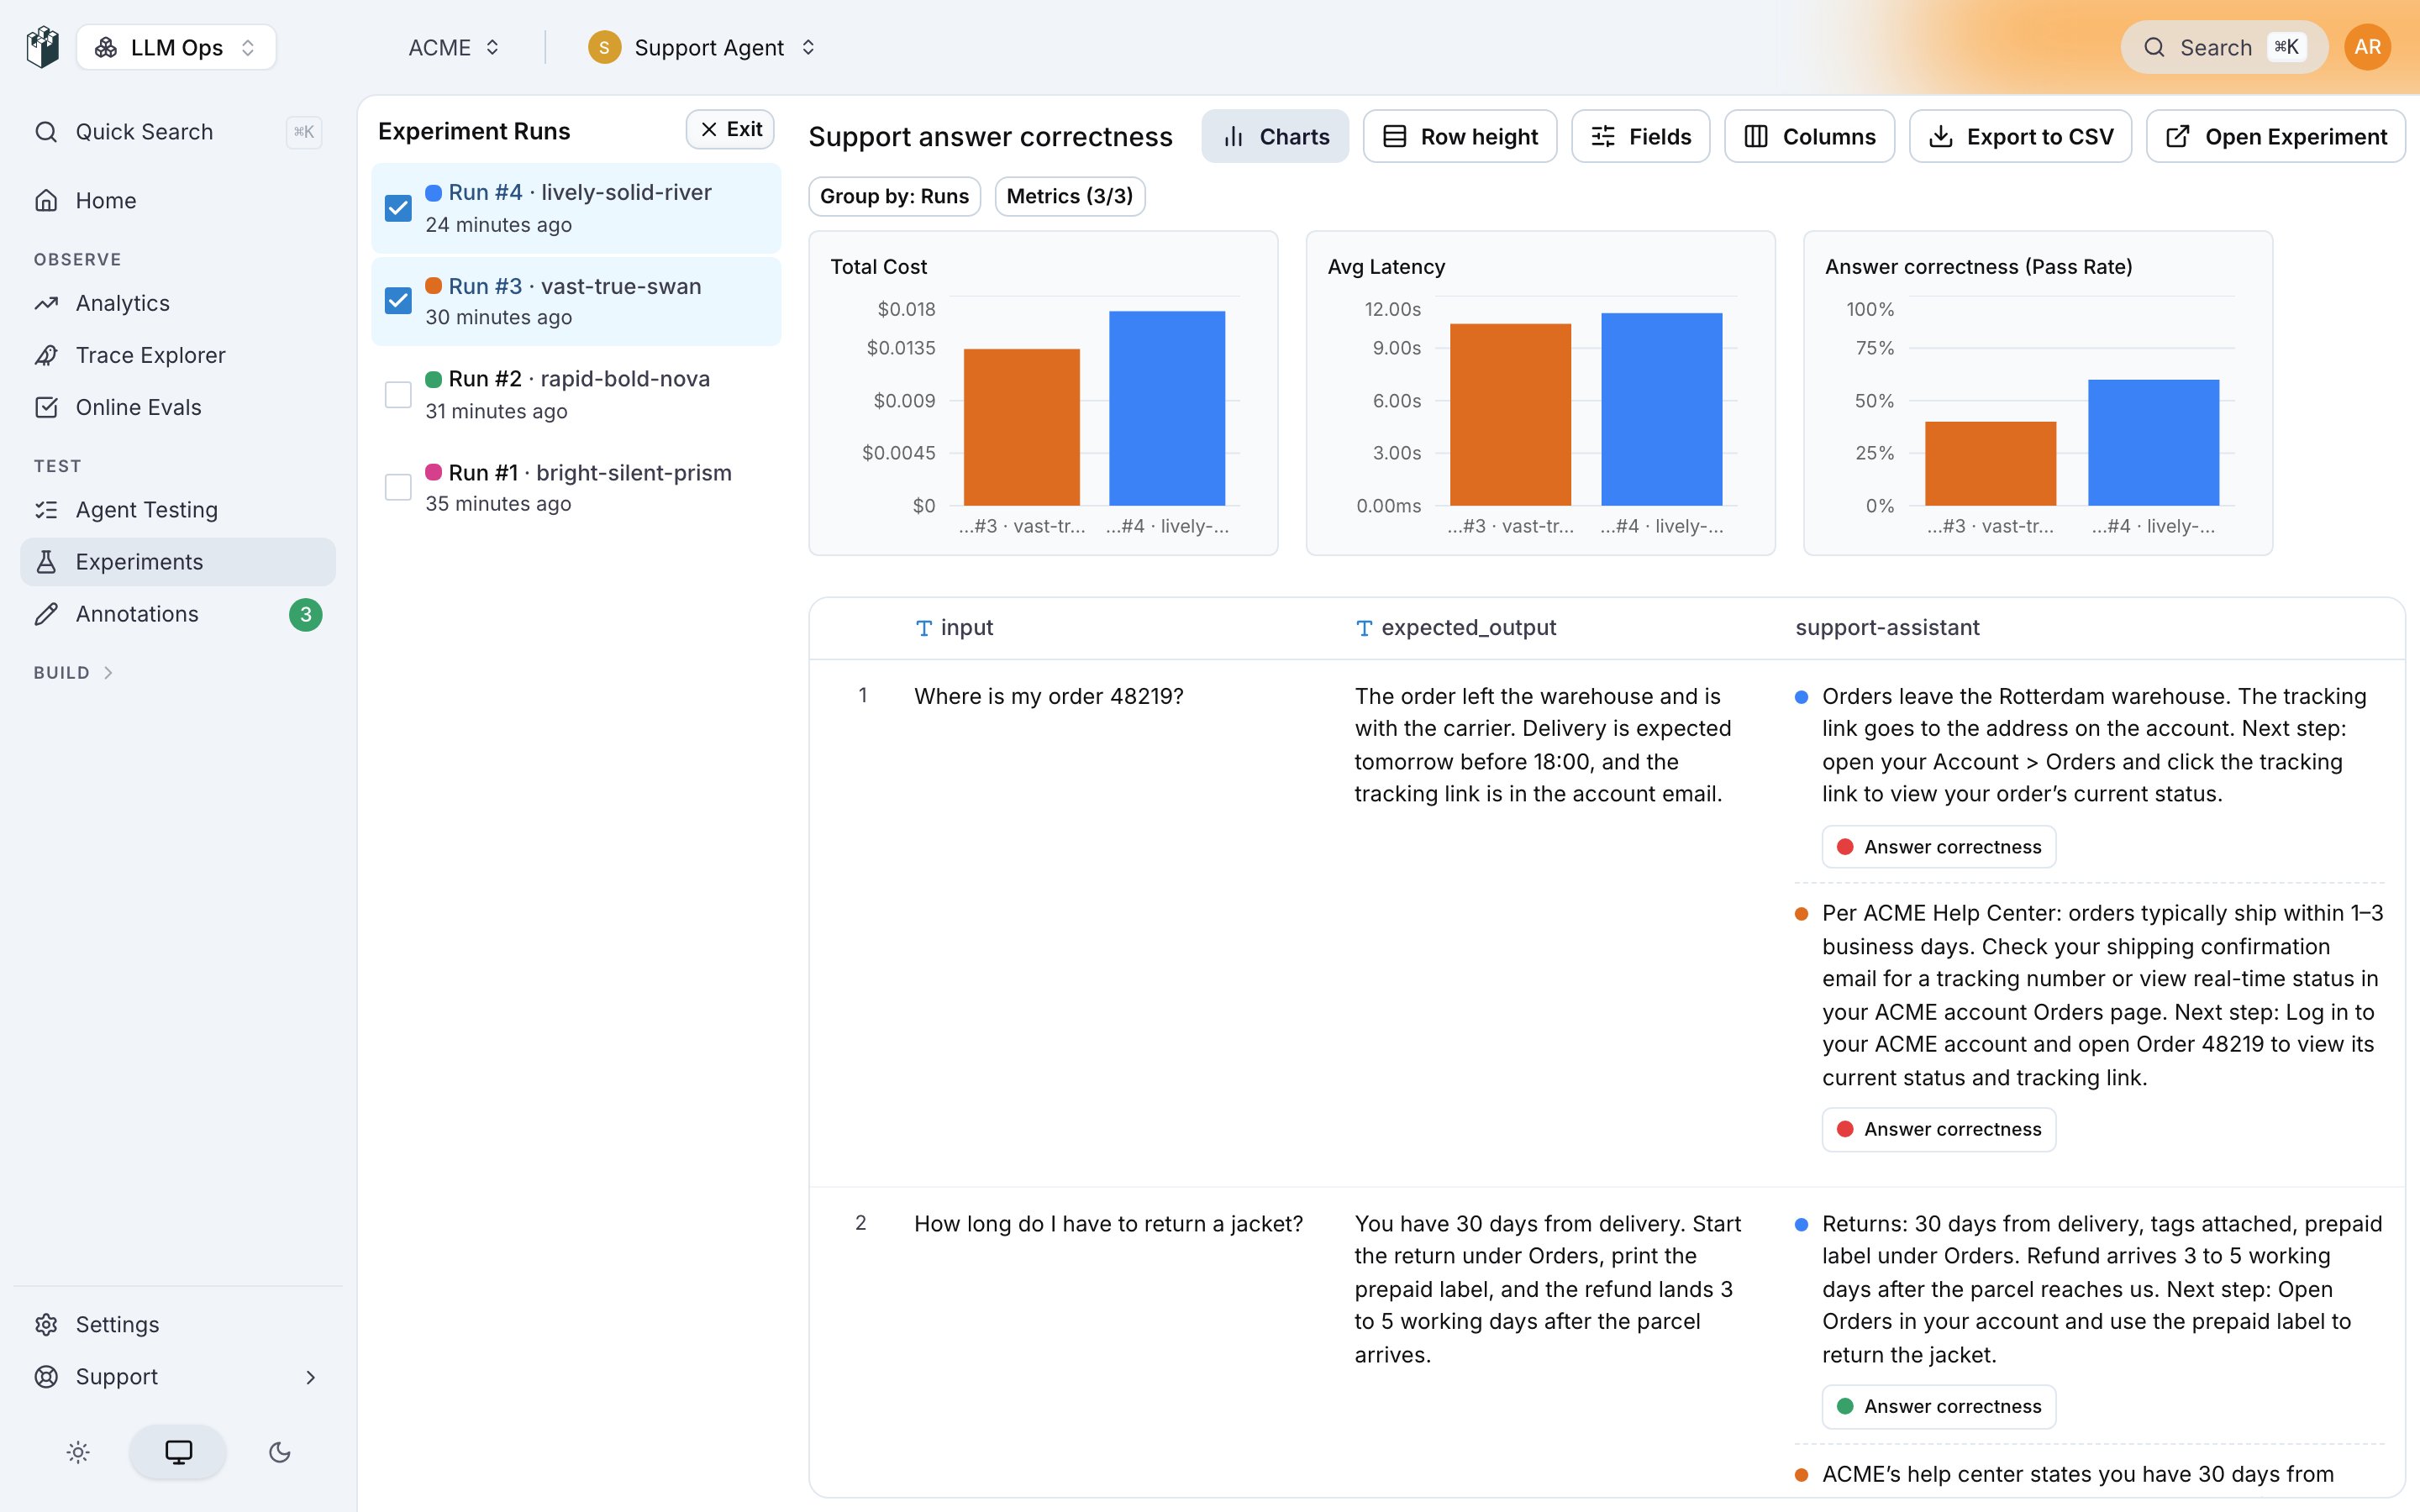
Common failures
Also check: LLM-as-a-judge for datasets without expected outputs, and Run experiments from CI/CD to trigger this experiment from a pipeline.