

governance:view permission, which an organization Admin holds. Each developer also has a personal home page at /me.
The overview page
The overview at/governance is the way into the section rather than a dashboard of its own. It opens with a greeting, one field for asking a question or jumping to a screen, an Add Source action for admins who may manage ingestion sources, and shortcuts to add people, an agent or a tool.
Under those sit two lists. Insights fills once your ingestion sources are pulling, and Recent activity lists the screens you were last on. LangWatch AI Gateway traffic is under Gateway > Usage.
Before your first ingestion source reports an event the page looks the same: each of the two lists carries one line saying what will fill it.
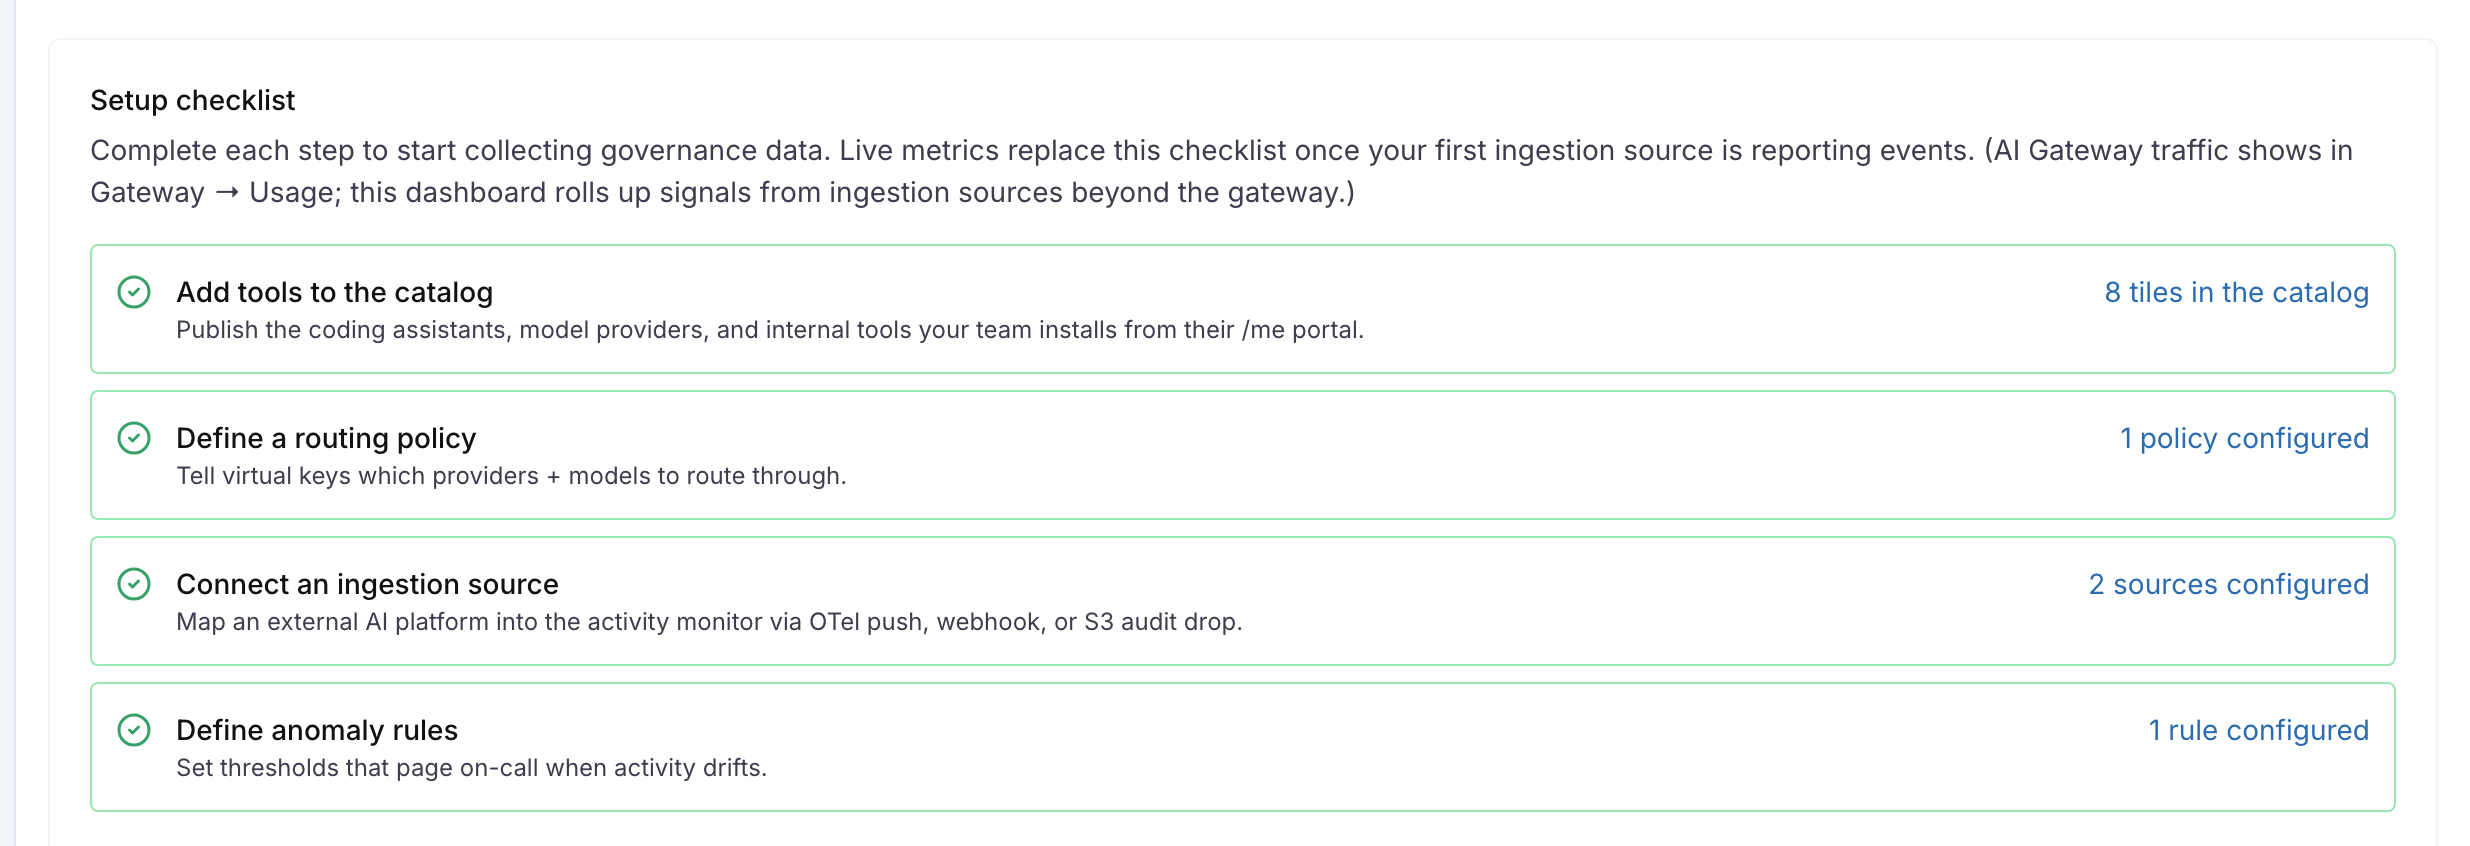
The overview as an earlier build drew it, with a setup checklist. The page no longer shows this checklist.
Inventory
The inventory has two tabs. Sources lists the systems that report AI activity, in two groups: real-time streams that push events as they happen, and sources synced on a schedule. A new source reads Awaiting first event until its first event arrives, then Active.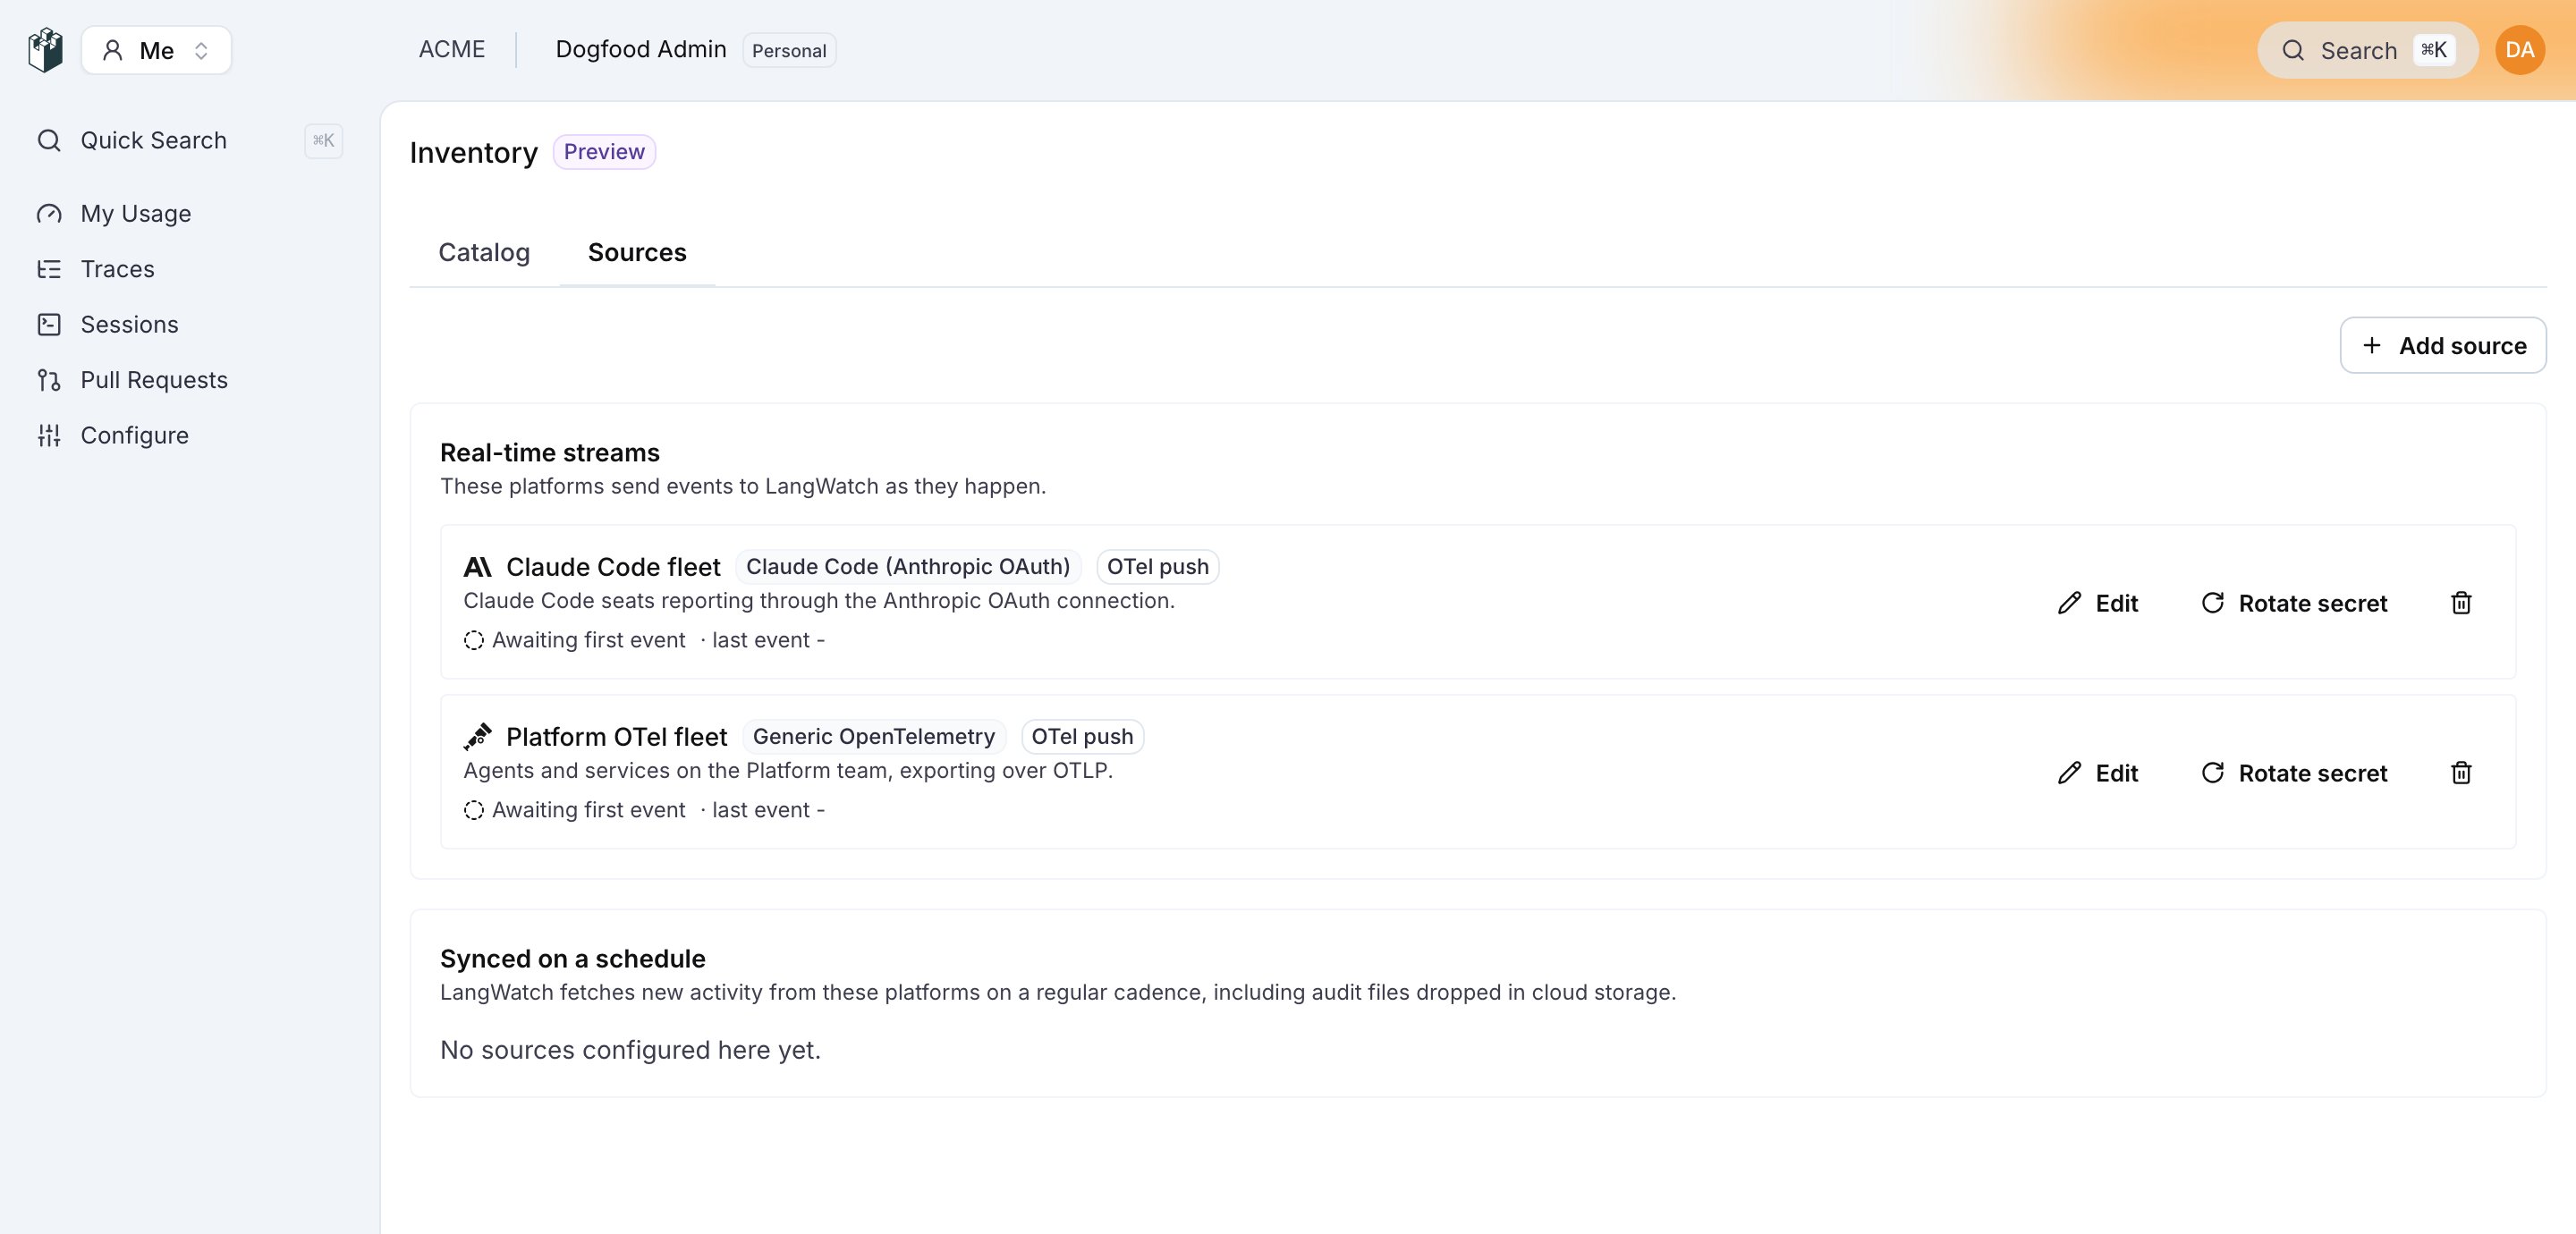
The Sources tab with two real-time sources, a Claude Code source and a generic OpenTelemetry source, both awaiting their first event.
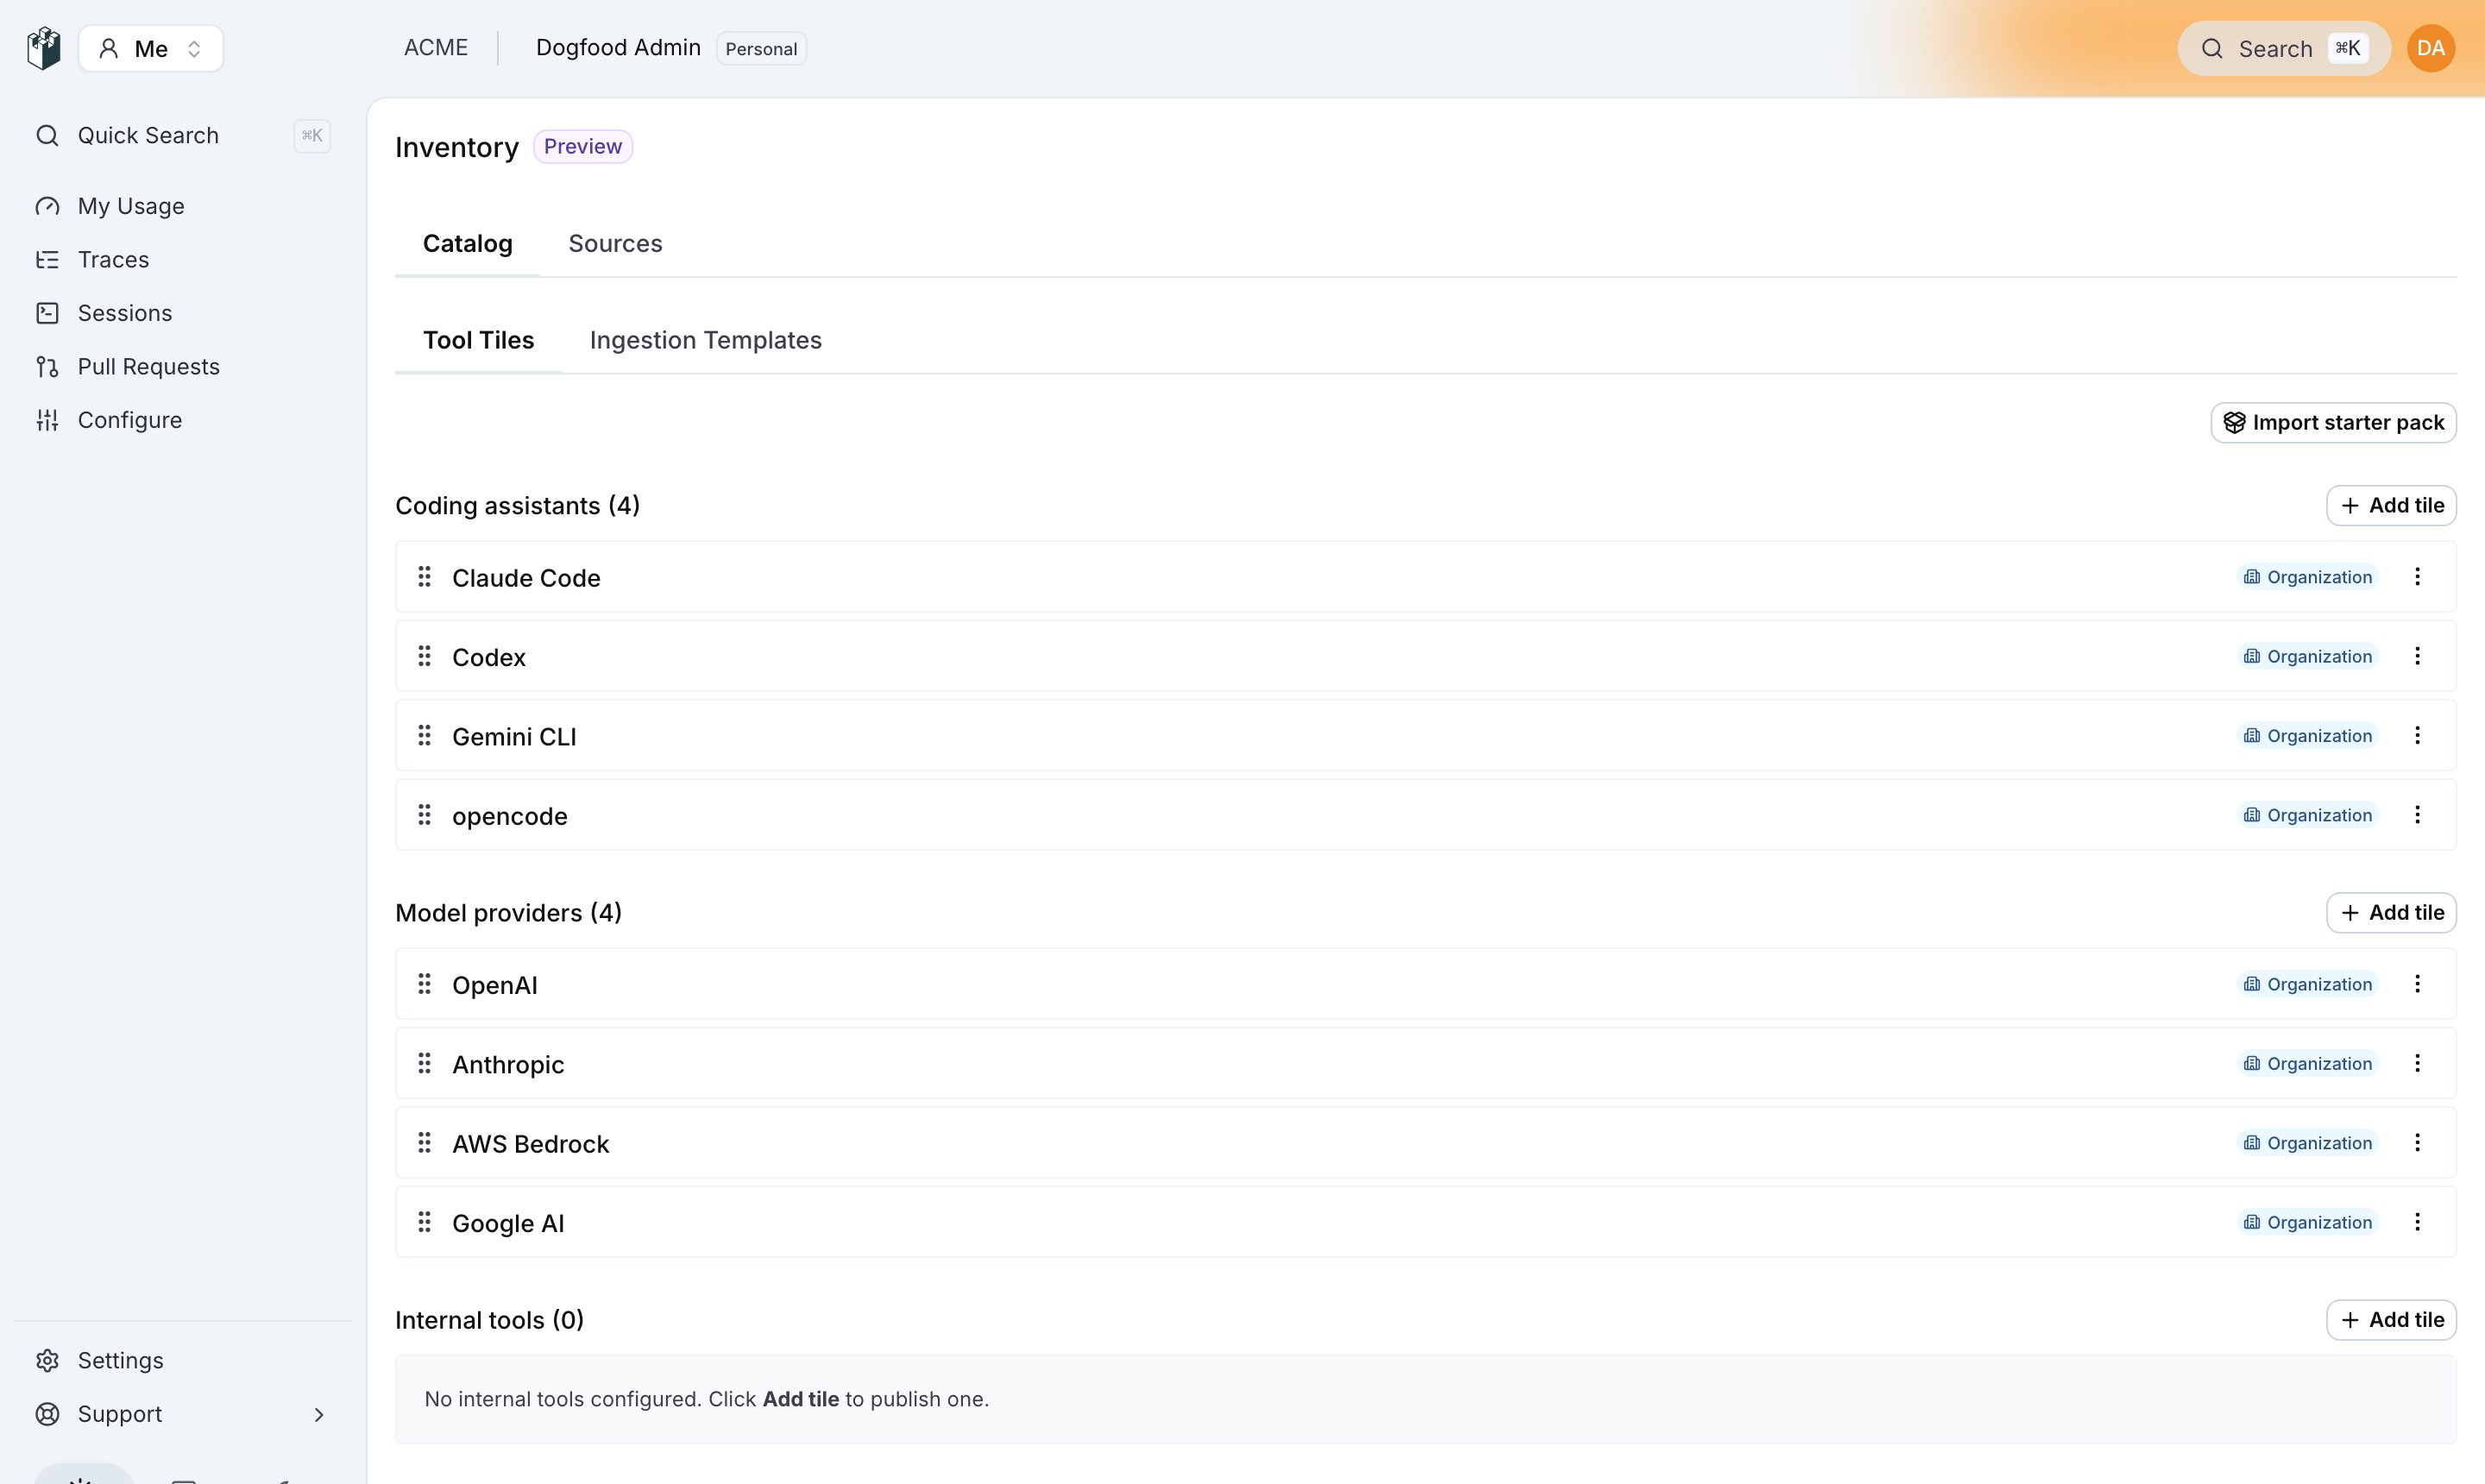
The Catalog tab after the starter pack import: four coding assistants and four model providers, each scoped to the organization.
Personal home page
/me shows each developer the tools published in the catalog, the budgets that apply to them, and their usage this month.
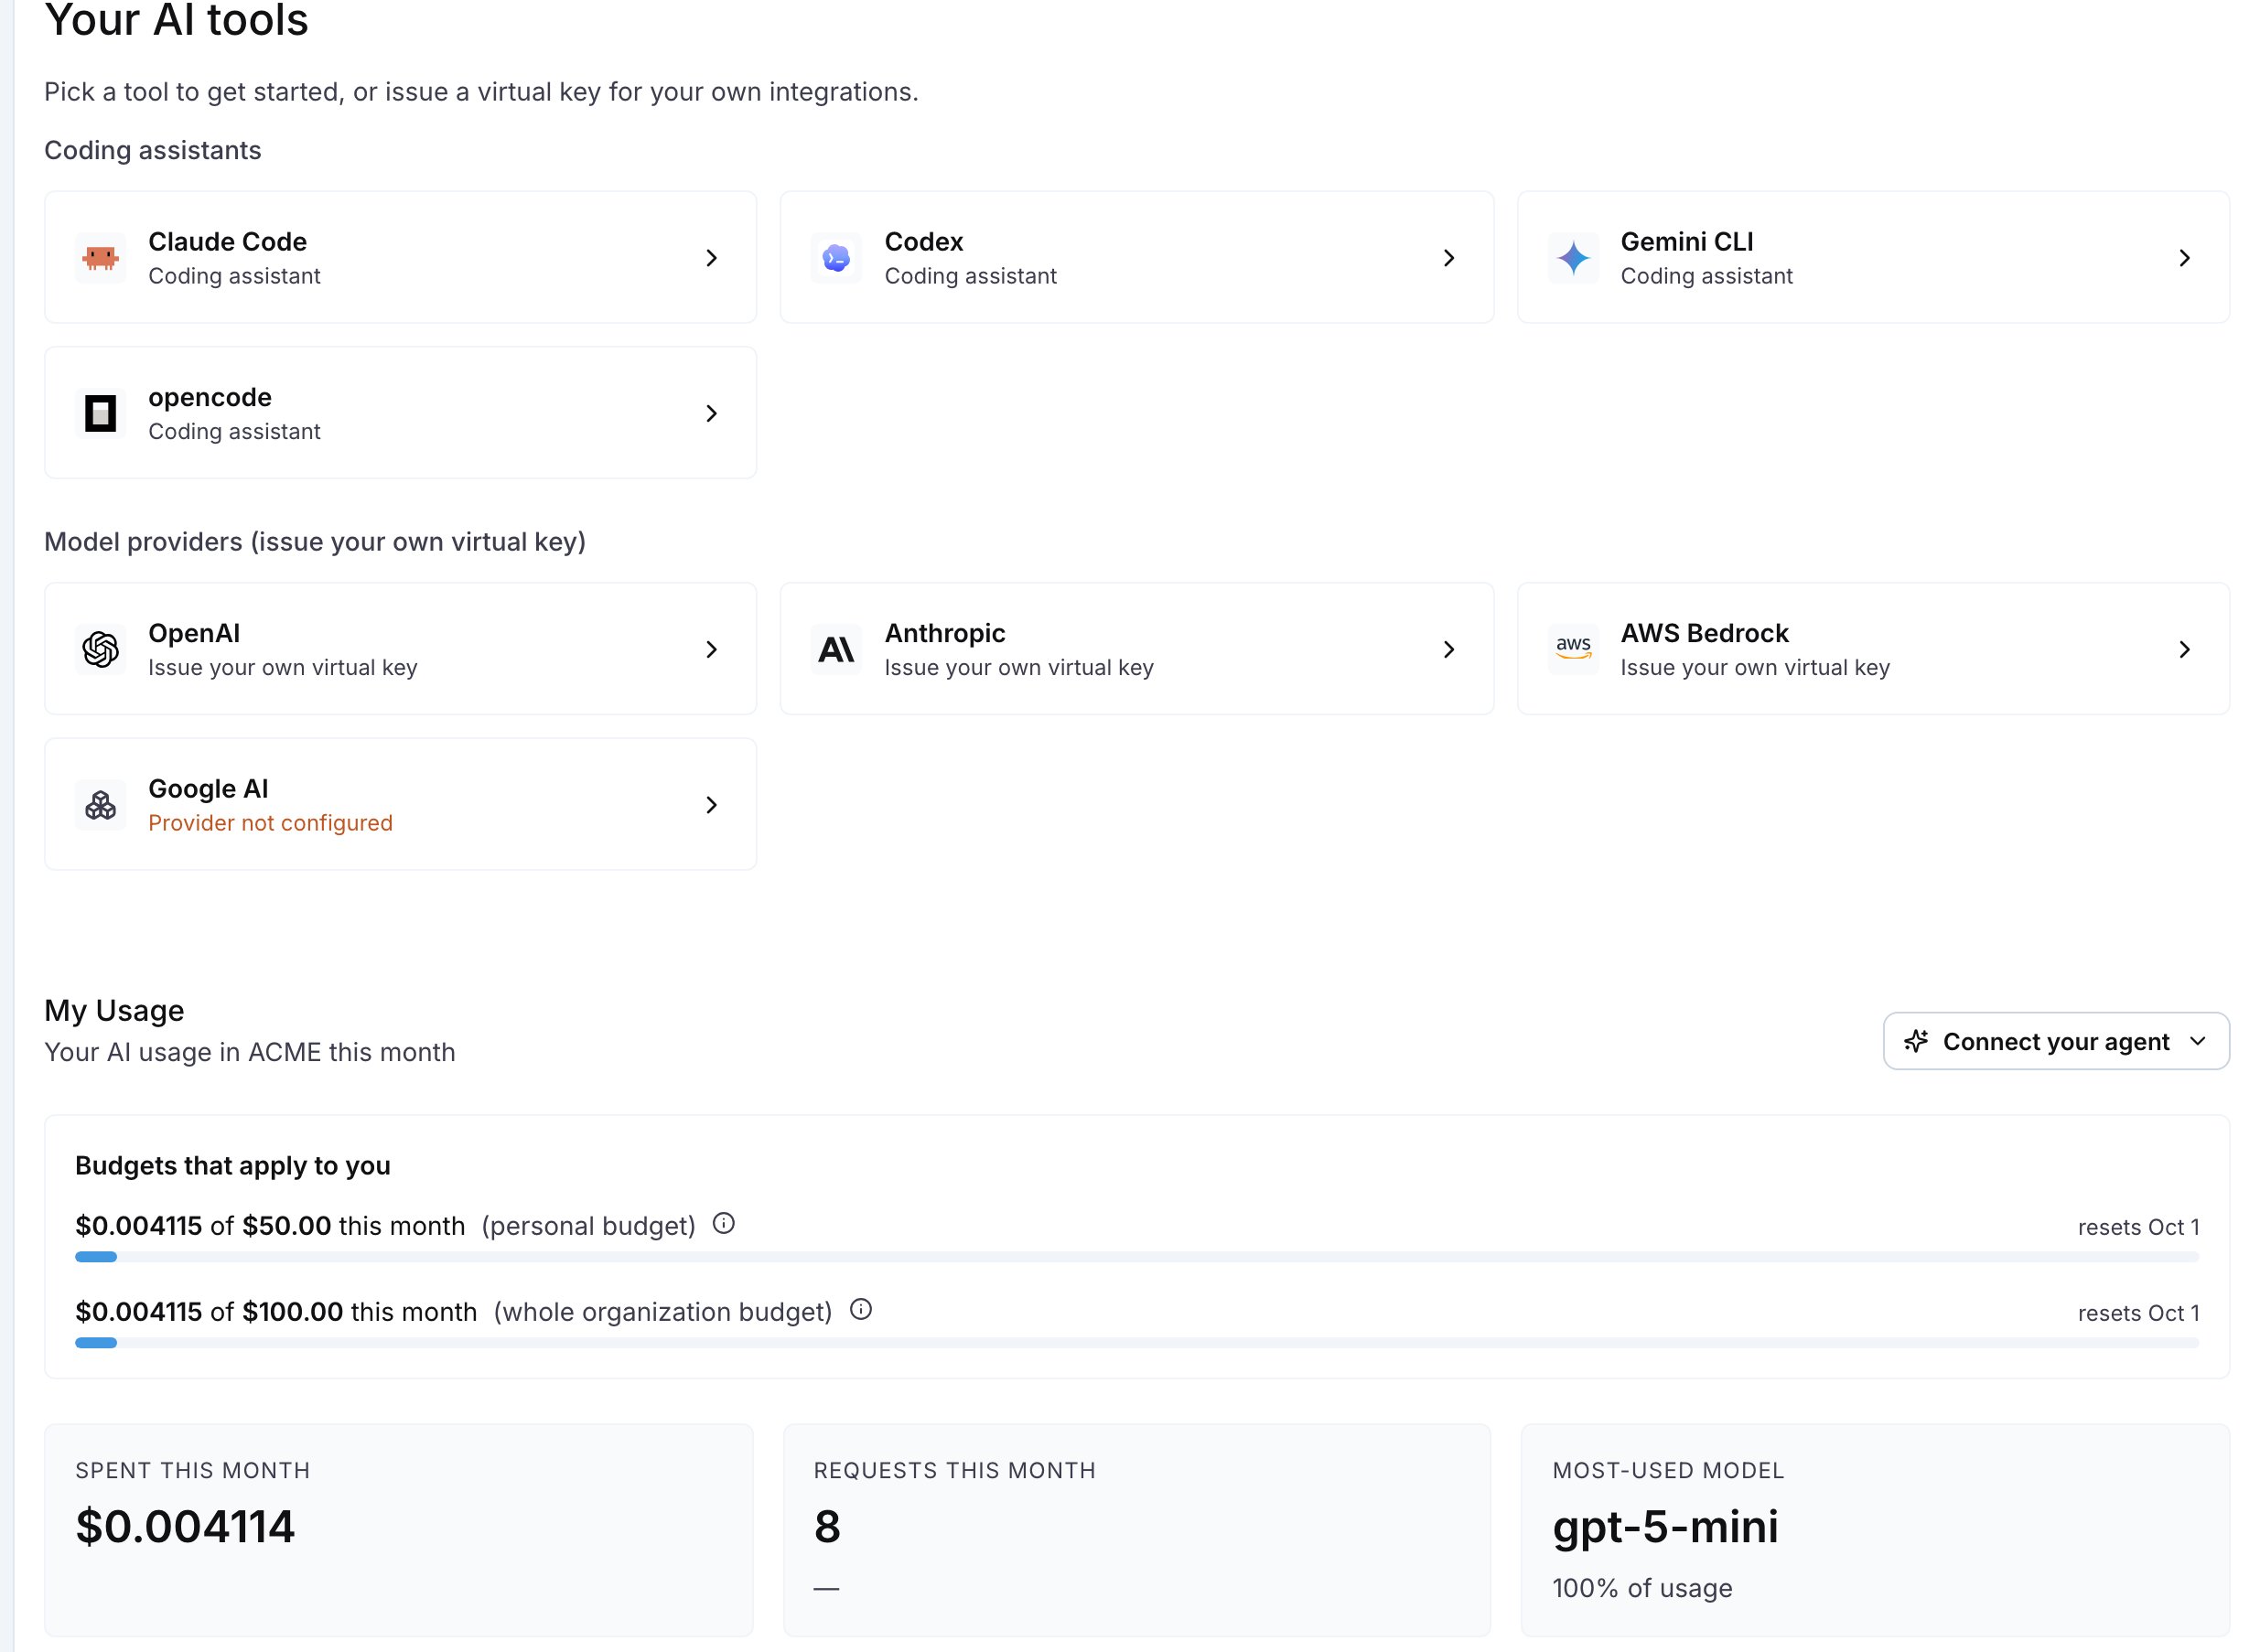
The personal home page: the tool tiles, the personal and organization budgets, and the Spent, Requests and Most-used model cards.
Pages
Inventory: sources
The systems that report AI activity to LangWatch: Claude Code, generic OpenTelemetry, Workato, Microsoft Copilot Studio, the OpenAI and Anthropic compliance and admin APIs, Databricks Genie, and custom S3 or HTTP audit logs. Each source shows whether it is active, awaiting its first event or disabled.
Inventory: tool catalog
The coding assistants, model providers and internal tools that developers see on their personal home page. Import the starter pack, then scope each tile to the whole organization or to departments.
Anomaly Rules
What the anomaly detector evaluates and what a rule is made of. Rules cannot be created or edited in LangWatch today. Available on Enterprise plans.
People
Departments: the accounting label that spend rolls up by. Assign people, teams and projects to a department, and personal AI use follows the person.
Personal home page
/me shows each developer the tools they may use, the budgets that apply to them, and their spend, requests and most-used model this month.Roles and permissions
Who can open the governance pages and who can change them:
governance:view and governance:manage, plus the permissions for ingestion sources, anomaly rules and the tool catalog.Audit log
Every change made in the settings, the API and the LangWatch AI Gateway, with who made it and from where.