

0.78 does not tell you whether one variant is better than the others for your users. A relative question, “which of these outputs is best for this input?”, is easier for a judge to answer and gives a more stable verdict.
When to use it
Use Comparison when the decision is between two or more alternatives:- You review a prompt change before you promote it.
- You test whether a smaller or cheaper model keeps the answer quality.
- You compare several retrieval, tool-use or agent policies on the same dataset.
- You have a reference answer and want to know which candidate follows it best.
- You have no reference answer, but you can describe what “better” means in the judge instructions.
- You want a reviewable explanation for each win, loss or tie.
- You have one target to score. Use Answer Correctness or LLM-as-a-Judge.
- You need a calibrated numeric metric such as exact match, retrieval recall, toxicity or latency.
Setting it up
- Open the Experiments Workbench.
- Add the two or more prompts, agents or models you want to compare, one column each.
- Click Add to Evaluation and pick Comparison. If you already have a saved Comparison evaluator, pick it from the list, or select New Comparison to start blank.
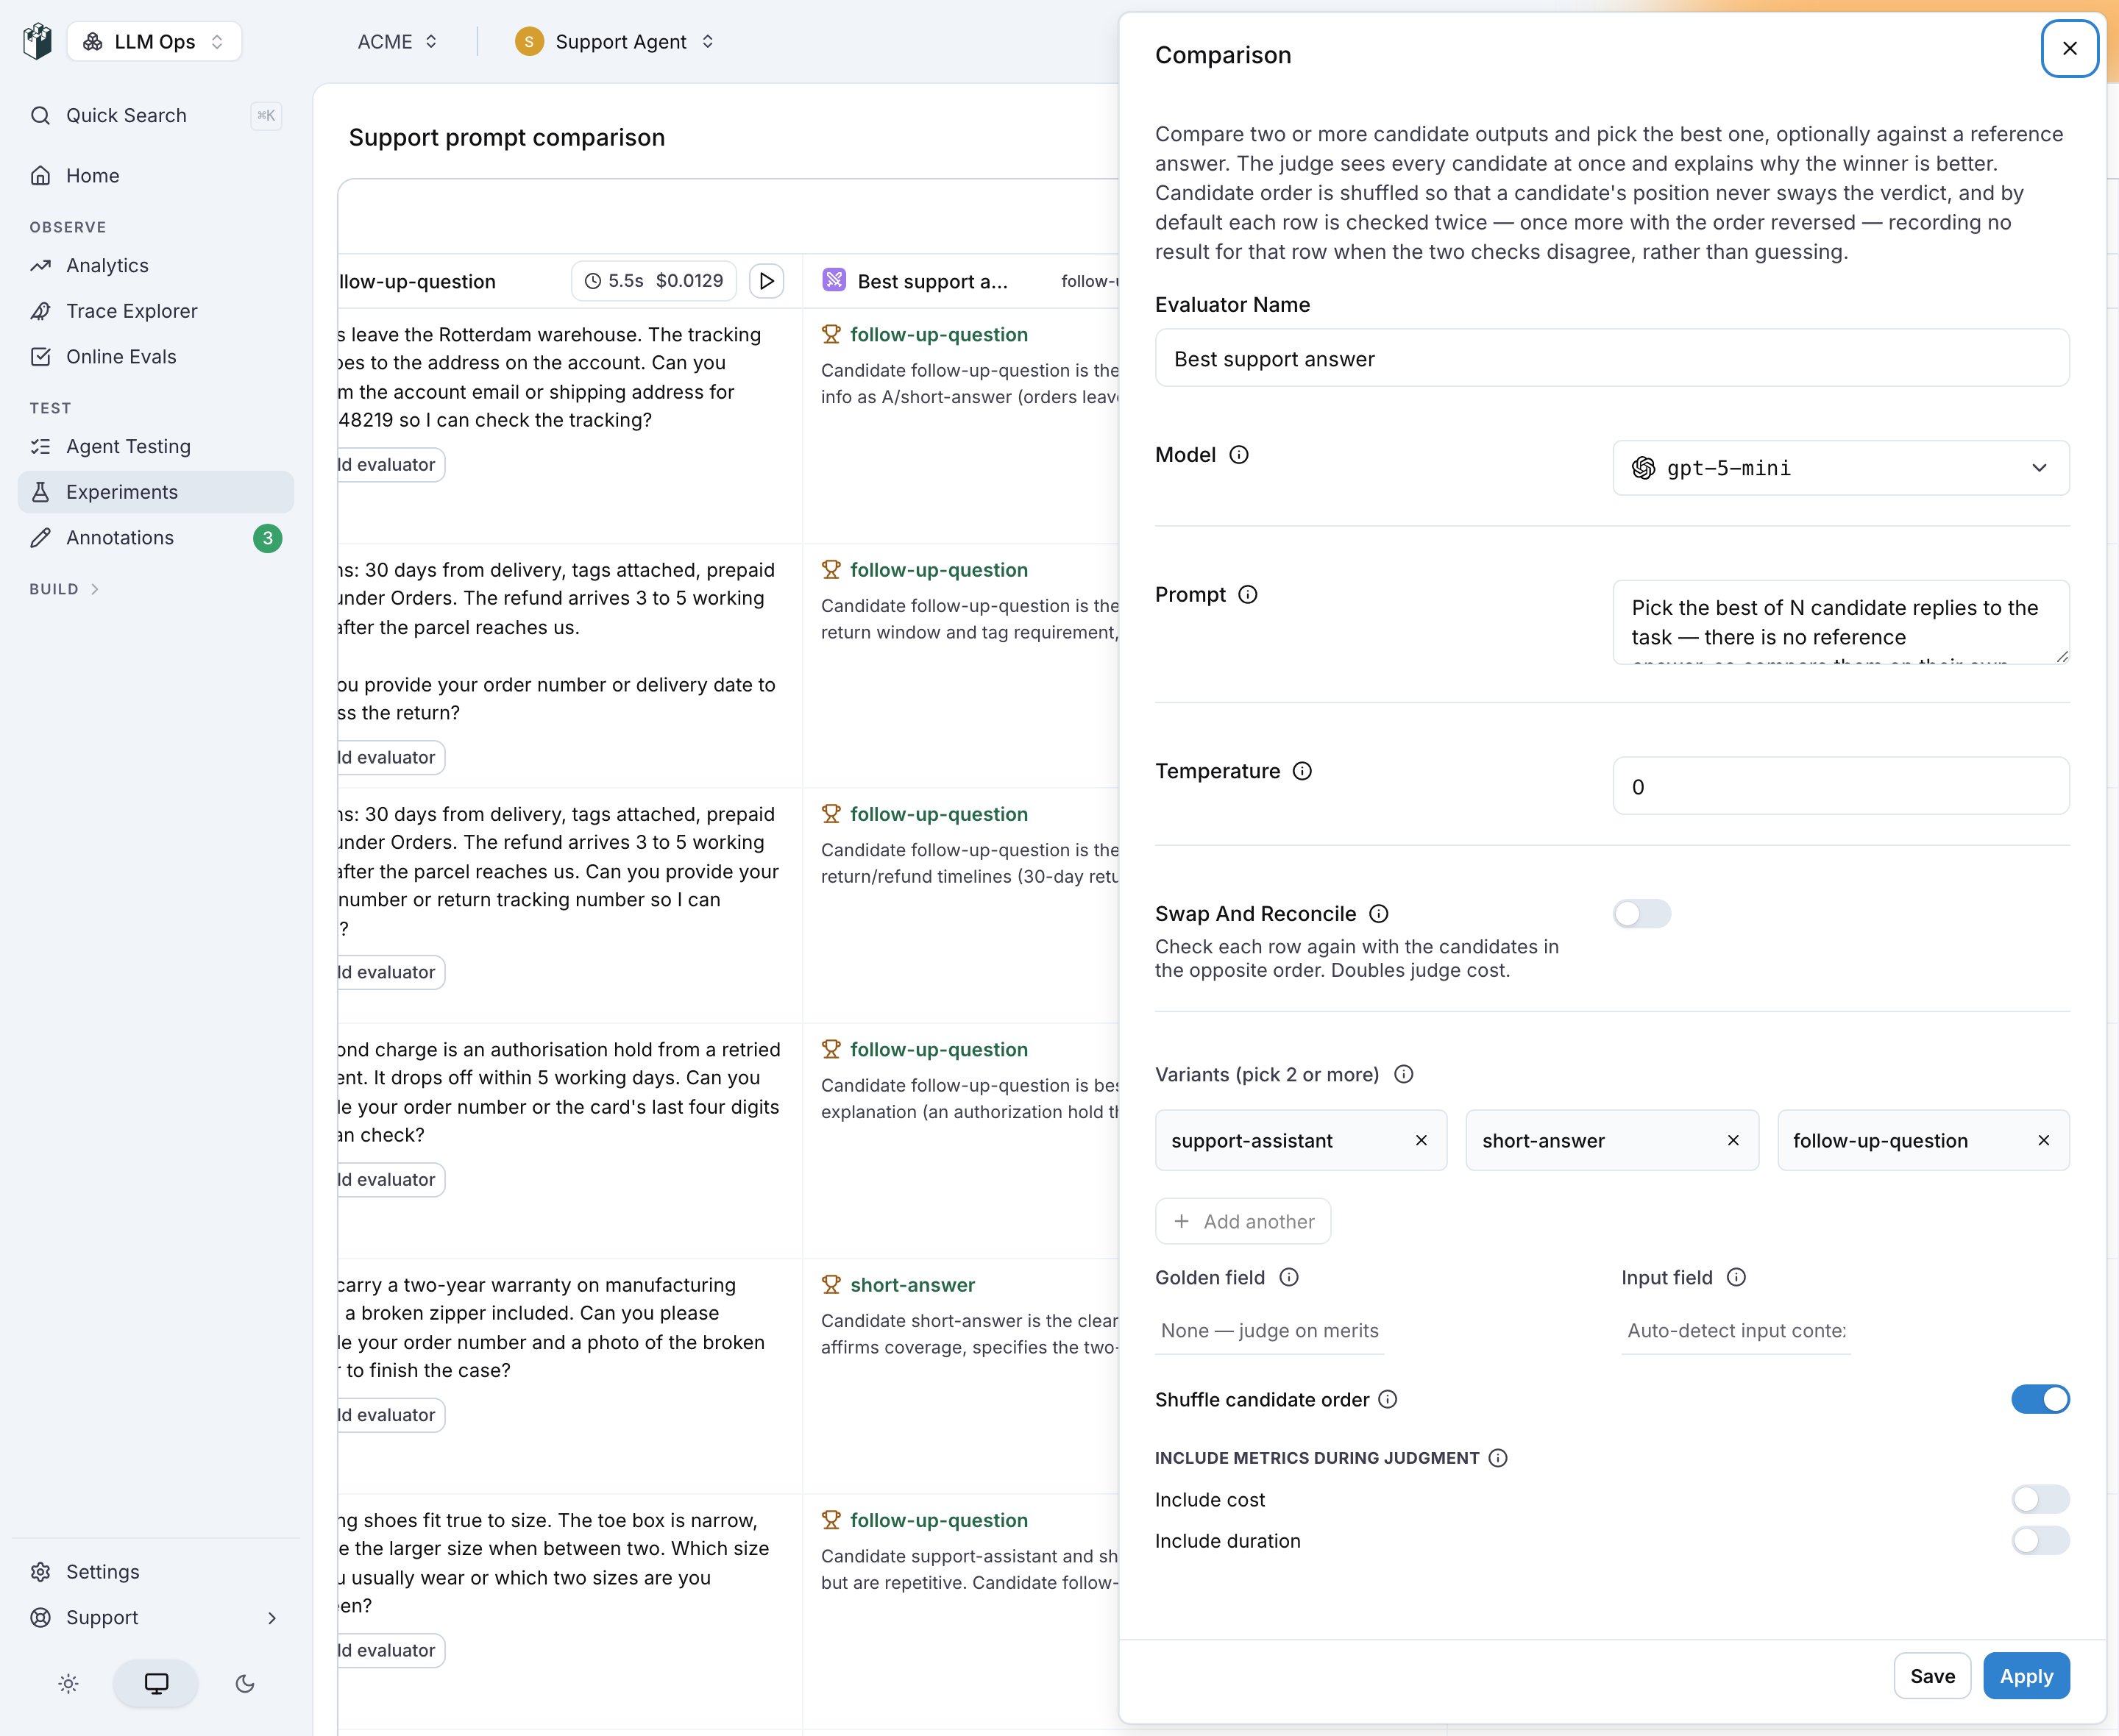
- Name the evaluator and pick the judge Model. The Prompt holds the judge instructions and Temperature the judge’s sampling temperature.
- Under Variants (pick 2 or more), select the candidates. Add another adds one more.
- If your dataset has a reference answer, select its column in Golden field. Leave it on None, judge on merits (the default) to compare the candidates on their own, and describe the preference criteria in the prompt instead. Input field names the column with the task the candidates answered; the default auto-detects it.
- Keep Shuffle candidate order on, and Swap And Reconcile on unless you want one judge call per row. Under Include metrics during judgment, switch on Include cost or Include duration to show those per candidate to the judge.
- Click Apply, or Save to keep the evaluator for other experiments. Saving is disabled until at least two candidates are selected.
- Run the experiment. Comparison runs once every candidate has produced an output for a row. A row where one candidate produced no output is skipped.
bot (1) and bot (2), so the scoreboard and the row verdicts stay readable.
How the verdict works
By default Comparison shuffles the candidate order per row and asks the judge to pick the best candidate in one comparison across every candidate:- The judge sees the candidates in a shuffled order that is seeded by the row index, so a re-evaluation of the same row presents the same order and gives a comparable verdict. Shuffle candidate order (
randomize_order) controls the shuffle. Turn it off and the judge sees the candidates in the order their targets were registered. - The judge picks the single best candidate, or a tie when no candidate is clearly better and ties are allowed.
- LangWatch maps the verdict back to the winning candidate’s own identifier (for a prompt, its prompt handle) before it shows it to you.
swap_and_reconcile) on, the default, the judge is asked twice per row, the second time with the candidate order reversed, which doubles the judge cost. When the two answers disagree, the row is recorded with no winner and the cell reads No verdict yet, because a verdict that changes with the order has not separated the candidates.
The verdict details include the judge’s reasoning, so you can read why a row went the way it did.
Golden field or direct preference
Golden field is empty by default. When you select a column, the judge grades every candidate against that reference answer. When it is empty, the judge compares the candidates on their own merits and the judge prompt has no reference answer section. Use a golden answer when correctness is the main question. Use direct preference when the task is open-ended and you care about tone, completeness, helpfulness, structure or policy adherence.Reading the results
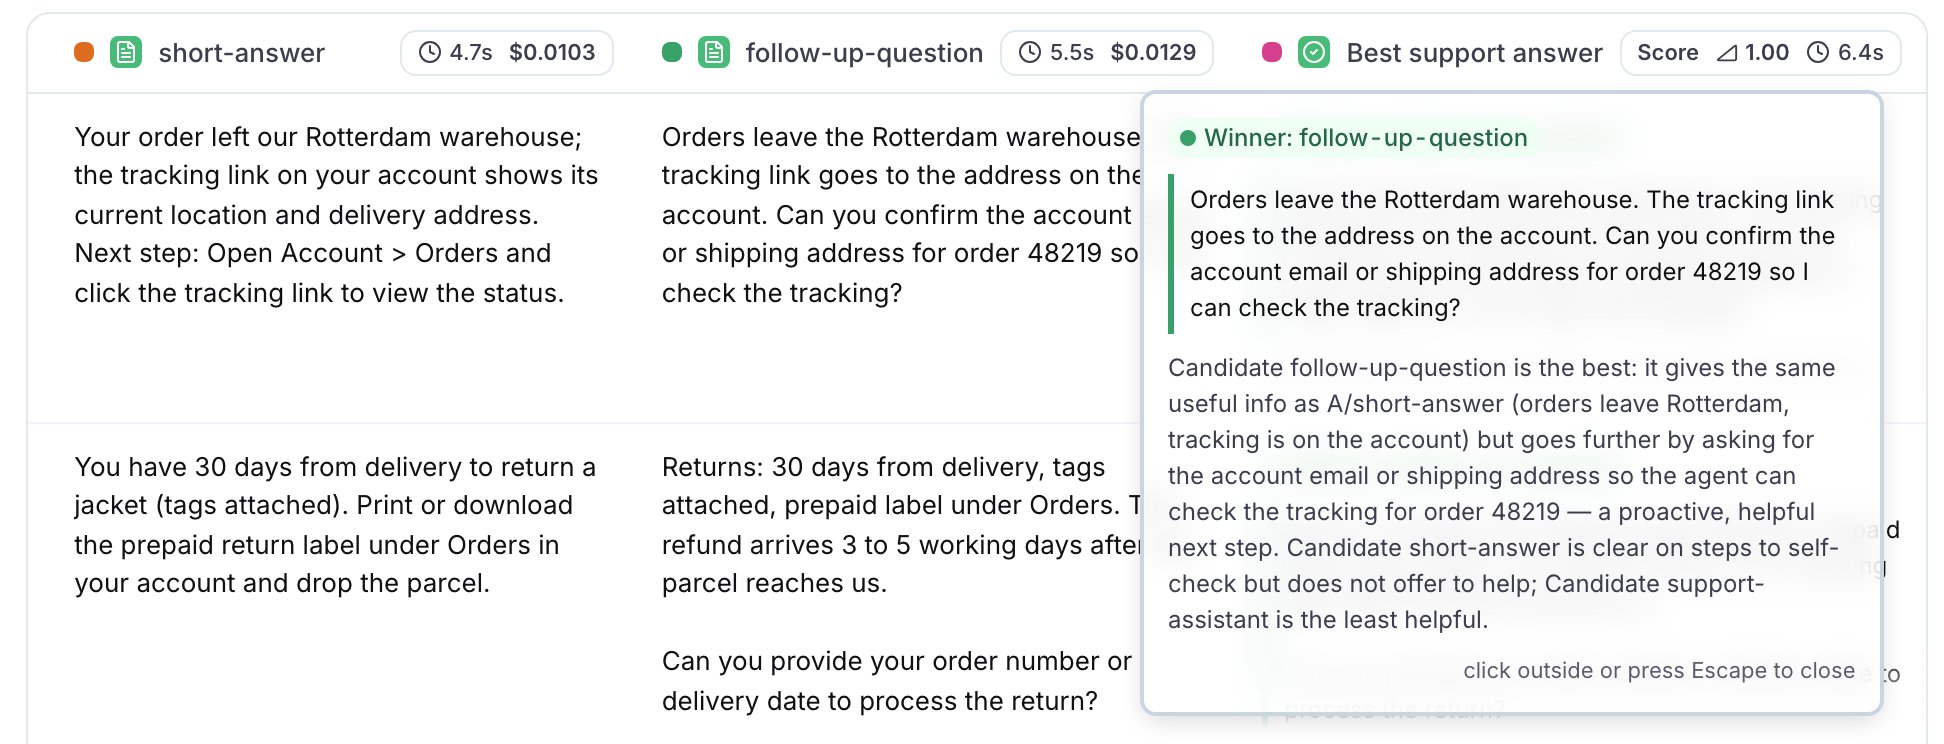
The Comparison column holds what you need to review each judgment:- Who won: each row shows the winning candidate’s name with a trophy, a tie when no candidate is clearly better, or No verdict yet when the two passes disagreed. A tie means the candidates are equally good. No verdict means this row did not separate them.
- What won: the cell shows the winning candidate’s output, so you can read the answer the judge preferred.
- Why it won: the judge’s reasoning is below the output.
The win-rate chart
Click Results in the header to open the results page. It shows a win-rate card named after the evaluator next to the cost and latency charts, with one bar per candidate plus a Tie bar. Every candidate is counted, including the ones that never won a row. A row with no verdict is on none of the bars. Long candidate names are shortened on the axis; hover a bar for the full name.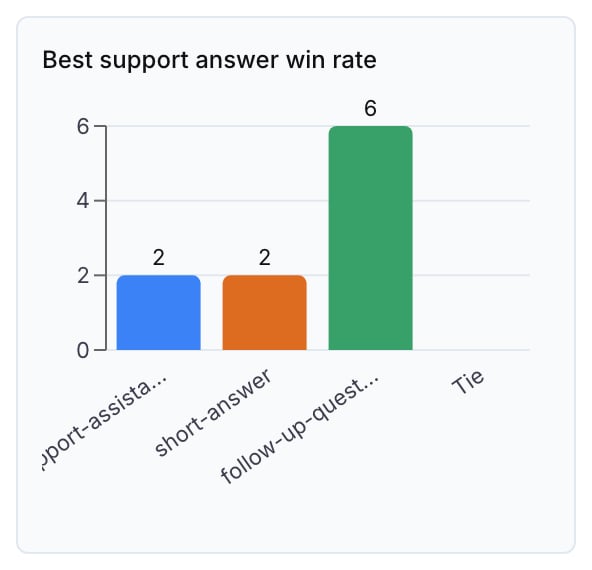
- A large win margin indicates a clear preference.
- A high tie count means the candidates are equivalent for this dataset, or the judge instructions are not specific enough.
- Many rows with no winner mean the judge changes its answer when the candidate order changes. Change the judge model, or make the instructions more specific.
- Split wins are useful: read the rows each candidate wins to see which use cases improved and which regressed.
The Bradley-Terry leaderboard
With three or more candidates, a win tally is not enough to rank them. A can beat B, B can beat C, and C can beat A on a small sample, and a win against a strong candidate counts the same as a win against a weak one. The leaderboard fits every candidate one strength score from all of its matchups at once, with a confidence interval, using the Bradley-Terry model. The leaderboard appears on the results page, as a card next to the win-rate chart, when the comparison has three or more candidates. With two candidates the win-rate chart already tells the whole story, and there is no leaderboard. The Metrics selector on the results page lists it as (Leaderboard) next to the evaluator’s name. The leaderboard is a ranking with a stated confidence. It names a winner only when the run separates that candidate from every other one, and it reports every check that limits what the run can support. On a small run, for example 10 rows over three candidates, expect it to report the ranking as not settled.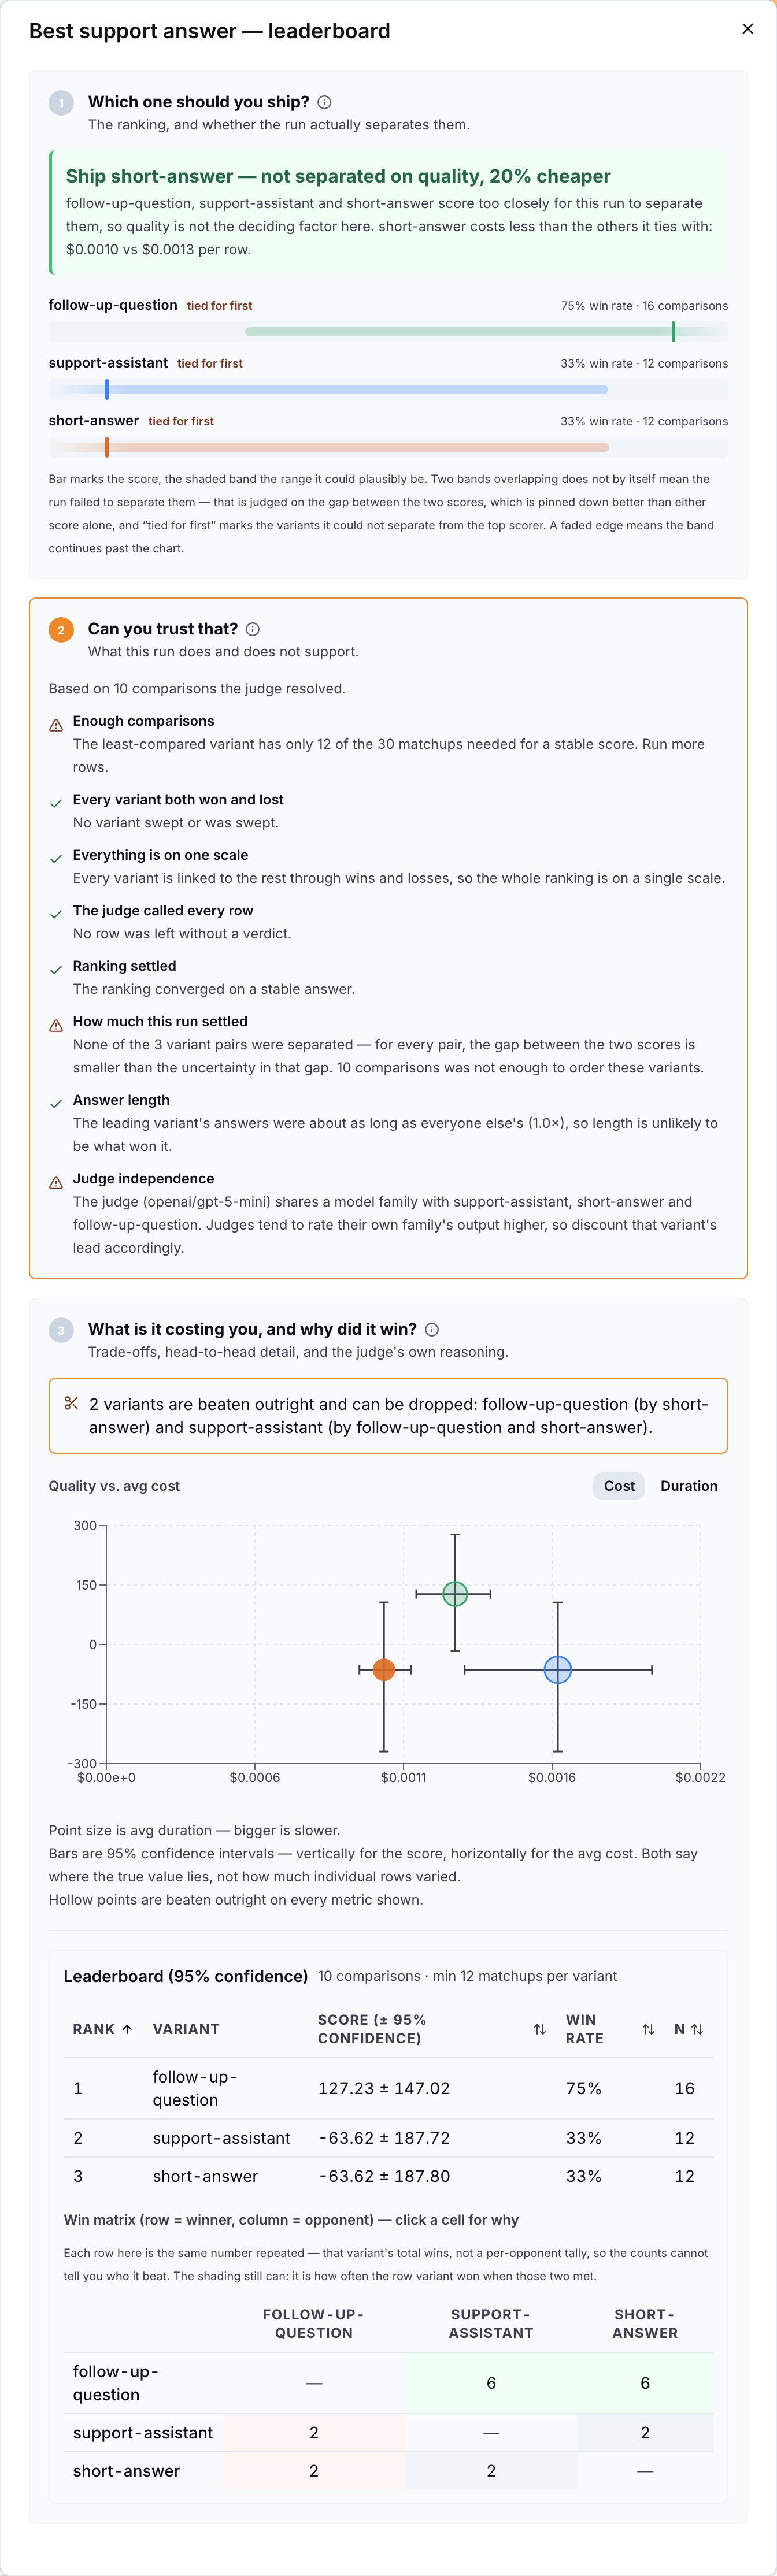
How the score is computed
- Each verdict with a winner counts as one matchup between the winner and each other candidate in it. A verdict over three candidates is two matchups, both won by the winner.
- A tie between two candidates counts as half a win and half a loss for each of them. A tie among three or more candidates adds no matchup.
- A row with no winner, and a row that was skipped because a candidate produced no output, add no matchup.
- Each candidate’s score is fitted from all of its matchups, weighted by how strong its opponents were, so a win against a good candidate counts for more than a win against a weak one.
- The score is on a chess-rating style scale: 0 is the average for this group, and the gap between two scores is what matters. A 400-point gap is roughly 10:1 odds. A confidence interval comes from a bootstrap over the verdicts.
The compact card
The card shows the candidates ranked by score, up to four bars, with a headline that states the conclusion. Click the expand button on the card to open the full leaderboard in a drawer. The drawer has three sections.1. Which one should you ship?
The headline is one of:
Under the headline, each candidate has a bar with its score and a shaded band for the 95% confidence interval. Candidates the run cannot separate from the top scorer are marked tied for first. A candidate that never won or never lost has no fitted score and is marked not scoreable.
2. Can you trust that?
This section reports every check either way, so you can tell a check that passed from a check that never ran. Green is fine, orange needs action, grey is a measurement for you to judge.3. What is it costing you, and why did it win?
The first line states whether any candidate is beaten outright: another candidate is better on quality, cost and speed, or better on some and no worse on the rest. Such a candidate can be dropped. When no candidate is beaten outright, the line says so: the field is a real trade-off and the choice is yours. The scatter plots each candidate’s score against its average cost, or against its average duration when you switch the axis with the Cost and Duration buttons. The metric that is not on the axis is the point size. Error bars are 95% confidence intervals, vertical for the score and horizontal for the cost or duration. Hollow points are beaten outright. Quality is never blended with cost or duration into one number. The ranking table lists Rank, Variant, Score (± 95% confidence), Win rate and N, the number of matchups. Every measure column sorts. The win matrix has one row and one column per candidate. Each cell counts how often the row candidate beat the column candidate, tinted by that pair’s win rate: green when the row candidate won more than half, red when it won less. Click a cell to read the judge’s reasoning for every row where that pair met and the row candidate won. With an N-way judge, every verdict covers all candidates together, so each row of the matrix repeats the same number: the candidate’s total wins. The counts then do not tell you who it beat, but the shading still does, because it is computed per pair. The product says so under the matrix.Settings
Using it from the SDK
Comparison is available from the Python and TypeScript SDKs for code-first experiments. Register one target per candidate in your loop, then compare the row once:evaluation.compare(index) in Python, await evaluation.compare() in TypeScript, which infers the row from the iteration it runs in. The candidates are the targets that recorded an output for that row. The verdict appears on the results page with the same winner column, win-rate chart and leaderboard as a comparison configured in the workbench.
See Experiments via SDK for the full set of judge options, including judging against a reference answer and replacing the judge prompt.
Next steps
Experiments via SDK
Run evaluators programmatically from notebooks or scripts.
View Evaluators
Explore all available evaluation metrics.