
LLM tracing with OpenTelemetry: the GenAI conventions, step by step
Already run OpenTelemetry for the rest of your backend? Here is LLM tracing with the same stack: a small agent traced with the GenAI semantic conventions, the trace in LangWatch, one collector sending it to every backend, and the questions you can ask once it's there.
 Rogerio Chaves · · Integrations
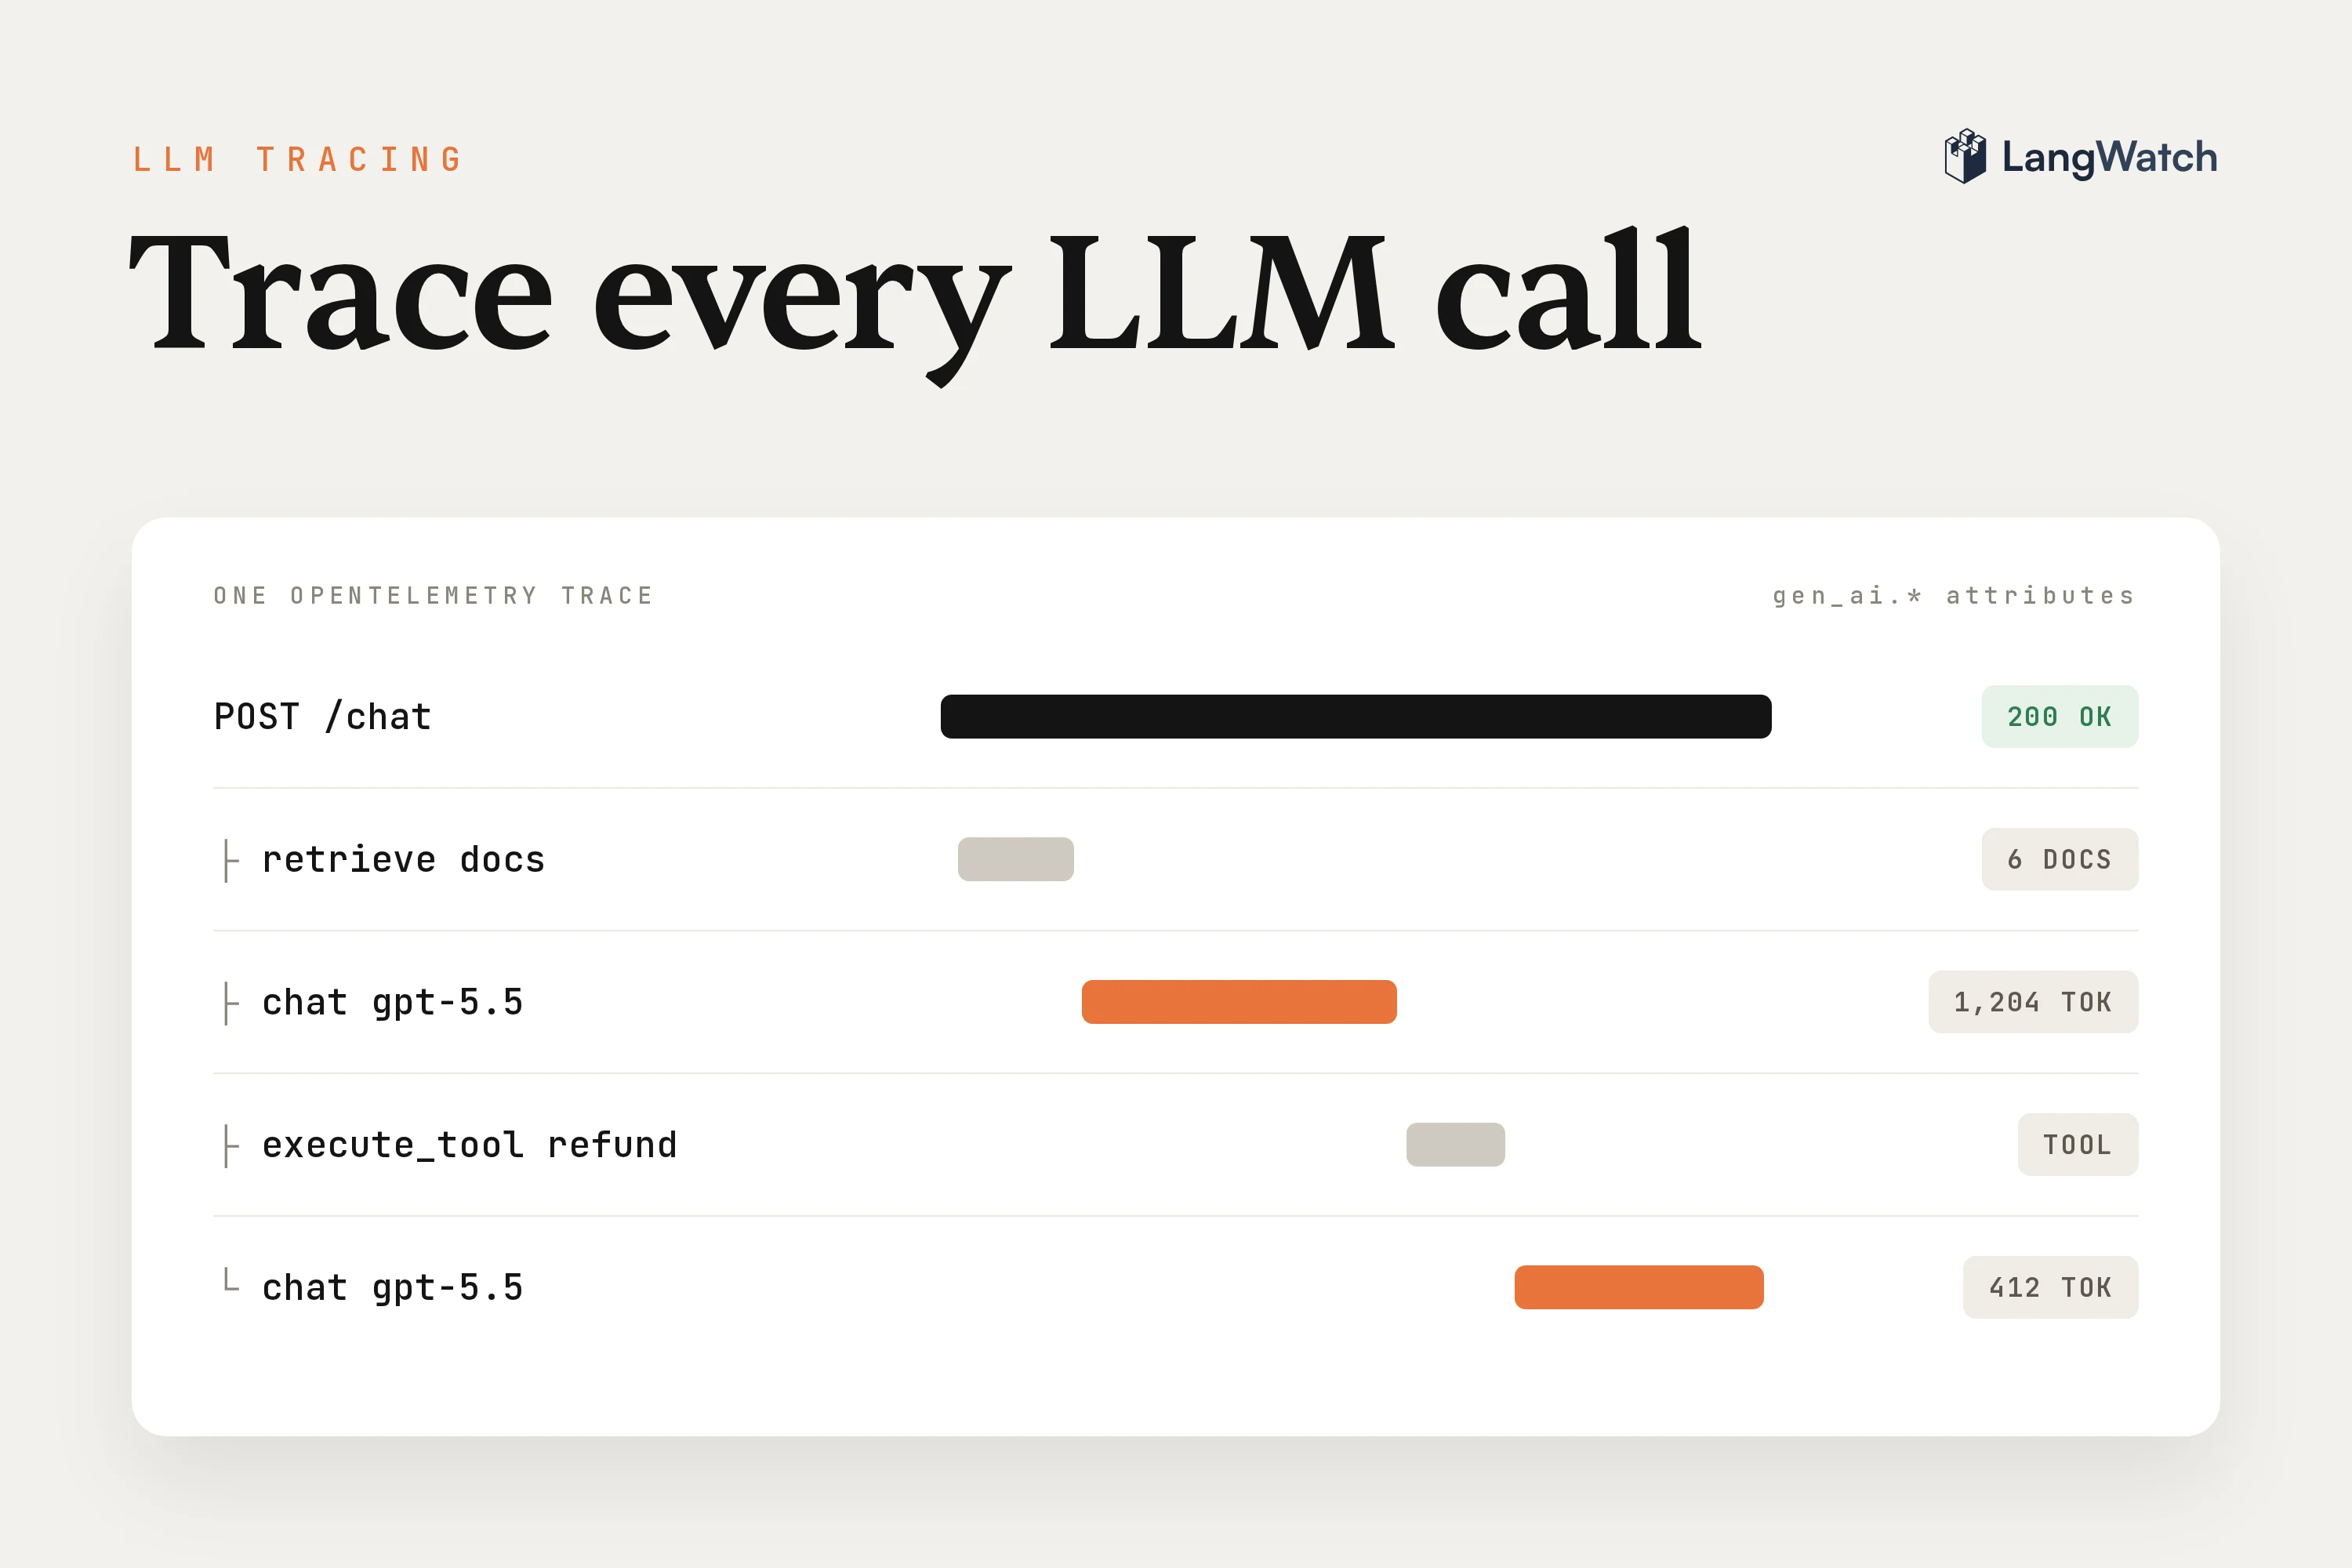
If your team already runs OpenTelemetry for the rest of the backend, the agent you just shipped is probably the one service you can't see into. The HTTP spans show a four-second POST to your model provider, and that's it: no prompt, no model, no tokens, no cost.
You don't need a second tracing stack to fix that. OpenTelemetry has GenAI semantic conventions for exactly this, a shared set of gen_ai.* names for model calls, tools and agents. Tag your spans with them, send them to LangWatch like to any other backend, and that four-second POST turns into a prompt, an answer, a token count and a cost.
Can you trace LLM calls with OpenTelemetry?
Yes. Wrap each model call in a span, tag it with the GenAI attributes (gen_ai.request.model, gen_ai.usage.input_tokens and friends) and export it over OTLP. Send it to https://app.langwatch.ai/api/otel/v1/traces and LangWatch shows each span as an LLM call, with its cost.
Step 1: Point your exporter at LangWatch
Get an API key with npx langwatch login, which writes LANGWATCH_API_KEY to your .env, or create one under Settings > API Keys. Then set the standard OpenTelemetry variables:
export LANGWATCH_API_KEY="sk-lw-..."
export OTEL_EXPORTER_OTLP_TRACES_PROTOCOL="http/protobuf"
export OTEL_EXPORTER_OTLP_TRACES_ENDPOINT="https://app.langwatch.ai/api/otel/v1/traces"
export OTEL_EXPORTER_OTLP_HEADERS="Authorization=Bearer ${LANGWATCH_API_KEY}"
Keep /v1/traces at the end, since the SDK sends to OTEL_EXPORTER_OTLP_TRACES_ENDPOINT exactly as you set it. LangWatch takes OTLP over HTTP, with protobuf or JSON, so if your SDK defaults to gRPC, the protocol line switches it. The OpenTelemetry SDKs for Python, Java, Go, .NET and JavaScript all read these variables, and the OpenTelemetry integration guide has the per-language exporter code too.
Step 2: Trace the agent with plain OpenTelemetry
Here's a small support agent with one tool, traced with nothing but the OpenTelemetry SDK. Every model call gets its own span with the GenAI attributes, the tool call gets one, and an agent span wraps the whole turn:
pip install openai opentelemetry-sdk opentelemetry-exporter-otlp-proto-http
import json

from openai import OpenAI
from opentelemetry import trace
from opentelemetry.exporter.otlp.proto.http.trace_exporter import OTLPSpanExporter
from opentelemetry.sdk.resources import Resource
from opentelemetry.sdk.trace import TracerProvider
from opentelemetry.sdk.trace.export import BatchSpanProcessor

# OTLPSpanExporter reads the endpoint and the headers from the OTEL_EXPORTER_OTLP_* env vars
provider = TracerProvider(resource=Resource.create({"service.name": "support-agent"}))
provider.add_span_processor(BatchSpanProcessor(OTLPSpanExporter()))
trace.set_tracer_provider(provider)

tracer = trace.get_tracer("support-agent")
client = OpenAI()
MODEL = "gpt-5.5"

TOOLS = [{
    "type": "function",
    "function": {
        "name": "get_order_status",
        "description": "Look up the shipping status of an order",
        "parameters": {
            "type": "object",
            "properties": {"order_id": {"type": "string"}},
            "required": ["order_id"],
        },
    },
}]


def chat(messages):
    # One model call, one span, named and tagged the GenAI way
    with tracer.start_as_current_span(f"chat {MODEL}", kind=trace.SpanKind.CLIENT) as span:
        span.set_attribute("gen_ai.operation.name", "chat")
        span.set_attribute("gen_ai.provider.name", "openai")
        span.set_attribute("gen_ai.request.model", MODEL)
        span.set_attribute("gen_ai.input.messages", json.dumps(messages, default=str))

        response = client.chat.completions.create(model=MODEL, messages=messages, tools=TOOLS)
        message = response.choices[0].message

        span.set_attribute("gen_ai.response.model", response.model)
        span.set_attribute("gen_ai.usage.input_tokens", response.usage.prompt_tokens)
        span.set_attribute("gen_ai.usage.output_tokens", response.usage.completion_tokens)
        span.set_attribute("gen_ai.output.messages", json.dumps([message.model_dump(exclude_none=True)]))
        return message


def get_order_status(order_id):
    with tracer.start_as_current_span("execute_tool get_order_status") as span:
        span.set_attribute("gen_ai.operation.name", "execute_tool")
        span.set_attribute("gen_ai.tool.name", "get_order_status")
        return json.dumps({"order_id": order_id, "status": "shipped", "eta": "Thursday"})


def answer(question, conversation_id):
    with tracer.start_as_current_span("invoke_agent support-agent") as span:
        span.set_attribute("gen_ai.operation.name", "invoke_agent")
        span.set_attribute("gen_ai.agent.name", "support-agent")
        span.set_attribute("gen_ai.conversation.id", conversation_id)

        messages = [
            {"role": "system", "content": "You are the support agent of an online shop. Keep it short."},
            {"role": "user", "content": question},
        ]
        message = chat(messages)

        while message.tool_calls:
            messages.append(message.model_dump(exclude_none=True))
            for call in message.tool_calls:
                result = get_order_status(**json.loads(call.function.arguments))
                messages.append({"role": "tool", "tool_call_id": call.id, "content": result})
            message = chat(messages)

        return message.content


if __name__ == "__main__":
    print(answer("Where is my order 4417?", conversation_id="conv-4417"))
    provider.shutdown()
Run it with your OPENAI_API_KEY set, and it prints the answer:
Your order 4417 has shipped and is expected to arrive Thursday.
The GenAI semantic conventions in that code
Every gen_ai.* name above comes from the OpenTelemetry GenAI semantic conventions. These are the ones that matter for LLM tracing:
| Attribute | What it holds | In the run above |
|---|---|---|
gen_ai.operation.name | What the span does | chat, execute_tool, invoke_agent |
gen_ai.provider.name | Who serves the model | openai |
gen_ai.request.model | The model you asked for | gpt-5.5 |
gen_ai.response.model | The model that answered | gpt-5.5-2026-04-23 |
gen_ai.usage.input_tokens | Prompt tokens the provider reported | 154 on the first call |
gen_ai.usage.output_tokens | Completion tokens | 20 on the first call |
gen_ai.conversation.id | The conversation the turn belongs to | conv-4417 |
gen_ai.input.messages, gen_ai.output.messages | The prompt and the answer | The chat messages |
The span names follow the conventions too: {operation} {model} for a model call, execute_tool {tool name} for a tool and invoke_agent {agent name} for the agent. Messages are opt-in in the spec, so instrumentation libraries leave them out until you turn them on. Send them, and you can read every prompt and answer in the trace.
The conventions now live in their own repository, open-telemetry/semantic-conventions-genai, and they're still marked Development, so names keep moving. LangWatch reads the older spellings as well, like gen_ai.usage.prompt_tokens and gen_ai.usage.completion_tokens, plus the attributes from OpenInference and the Vercel AI SDK, so traces from older instrumentation still show their model, tokens and cost.
Step 3: Open the trace in LangWatch
The run is in Trace Explorer within a few seconds, with the question as its input and the answer as its output. LangWatch built this span tree from it:
└── agent: invoke_agent support-agent
    ├── llm: chat gpt-5.5 (gpt-5.5-2026-04-23)
    ├── llm: chat gpt-5.5 (gpt-5.5-2026-04-23)
    └── tool: execute_tool get_order_status
Nothing in the code says which span is an LLM call. LangWatch reads gen_ai.operation.name and the model attributes, so the agent span became an agent, the tool span a tool, and both model calls LLM spans with their model and tokens.
There's no cost attribute in the code either. LangWatch adds up the tokens of both calls and looks up the cost in its table of 350+ models, synced with the providers' public rates every day. Click any trace to open it in the drawer. This one is a single gen_ai.chat call:
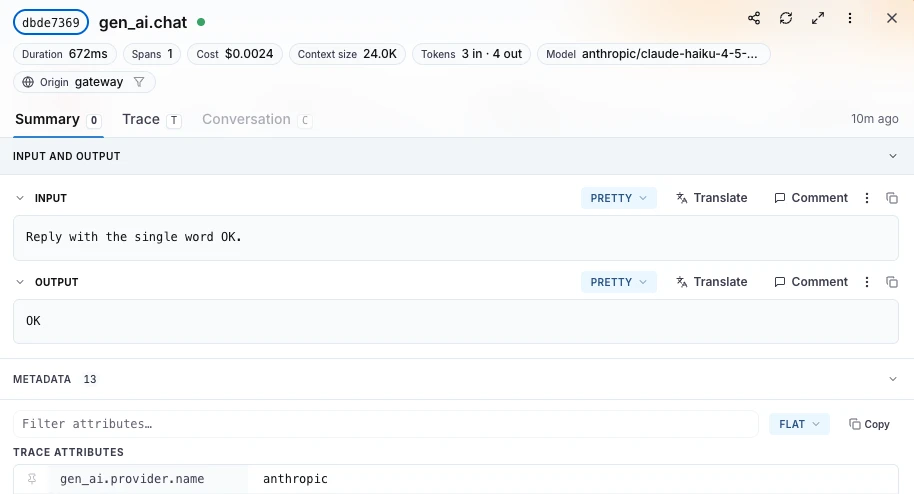
The chips at the top give you the duration, cost, tokens and model at a glance. Trace shows the spans as a waterfall, Conversation shows every turn with the same gen_ai.conversation.id, and under Metadata you find every attribute you sent, gen_ai.* included. The cost tracking docs list every token attribute LangWatch reads, cache reads and writes included.
Step 4: Search and filter your traces
In the search bar at the top of Trace Explorer you can filter on any OpenTelemetry attribute you send. I ran these on the traces from step 2:
model:gpt-5.5*
span.attribute.gen_ai.tool.name:get_order_status
trace.attribute.gen_ai.agent.name:support-agent
The first finds every trace that called the model, the second every trace where the agent looked up an order, and the third every turn of that one agent. You can combine conditions with AND, like status:error AND service:checkout AND duration:>2000 for the slow errors of a checkout service, and the sidebar filters by status, user, conversation, duration, cost, tokens and model:
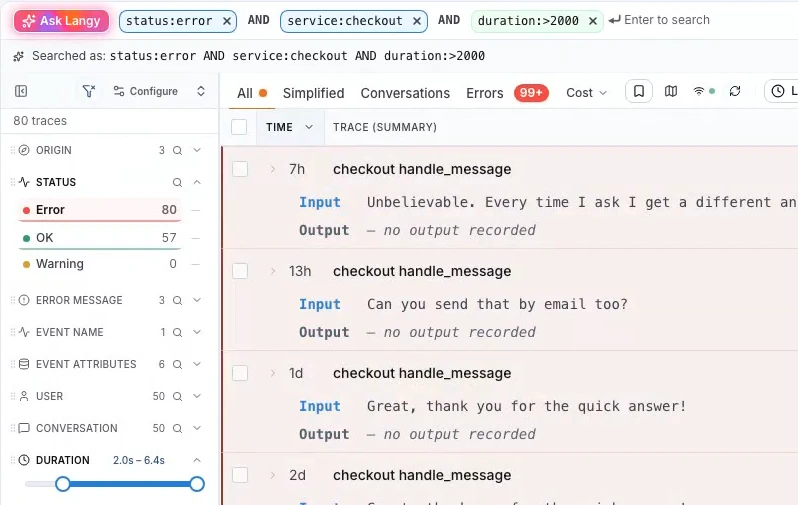
To filter by user, add langwatch.user.id to the agent span next to gen_ai.conversation.id. LangWatch also reads langwatch.customer.id for your tenant and langwatch.labels for tags, and the metadata and labels docs show each one in raw OpenTelemetry.
Use OpenLLMetry, OpenInference or the LangWatch SDK instead
Hand-written spans are great for learning the conventions and for code no library covers. For the usual providers and frameworks, an instrumentor writes them for you.
OpenLLMetry and OpenInference are open-source sets of OpenTelemetry instrumentors for providers, frameworks and vector databases. The LangWatch Python SDK is built on OpenTelemetry and runs any instrumentor that follows the standard BaseInstrumentor interface, so you hand it over in langwatch.setup():
pip install langwatch openai opentelemetry-instrumentation-openai
import langwatch
from openai import OpenAI
from opentelemetry.instrumentation.openai import OpenAIInstrumentor

langwatch.setup(instrumentors=[OpenAIInstrumentor()])  # reads LANGWATCH_API_KEY
client = OpenAI()


@langwatch.trace(name="support-agent")
def answer(question: str) -> str:
    response = client.chat.completions.create(
        model="gpt-5.5",
        messages=[{"role": "user", "content": question}],
    )
    return response.choices[0].message.content


print(answer("Can I change the delivery address of order 4417?"))
The import above comes from OpenLLMetry. For OpenInference, install openinference-instrumentation-openai and import OpenAIInstrumentor from openinference.instrumentation.openai. Either way you get the same LLM span in LangWatch, with the reasoning tokens counted apart when the model reports them. The other instrumentors page has the list, and the quick start covers the LangWatch SDKs for Python, TypeScript and Go.
The SDK spans are still OpenTelemetry spans, so you can send them to any other backend too.
Step 5: Send one trace to LangWatch and your other backend
On a platform team you rarely want every app to know about every backend. Put an OpenTelemetry Collector in the middle: the apps send OTLP to the collector, and the collector fans each trace out to LangWatch and to the backend you already run, like Grafana Tempo or Jaeger.
receivers:
  otlp:
    protocols:
      grpc:
        endpoint: 0.0.0.0:4317
      http:
        endpoint: 0.0.0.0:4318

processors:
  batch:

exporters:
  otlp_http/langwatch:
    traces_endpoint: https://app.langwatch.ai/api/otel/v1/traces
    headers:
      Authorization: "Bearer ${env:LANGWATCH_API_KEY}"
  otlp_grpc/tempo:
    endpoint: tempo:4317
    tls:
      insecure: true

service:
  pipelines:
    traces:
      receivers: [otlp]
      processors: [batch]
      exporters: [otlp_http/langwatch, otlp_grpc/tempo]
Then point each app at the collector instead of LangWatch, with OTEL_EXPORTER_OTLP_TRACES_ENDPOINT=http://<collector>:4318/v1/traces and no auth header, since the collector holds the key. I ran the agent from step 2 through this config on the 0.164.0 collector, and the same four spans landed in LangWatch and in the second exporter.
Use traces_endpoint with the full URL for LangWatch: the plain endpoint setting adds /v1/traces to whatever you give it. The collector also takes gRPC from your apps and sends OTLP over HTTP to LangWatch, which helps when an SDK only speaks gRPC.
When one app runs the LangWatch SDK next to another OpenTelemetry SDK in the same process, give LangWatch its own TracerProvider, so neither tool picks up the other's spans:
from opentelemetry.sdk.trace import TracerProvider
import langwatch

langwatch_provider = TracerProvider()
langwatch.setup(tracer_provider=langwatch_provider)
The multiple OTel providers docs cover the TypeScript version and a filtering option when you'd rather share one provider.
How do I monitor my AI chatbot's performance?
An Instant Eval is a question in plain words that LangWatch judges against every trace in the time window. Type it right in the Trace Explorer search bar:
eval:"is the user annoyed with the answer"
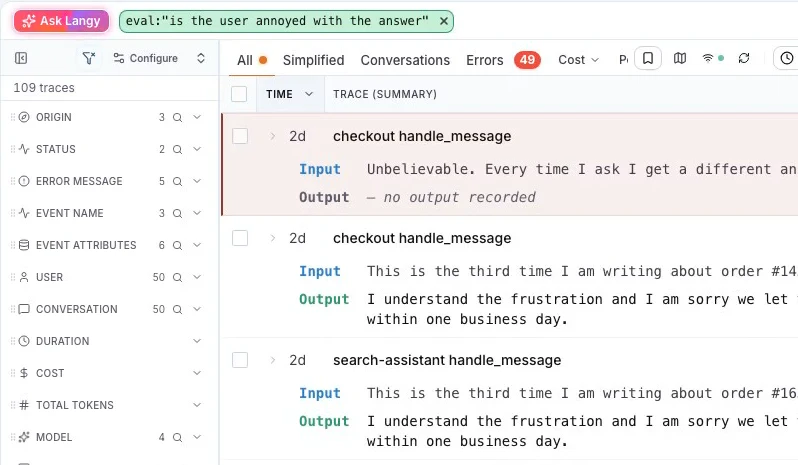
Then try one about what would hurt this agent, like eval:"the agent gave a delivery date it never looked up". Judging ten thousand traces takes about a minute, so the rare bad answer is in the result instead of hiding outside a sample. Instant Evals can also judge whole conversations, and a conversation is every trace with the same gen_ai.conversation.id, so that attribute from step 2 pays off here.
For numbers across many traces, use LangWatch SQL. This is the spend and tokens per model over the last week, which I ran on the same project:
SELECT
  Model,
  sum(CostSum) AS cost_usd,
  sum(PromptTokensSum + CompletionTokensSum) AS tokens
FROM langwatch.model_usage_by_minute
WHERE BucketStart >= subtractDays(now(), 7)
GROUP BY Model
ORDER BY cost_usd DESC
LIMIT 50
Run it from the CLI with langwatch query, or see querying your data for the REST endpoint and the trace filter reference.
Last, turn a search into an alert. Filter the Trace Explorer down to what you care about, like status:error AND model:gpt-5.5*, click Automate, and LangWatch sends you a Slack message or an email for every new trace that matches, or adds it to a dataset. See alerts and automations.
Put this into production with LangWatch.
Trace your agents, run evaluations, and turn failures into repeatable tests.
Frequently asked questions
- What is LLM tracing?
- LLM tracing records every step of a request to your LLM app as spans in one trace: each model call with its model, prompt, answer, tokens and cost, each tool call, and the agent step around them. You open one trace to see why an answer came out the way it did, and you search across traces to find patterns.
- What are the OpenTelemetry GenAI semantic conventions?
- They are the shared names OpenTelemetry defines for generative AI telemetry: gen_ai.operation.name, gen_ai.request.model, gen_ai.usage.input_tokens, gen_ai.usage.output_tokens, gen_ai.conversation.id and more, plus span names like chat gpt-5.5 and invoke_agent support-agent. They live in the open-telemetry/semantic-conventions-genai repository and are marked Development.
- What is OpenLLMetry?
- OpenLLMetry is an open-source set of OpenTelemetry instrumentors for LLM providers, frameworks and vector databases. Each one patches a library, like the OpenAI SDK, so its calls become spans without hand-written code. In Python you pass one to langwatch.setup(instrumentors=[...]) and its spans go to LangWatch.
- Does LangWatch accept OTLP over gRPC?
- No. The LangWatch endpoint https://app.langwatch.ai/api/otel/v1/traces takes OTLP over HTTP, with protobuf or JSON bodies. Set your exporter to http/protobuf, or put an OpenTelemetry Collector in between that receives gRPC and exports OTLP over HTTP to LangWatch.
- Can I send the same traces to LangWatch and to another tracing backend?
- Yes. Run an OpenTelemetry Collector with two exporters in the same traces pipeline: an otlp_http exporter for LangWatch and one for your other backend, like Grafana Tempo or Jaeger. Every trace your apps send to the collector goes to both.