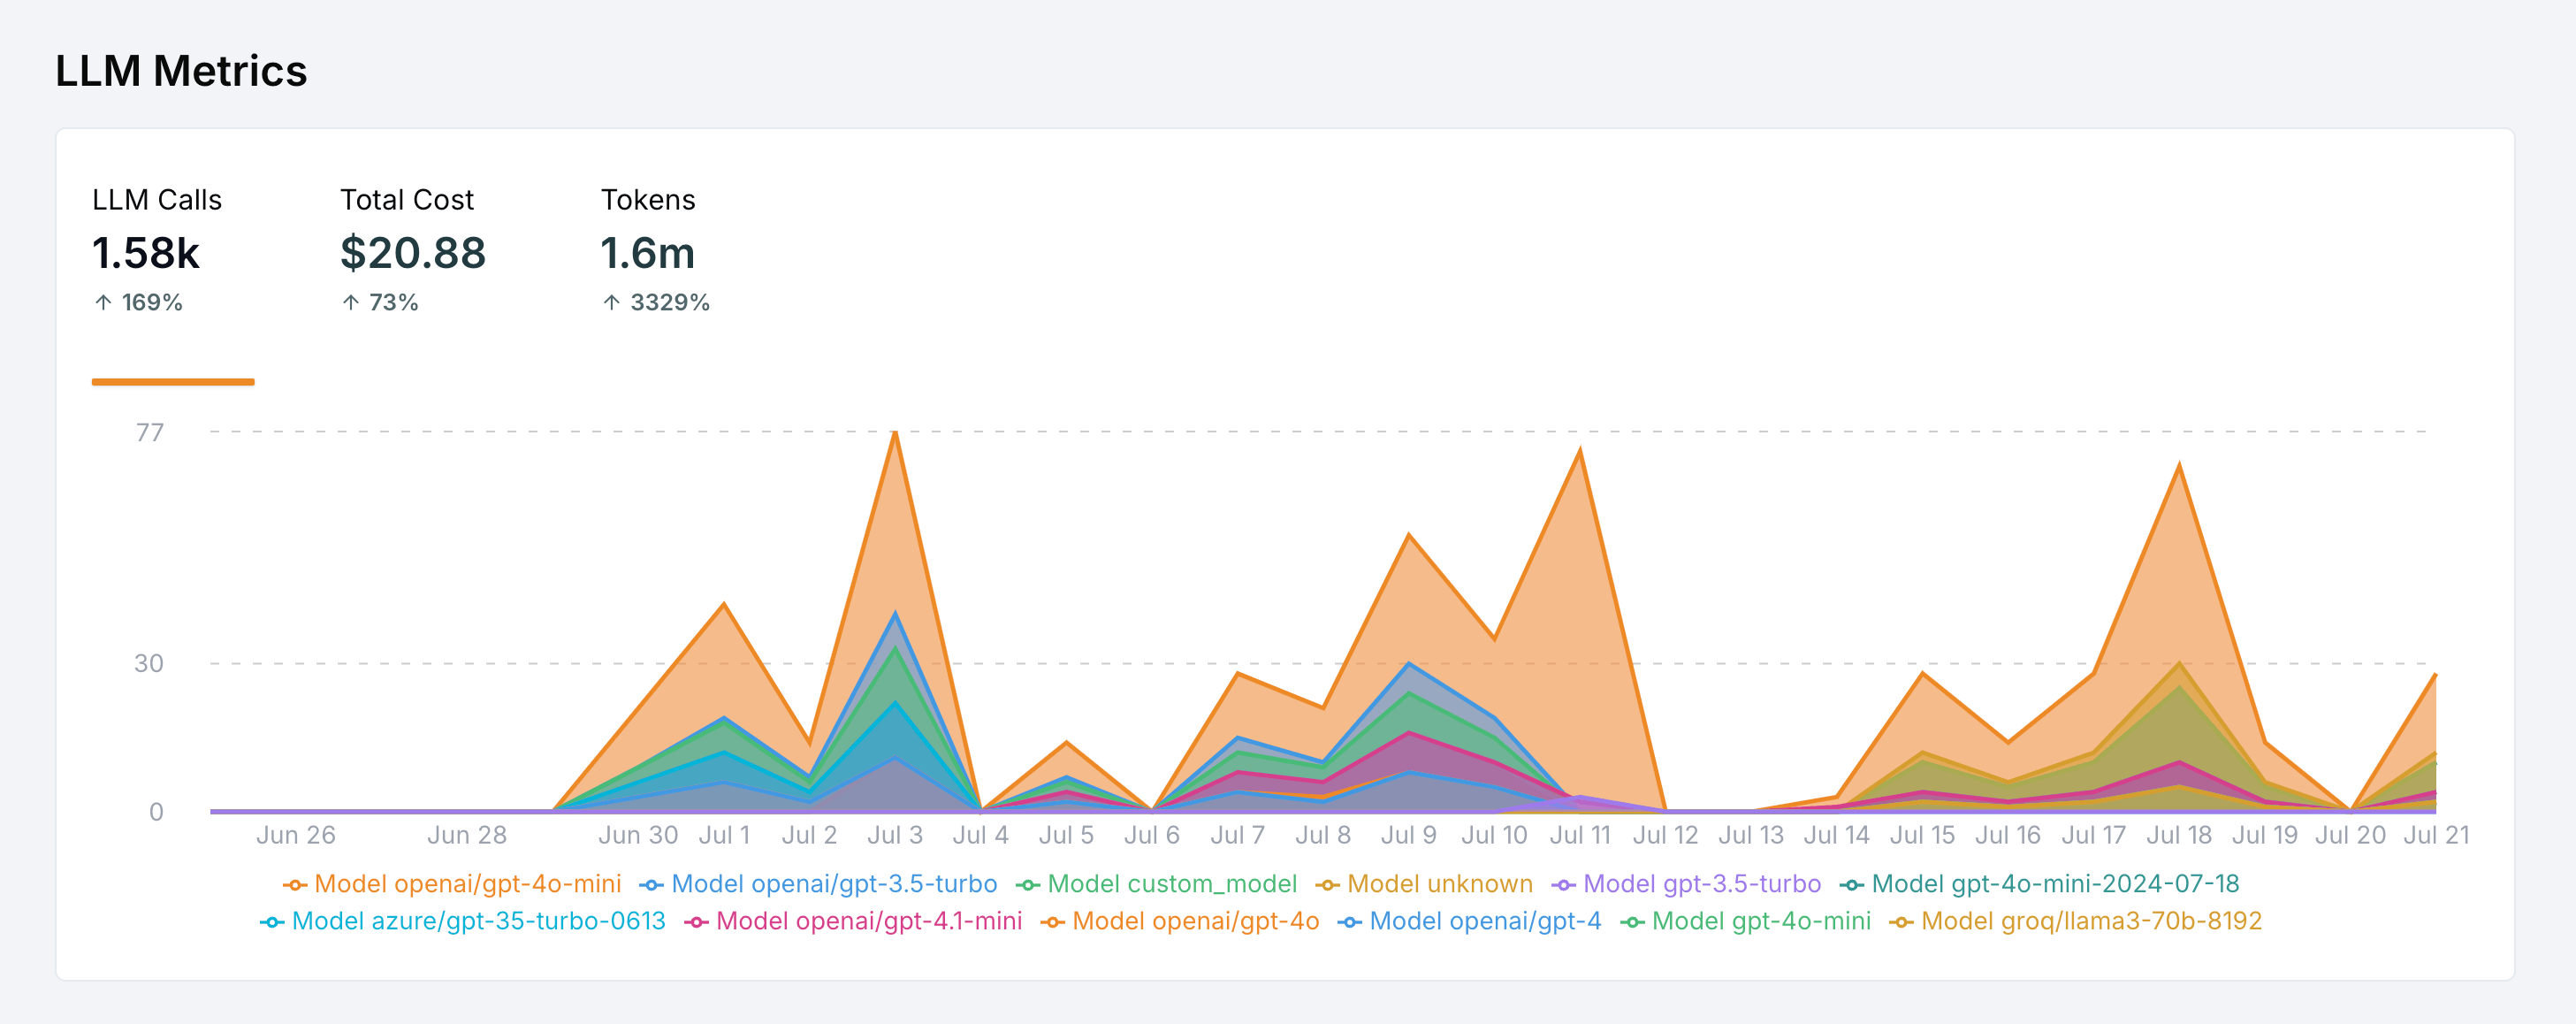
How cost calculation works
LangWatch calculates costs in three steps:- Capture the model name from the LLM span (e.g.
openai/gpt-5-mini) - Capture token usage from the span’s attributes, or estimate it when missing
- Multiply by the model’s per-token prices from the pricing registry in Settings > Model Costs
The model price registry
LangWatch ships a registry of 350+ models with input, output, cache read, and cache write prices per token. Prices are checked every day against the providers’ public pricing and the registry is updated as soon as a price or model changes, so the costs you see track what providers actually charge.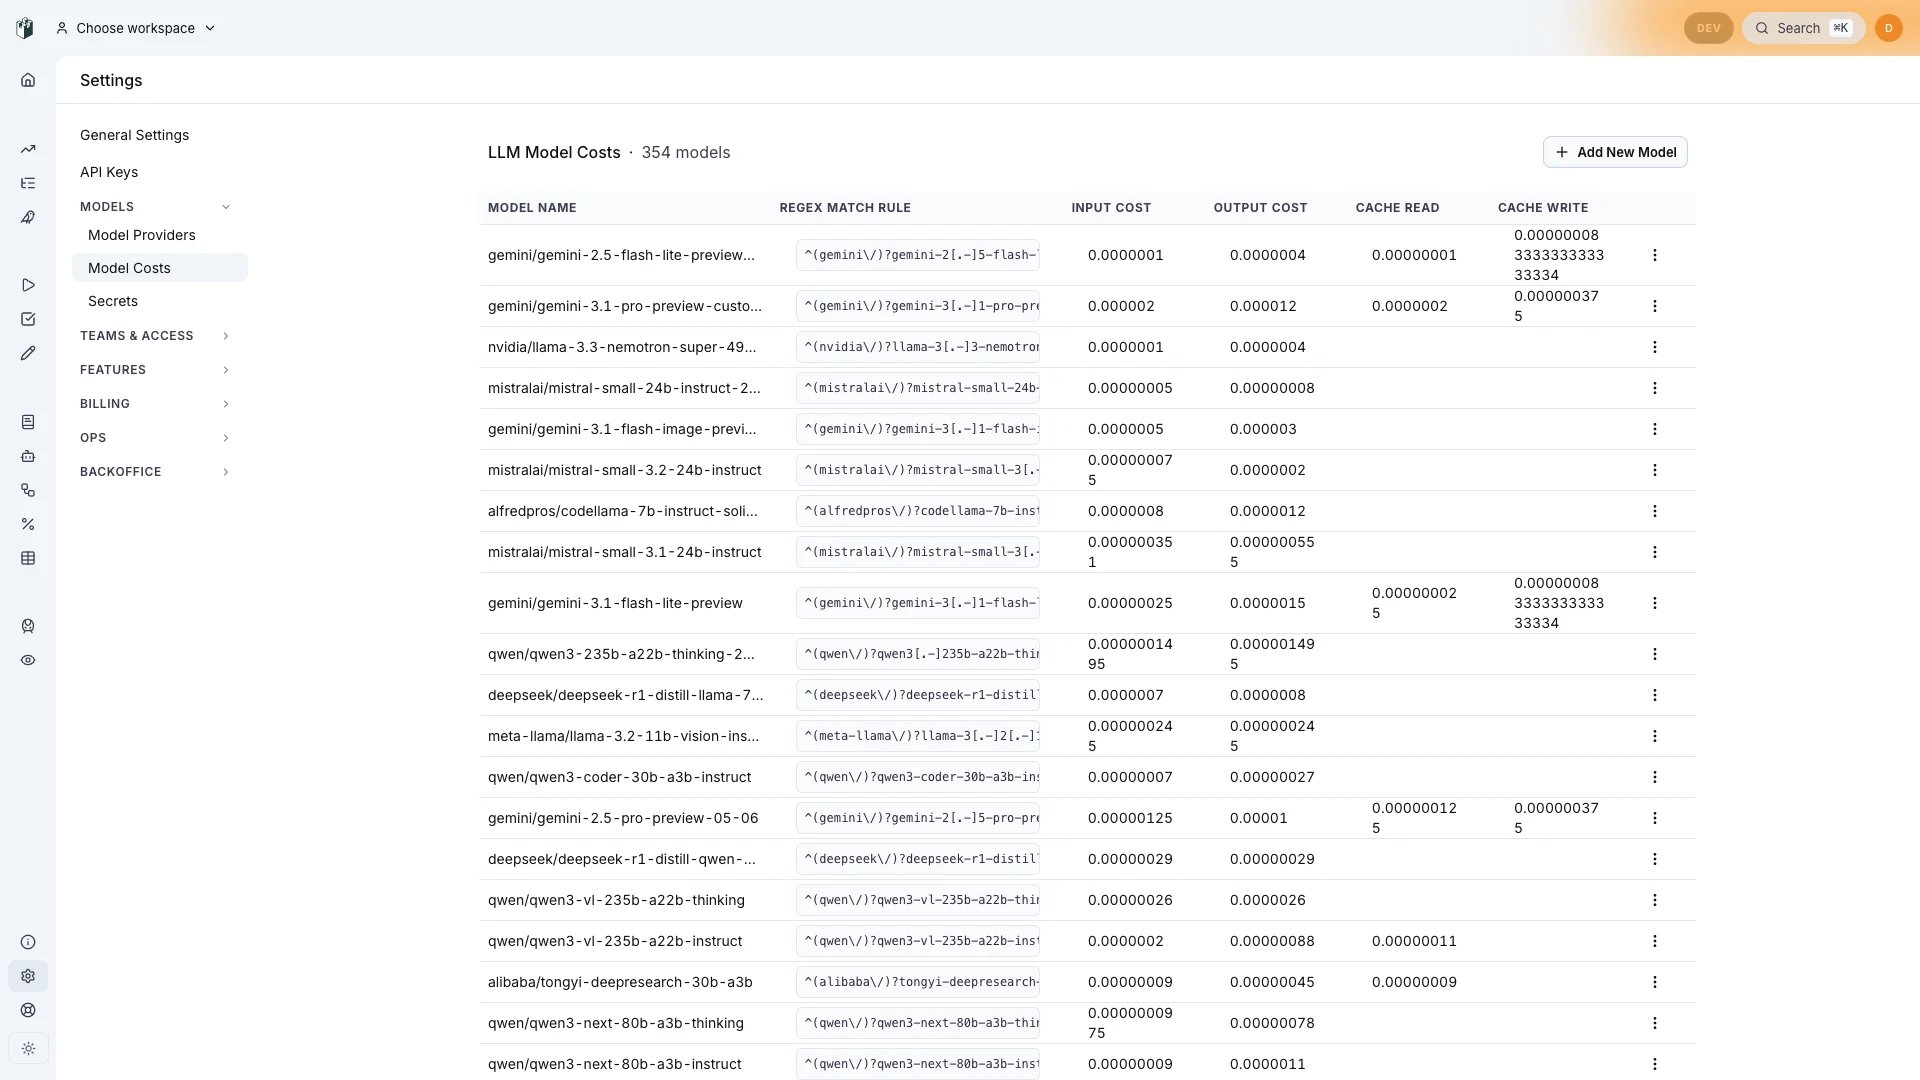
gpt-5-mini, openai/gpt-5-mini, openai.responses/gpt-5-mini). Bedrock-style identifiers like eu.anthropic.claude-sonnet-4-5-20250929-v1:0 are normalized and matched too.
If a model isn’t in the registry, LangWatch does not invent a price: the cost shows as $0 until you add a custom entry (see Custom model costs).
Which tokens are captured
LangWatch captures the full token breakdown reported by your LLM provider:| Token type | What it is | Pricing |
|---|---|---|
| Input tokens | The prompt sent to the model | Input rate |
| Output tokens | The completion generated by the model | Output rate |
| Cache read tokens | Prompt tokens served from the provider’s prompt cache | Cache read rate (falls back to input rate) |
| Cache write tokens | Prompt tokens written into the provider’s prompt cache | Cache write rate (falls back to input rate) |
| Reasoning tokens | Thinking tokens from reasoning models (o-series, Claude extended thinking, etc.) | Already included in the provider’s output token count, so they are billed as output tokens; LangWatch captures the breakdown separately so you can see how much of the output was reasoning |
OpenTelemetry attributes reference
If you use OpenTelemetry instrumentation directly (or want to patch what a framework emits), these are the span attributes LangWatch reads, in their order of precedence:| Data | Attributes |
|---|---|
| Input tokens | gen_ai.usage.input_tokens, gen_ai.usage.prompt_tokens, ai.usage.promptTokens (Vercel), llm.token_count.prompt (OpenInference) |
| Output tokens | gen_ai.usage.output_tokens, gen_ai.usage.completion_tokens, ai.usage.completionTokens (Vercel), llm.token_count.completion (OpenInference) |
| Cache read tokens | gen_ai.usage.cache_read.input_tokens, gen_ai.usage.cached_tokens, llm.token_count.prompt_details.cache_read (OpenInference) |
| Cache write tokens | gen_ai.usage.cache_creation.input_tokens, llm.token_count.prompt_details.cache_write (OpenInference) |
| Reasoning tokens | gen_ai.usage.reasoning_tokens, llm.token_count.completion_details.reasoning (OpenInference) |
| Model | gen_ai.response.model, gen_ai.request.model |
| Pre-computed cost | langwatch.span.cost (a number, in USD) |
When token counts are missing
Some providers and frameworks don’t report usage on streamed responses, and some integrations drop it. When an LLM span arrives with the model and input/output captured but no token counts, LangWatch estimates them by tokenizing the captured input and output text with OpenAI’so200k_base encoding, the same tokenizer used by the GPT-5 model family.
Estimated tokens (and the costs computed from them) are marked with a ~ prefix in the UI, so you always know which numbers are exact and which are approximations. Exact counts reported by your provider always win over estimation.
Adjusting tokens and costs manually
If automatic capture doesn’t fit your setup, a proxy strips usage data, a provider isn’t supported, or you negotiate custom pricing, you can set token counts and cost explicitly with the Python SDK:cost is set, it is used as-is, even for a known model with token counts: an explicit cost is treated as authoritative and overrides the registry calculation. When only token counts are set, LangWatch multiplies them by the model’s registry prices as usual.
Custom model costs
For self-hosted models, fine-tunes, or negotiated pricing, add your own entries in Settings > Model Costs:- Click “Add New Model”
- Configure the entry:
- Model Name: descriptive name (e.g.
my-custom-model-v1) - Regex Match Rule: pattern matching your model identifier (e.g.
^my-custom-model-v1$) - Input / Output Cost: price per token
- Cache Read / Cache Write Cost: optional cache rates
- Model Name: descriptive name (e.g.
Common model identifier patterns
Make sure your regex matches how the model name appears in your spans:| Framework | Model Identifier Format | Regex Pattern |
|---|---|---|
| OpenAI SDK | gpt-5 | ^gpt-5$ |
| Azure OpenAI | gpt-5 | ^gpt-5$ |
| LangChain | openai/gpt-5 | ^openai/gpt-5$ |
| Custom | my-custom-model-v1 | ^my-custom-model-v1$ |
Troubleshooting
Costs show $0 or are missing
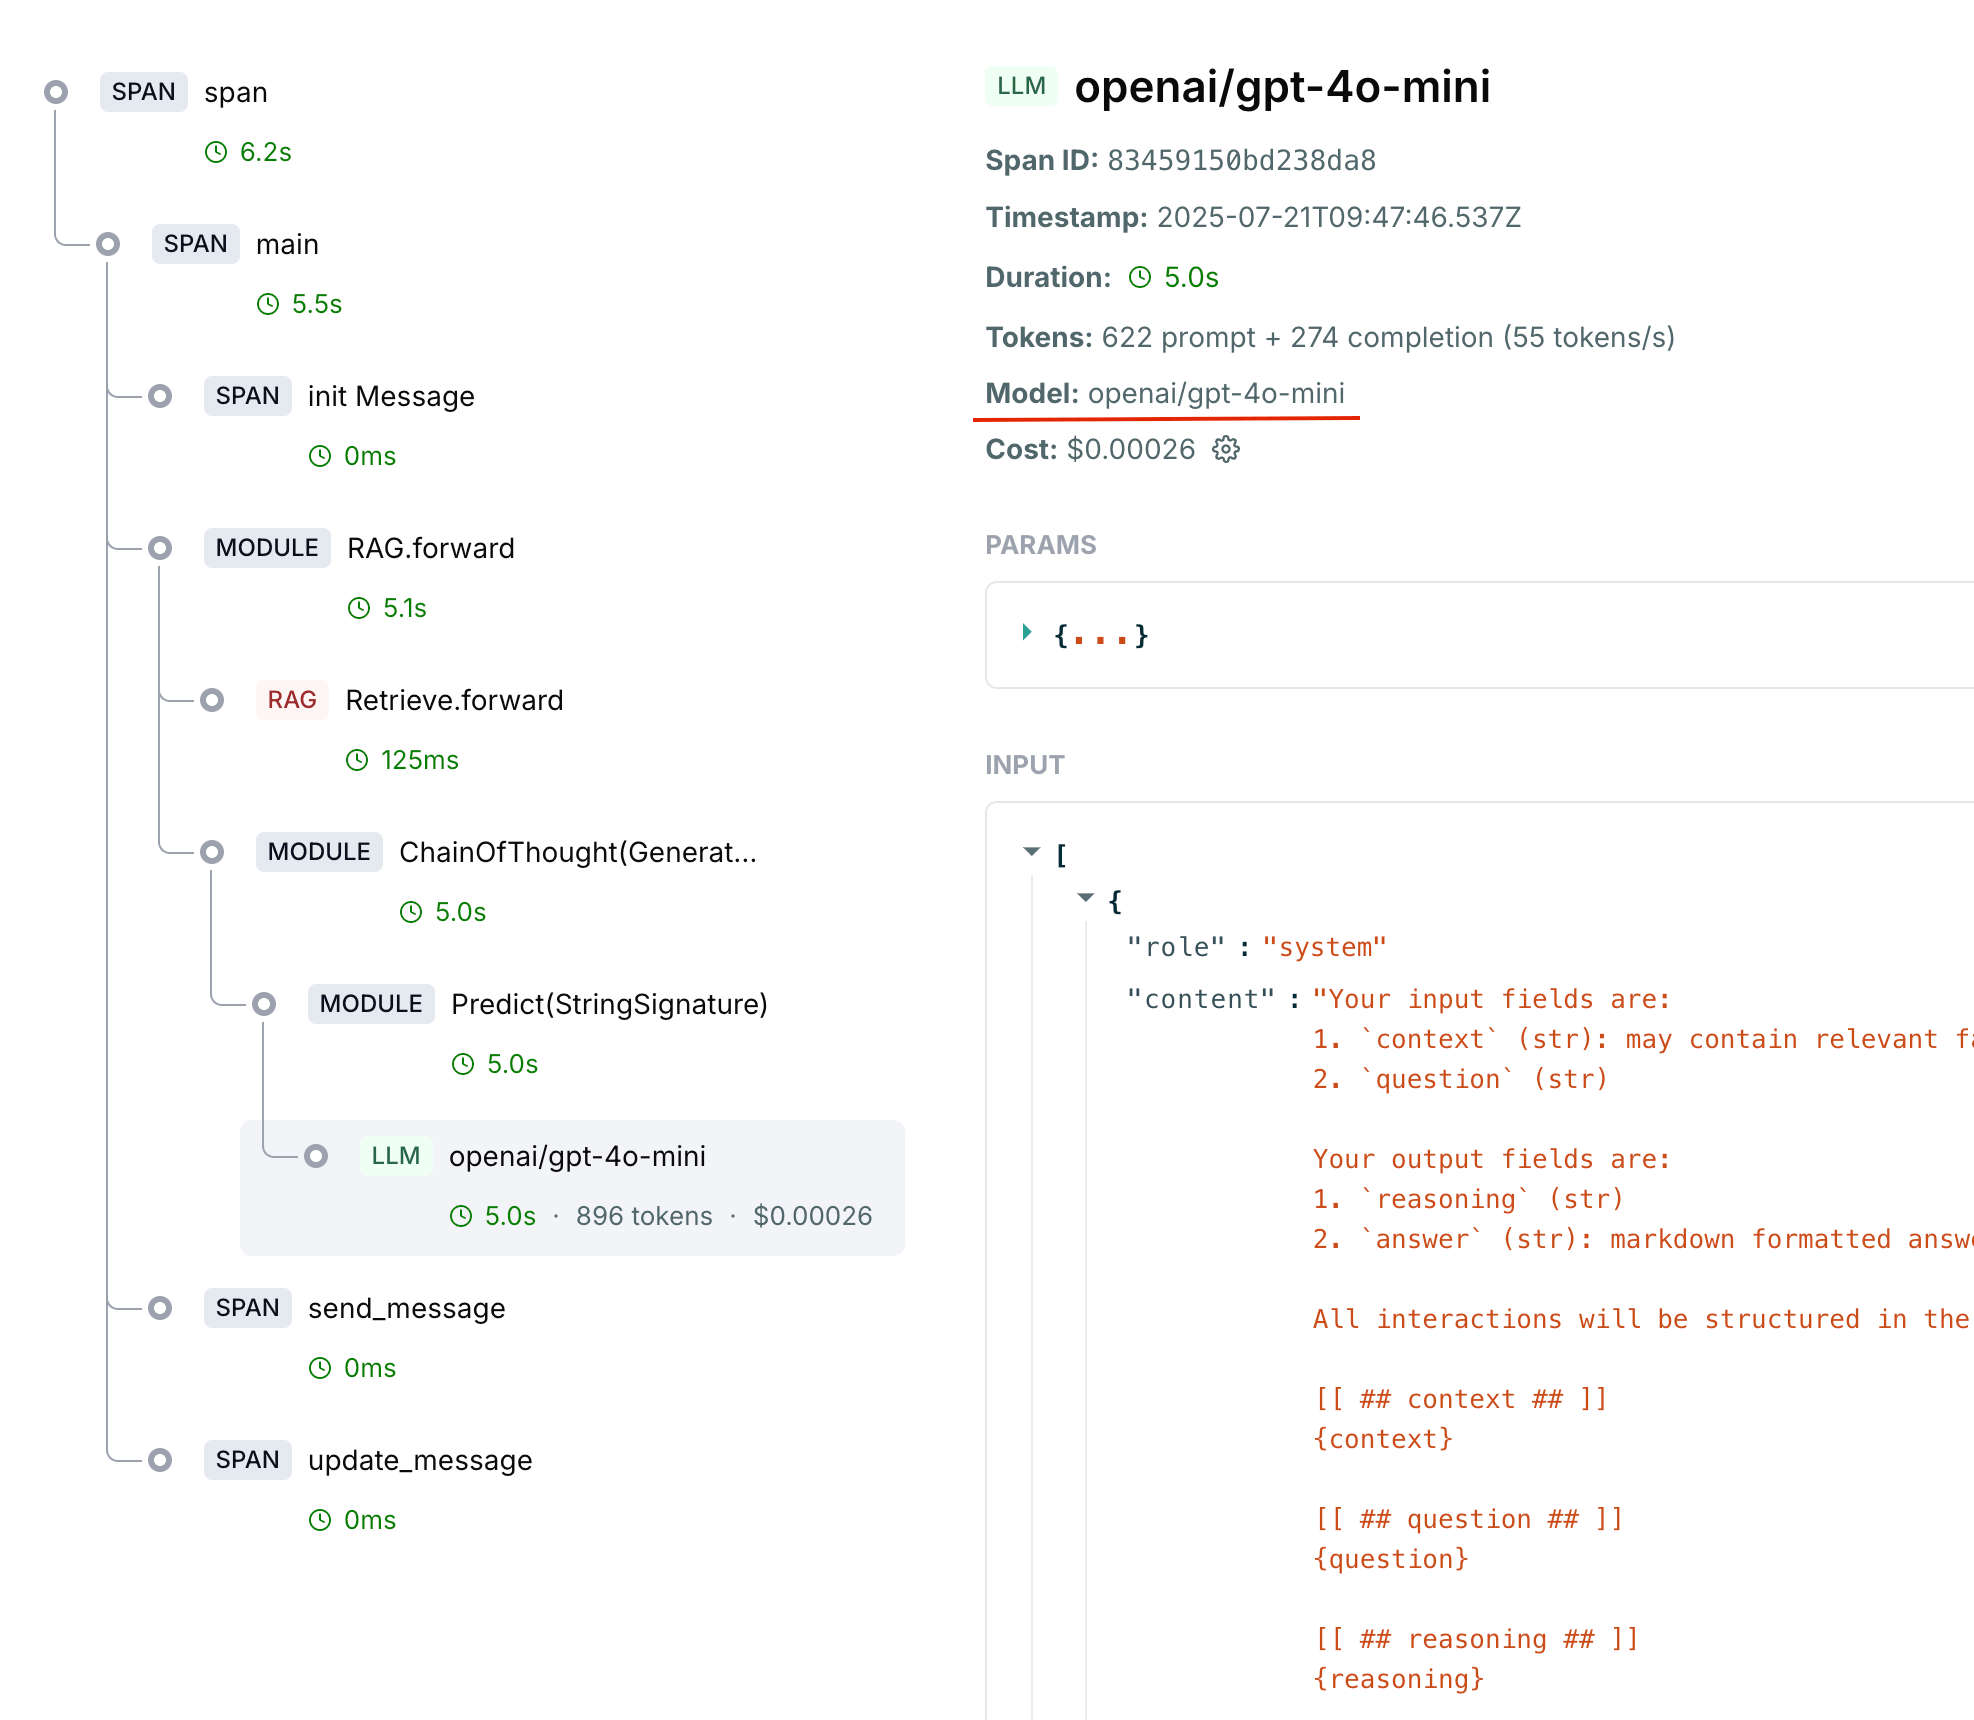
- Open a trace that should have cost data and click the LLM span
- Check these fields:
- Model: must show the model identifier (e.g.
openai/gpt-5) - Input/Output: must contain the captured messages
- Metrics: must show prompt + completion tokens
- Model: must show the model identifier (e.g.
- Model missing: your framework isn’t capturing it. Use the framework auto-tracking from the Integrations menu, or set it manually with
update(model=...)as shown above. - Model present but cost is $0: the model isn’t matching the registry. Check Settings > Model Costs, the regex must match your exact model identifier. Add a custom entry if it’s not there.
- Tokens are 0 but model is captured: your provider isn’t returning usage (common with streaming). Either enable usage on streaming (e.g.
stream_options={"include_usage": True}for OpenAI), set metrics manually, or let LangWatch estimate them from the captured text. - Tokens show but with a
~: they were estimated by the tokenizer because the provider didn’t report exact counts. This is expected; report exact counts to remove the marker.
Auto-tracking not working
Symptoms: spans appear but without model/metrics data- Ensure
autotrack_*()is called on an active trace - Check that the client instance being tracked is the same one making calls
- Verify the integration is initialized correctly
Getting Help
If you’re still experiencing issues after following this guide:- Check the LangWatch logs for any error messages
- Verify your API key and endpoint configuration
- Share a minimal reproduction with the specific framework you’re using
- Contact support at support@langwatch.ai with:
- Your integration method (SDK, OpenTelemetry, etc.)
- Framework versions
- Sample span data from the dashboard