/ops/dejaview) is a time-travel debugger for LangWatch’s event-sourcing system. It lets you search for any aggregate, inspect its full event history, and compute any projection’s state at any point in that history, all from a single interface.
When to Use Deja View
- Debugging projection state: “Why does this trace show the wrong evaluation result?” Look at the events and compute the projection to see where state diverged.
- Investigating processing failures: Find the aggregate, check what events were stored, and identify whether the issue is in the events or the projection.
- Auditing: Review the complete history of any aggregate: every event that happened, in order.
- Verifying a replay: After running a projection replay, check that the rebuilt state looks correct.
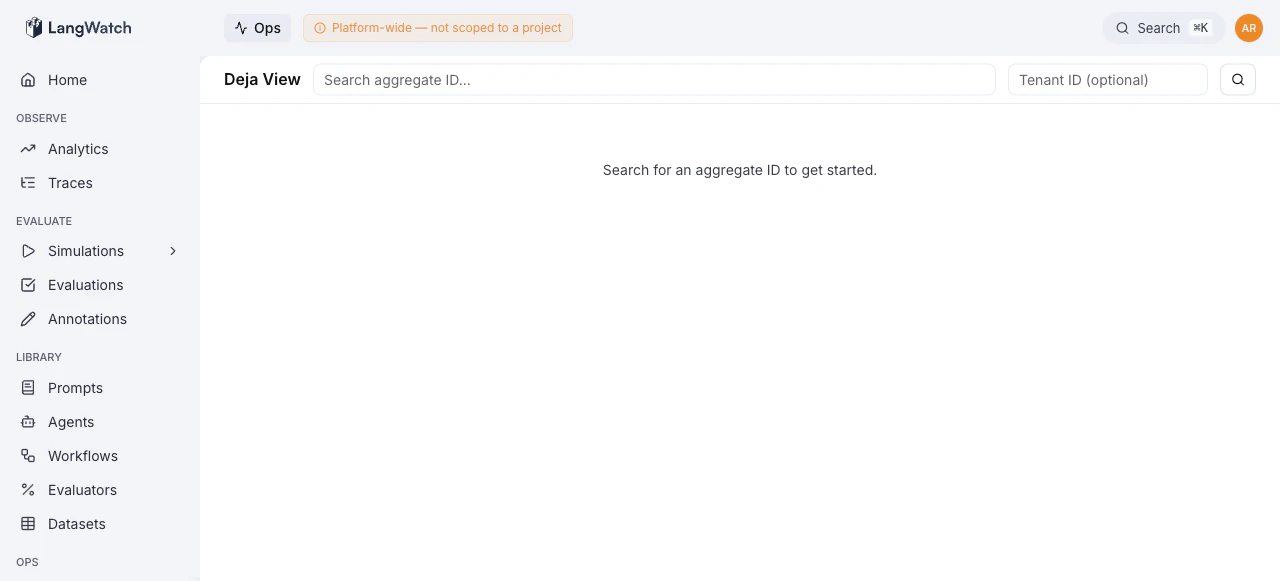
Searching for Aggregates
The search bar at the top accepts:- Aggregate ID (required), the primary key of the aggregate you’re looking for
- Tenant ID (optional), filter to a specific project/tenant
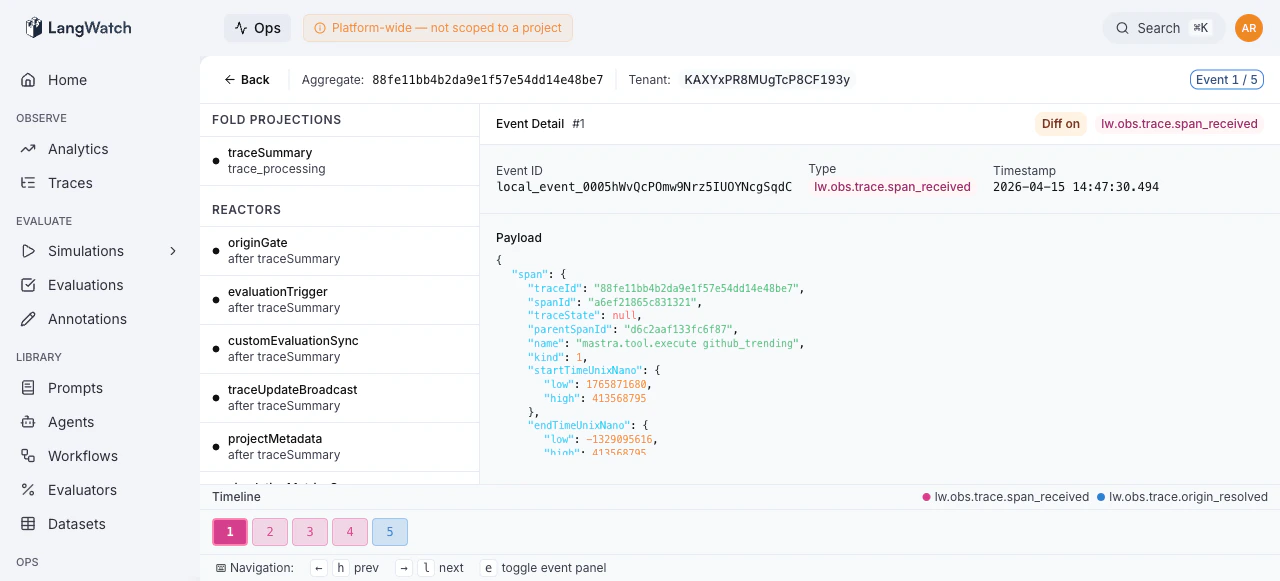
Event Timeline
Once an aggregate is selected, the bottom of the screen shows a horizontal event timeline: a color-coded sequence of numbered event boxes.- Each box represents one event, numbered sequentially
- Colors are assigned by event type, with a legend at the top
- The current event is highlighted with a border
- Click any event to jump to it, or use keyboard shortcuts to navigate
Keyboard Shortcuts
Event Payload
The center panel shows the current event’s payload. Toggle between:- Raw view: the complete event data structure
- Diff view: shows what changed compared to the previous event
e or click the toggle to open a detailed JSON viewer in the right panel for deeply nested event payloads.
Projection State
The left panel lists all available projections and reactors for the aggregate type. Select a projection to compute its state at the current event position. This is the core of the time-travel capability: you can step through events and watch how a projection’s state evolves with each event. For example:- Select a projection (e.g., “TraceAnalytics”)
- Navigate to event #5, see the projection state after events 1-5
- Step forward to event #6, see how the state changed
- Compare with the current state to identify where things went wrong
Deep Linking
Deja View encodes its full state in the URL fragment, making every view shareable:Common Workflows
”Why is this trace’s evaluation wrong?”
- Search for the trace’s aggregate ID
- Select the evaluation projection
- Step through events to find where the evaluation result was computed
- Check the event payload, is the input data correct?
- Check the projection state, does the fold logic produce the expected result?
”Did the replay fix this aggregate?”
- After running a projection replay, search for the aggregate
- Select the replayed projection
- Navigate to the latest event
- Verify the projection state matches expectations
”What happened to this aggregate at 2pm yesterday?”
- Search for the aggregate ID
- Use the event timeline to find events around that timestamp
- Step through them to see the sequence of state changes