/ops/foundry) is an interactive trace builder and sender. It lets you construct complete trace hierarchies, LLM calls, tool invocations, RAG retrievals, agent steps, and send them to any LangWatch project. Use it to test ingestion pipelines, reproduce issues, or generate sample data.
Layout
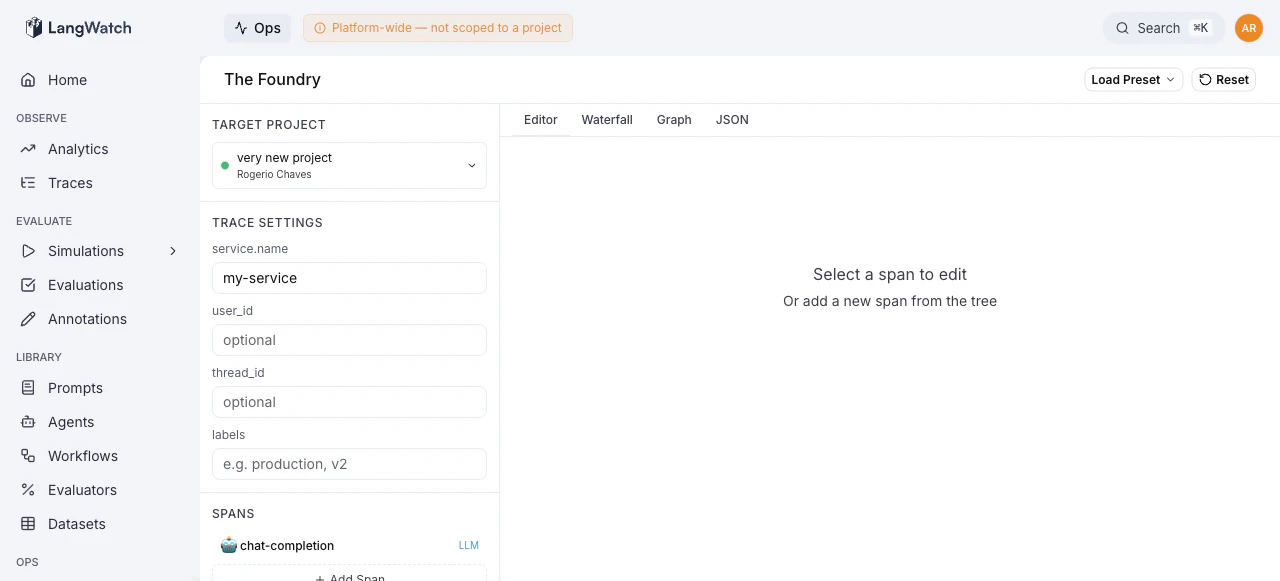
The Foundry is split into two panels: Left sidebar:- Target project selector
- Trace settings (service name, user ID, metadata)
- Span tree: hierarchical view of all spans
- Execution controls: send button, batch settings, execution log
- Editor: form-based span attribute editing
- Waterfall: timeline visualization
- Graph: DAG of span relationships
- JSON: raw trace configuration
Target Project
The project selector at the top of the sidebar determines where traces are sent. It lists all projects you have access to, grouped by organization. Selecting a project automatically uses its API key for execution.Span Tree
The span tree shows all spans in the trace as a nested hierarchy. Each span displays its type icon, name, and type badge. Supported span types:- LLM: language model calls with messages, model, temperature
- Agent: autonomous agent steps
- Tool: tool/function invocations
- RAG: retrieval-augmented generation with document contexts
- Chain: multi-step processing chains
- Prompt: prompt template rendering
- Guardrail: safety/validation checks
- Generic: any other operation
- Click a span to select it for editing
- Hover to reveal quick actions: reorder (up/down), duplicate, delete
- Use the “Add Span” button to add child spans under any parent
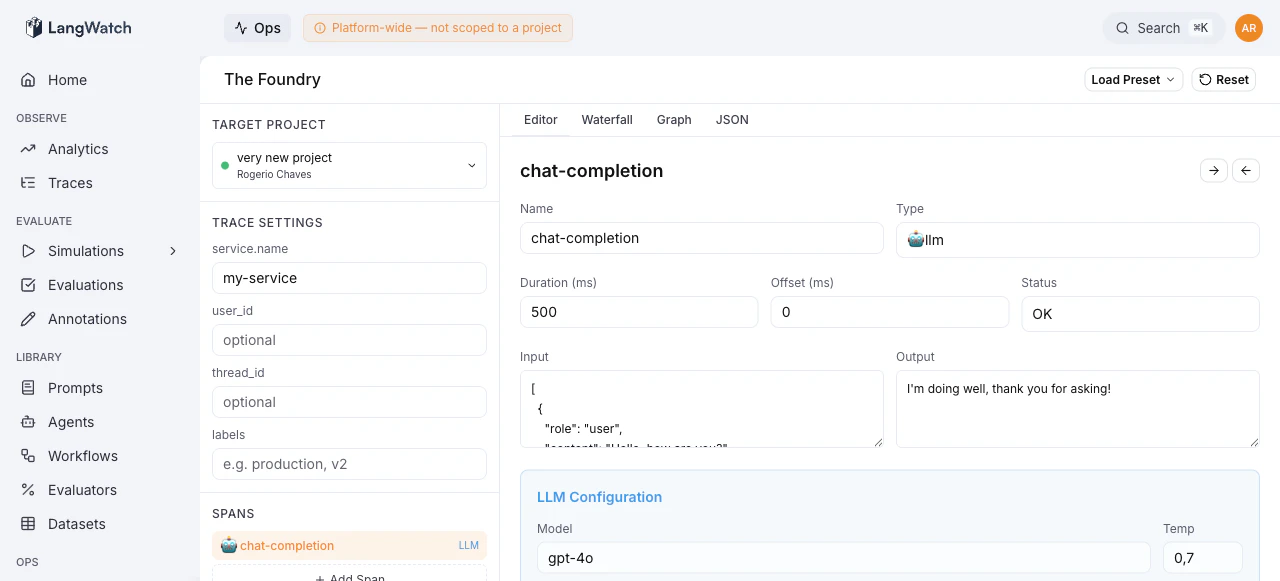
Span Editor
When a span is selected, the Editor tab shows a form with:- Name and Type: identity of the span
- Duration and Offset (ms), timing relative to the parent span
- Status: OK, Error, or Unset
- Exception: error message and stack trace (appears when status is Error)
- Input, Output: data flowing through the span (text or JSON)
- Type-specific fields: e.g., model and temperature for LLM spans, documents for RAG spans
- Custom Attributes: arbitrary key-value pairs
Waterfall View
A horizontal timeline showing when each span executed relative to the trace start. Bar width represents duration, position represents offset, and indentation shows parent-child hierarchy. Color coding matches span type.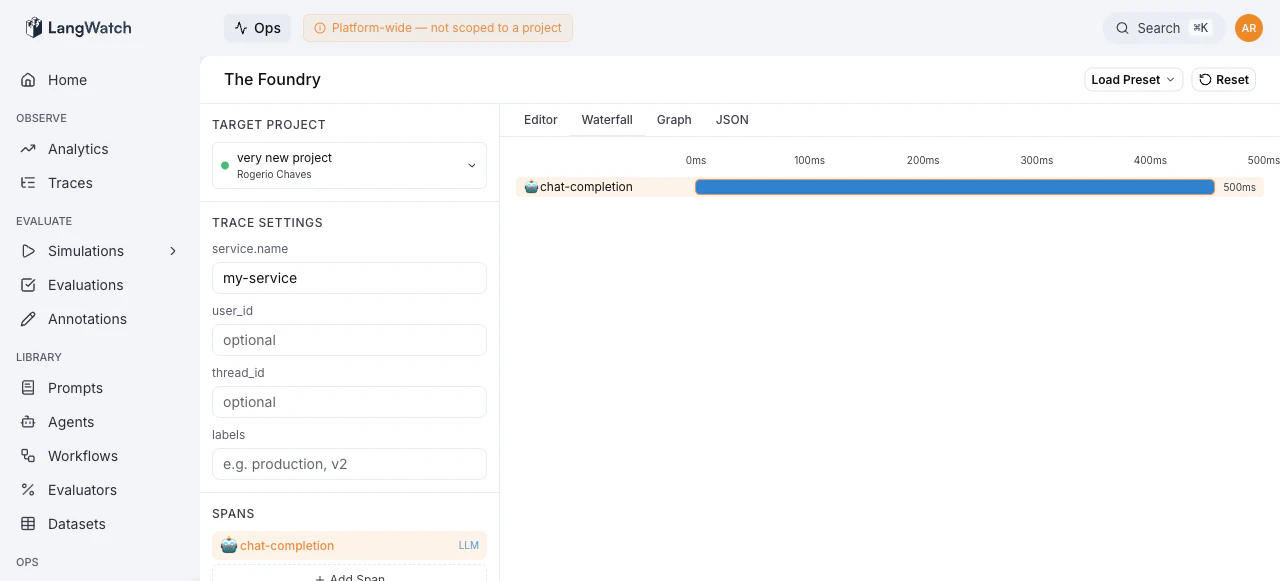
Graph View
A directed acyclic graph (DAG) showing span relationships as nodes and edges. Nodes display the span name, type, and duration. The graph auto-layouts to minimize overlap, with pan and zoom controls.JSON View
A Monaco code editor showing the full trace configuration as JSON. You can edit the JSON directly, changes are validated in real-time and reflected in the other views. Buttons for Format, Copy, and Reset are available in the header.Sending Traces
The execution controls at the bottom of the sidebar let you send the configured trace:- Run N times: batch count (1–100)
- Stagger (ms): delay between batch items to avoid overwhelming the system
- Send Traces: executes the batch
- Pending, success (with copyable trace ID), or error
- Click a successful entry to copy its trace ID for lookup in the main LangWatch UI
Presets
Use the preset picker in the header to save and load trace templates. Presets store the full span tree and trace settings, letting you quickly switch between common test scenarios.Common Workflows
Testing trace ingestion after a config change
- Select the target project
- Load a preset or build a simple trace (one LLM span)
- Click Send Traces
- Check the execution log for success
- Verify the trace appears in the LangWatch Messages view
Reproducing a customer issue
- Build a trace that matches the customer’s span structure
- Set appropriate input/output values and error states
- Send to a test project
- Use Deja View to verify the event stream matches
Load testing ingestion
- Build a representative trace
- Set Run N times to 100 with a stagger of 50ms
- Send and monitor the Ops Dashboard for throughput and error rates