

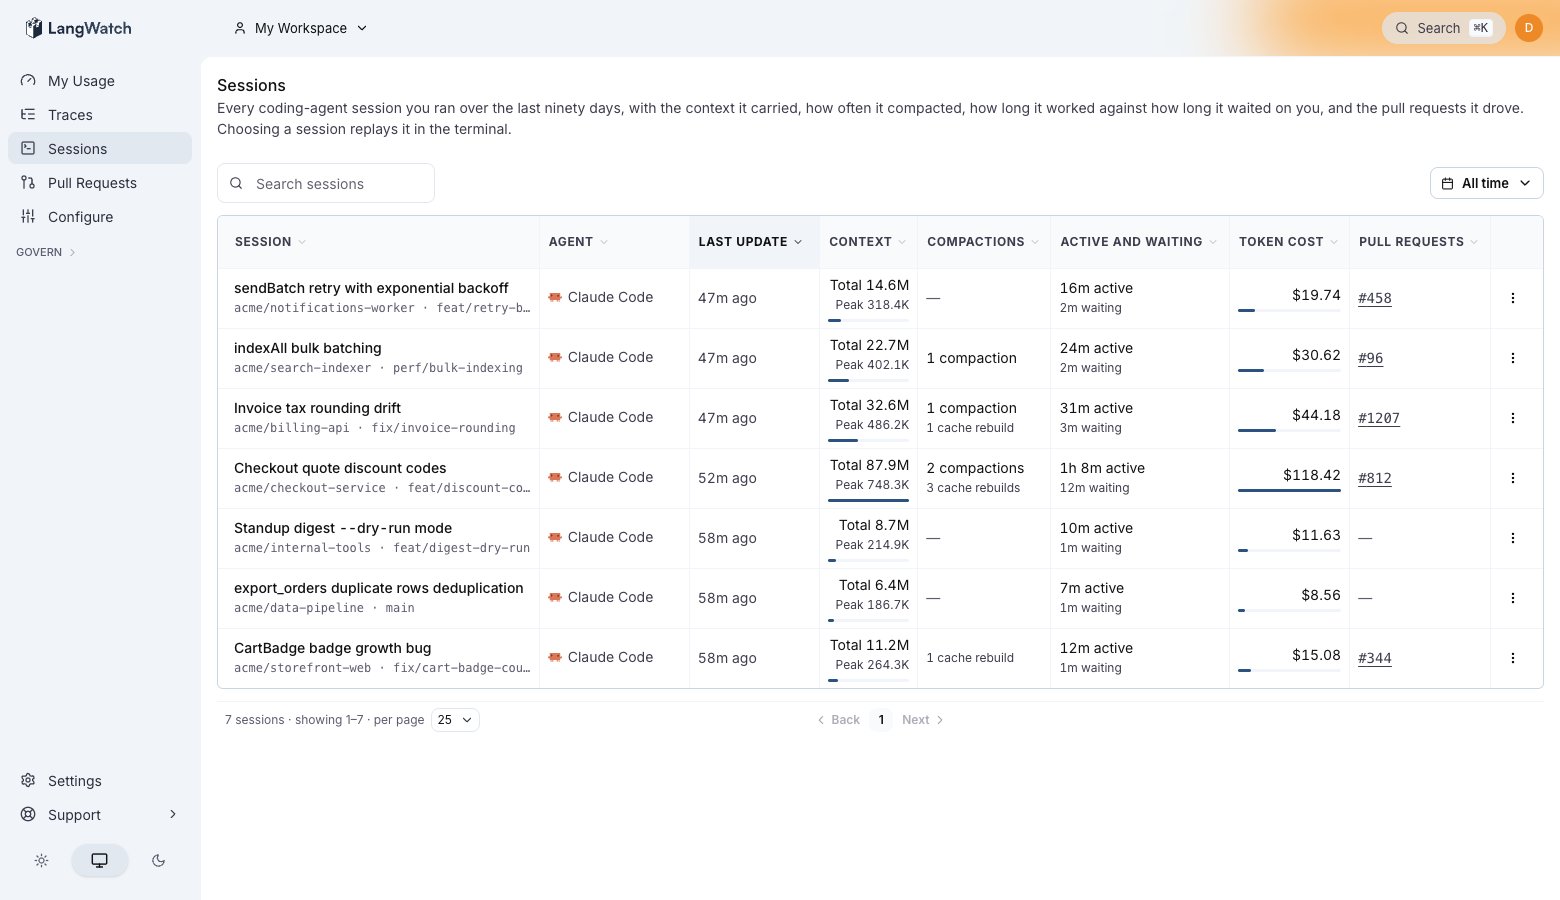
The sessions list. The Context and Compactions columns show which sessions ran heavy; the Pull requests column shows what each session shipped, and a dash means the branch has no pull request yet.
The sessions list
One row per session, over the last 90 days. Every column sorts; a third click on the same column resets the sort.
Search matches session titles. The period selector starts unset and reads All time, which means the whole 90-day window above rather than every session you ever ran. Pick a range when you look for a specific day.
Session detail
Click a row to open the session. The Usage tab opens on the totals: cost, model calls, tools run and files touched. Under them sit the signals worth knowing before you read any number, for example that the conversation was compacted, that an action was declined, or that the approval mode changed part way through. The Cache health section is where the money goes:
The detail also shows the biggest single rebuild: how many tokens one model call re-sent instead of reusing from cache.
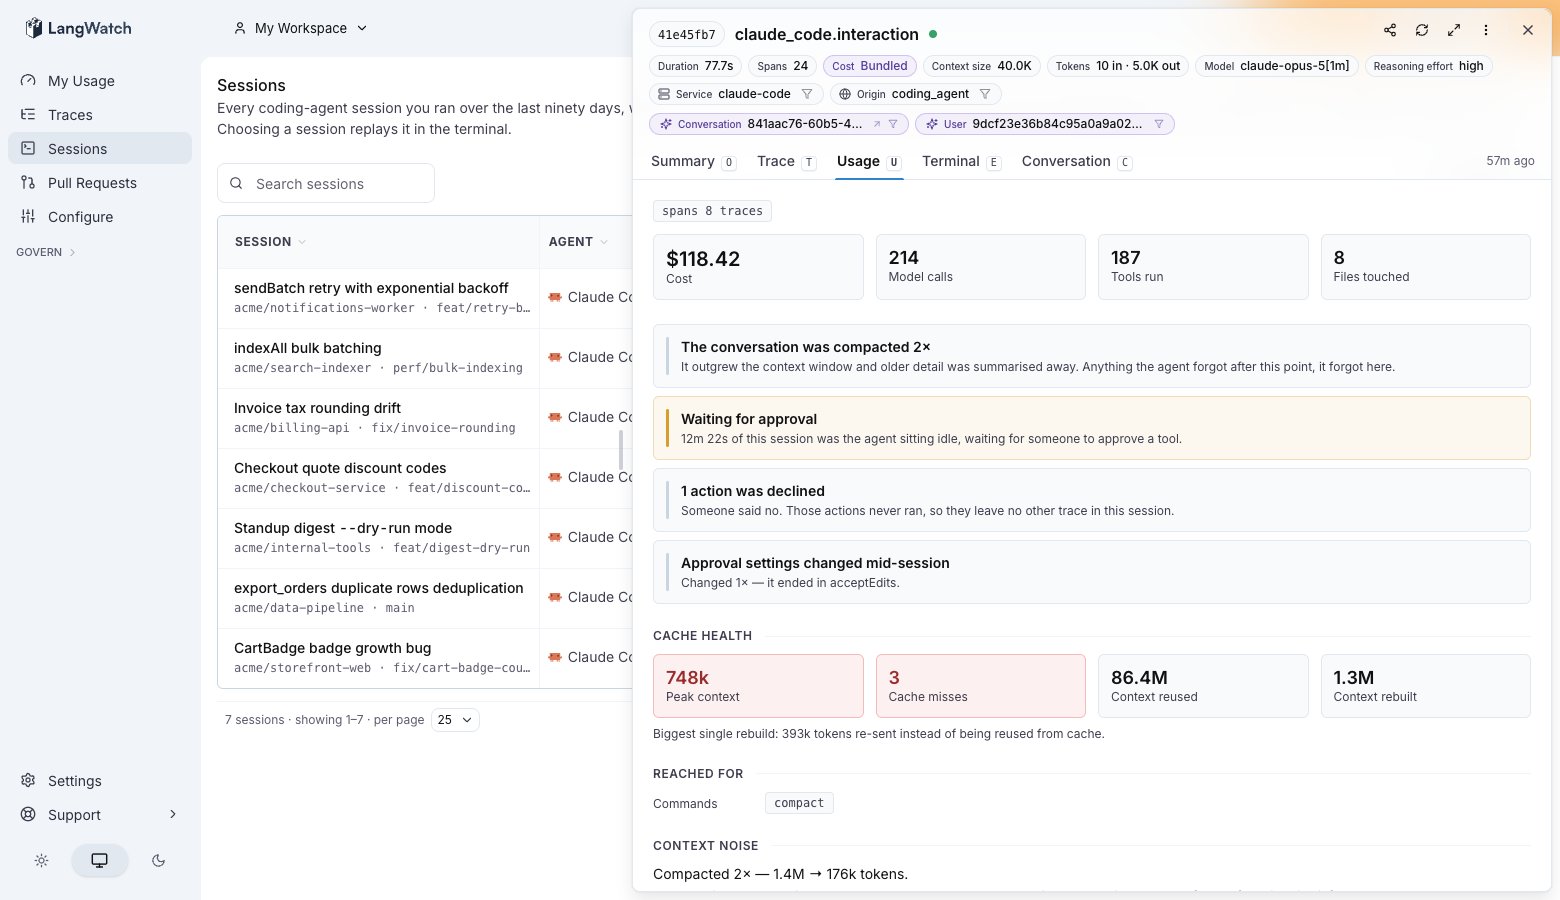
Session detail with the Cache health section. This session compacted twice, missed its cache three times, and re-sent 393k tokens on its biggest rebuild.
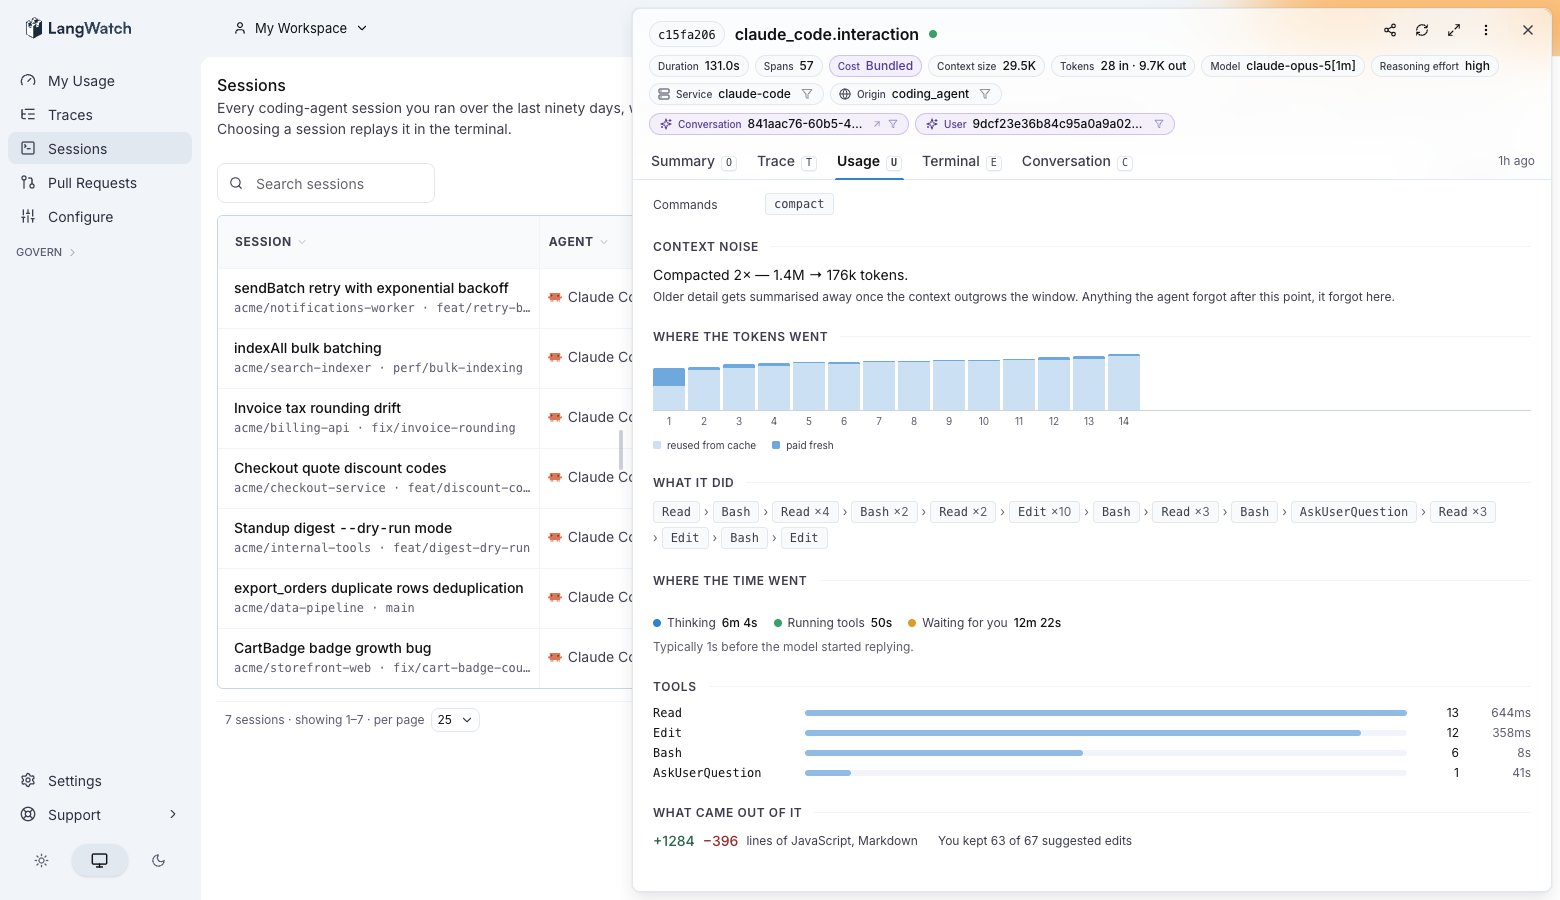
The token composition of one session. Call 1 pays for the whole context; every call after it reads most of the context back from cache.
Terminal replay
The Terminal tab replays the session moment by moment, the way it looked in the terminal: your prompts, the agent’s replies, every tool run with its output, and file changes as syntax-highlighted diffs.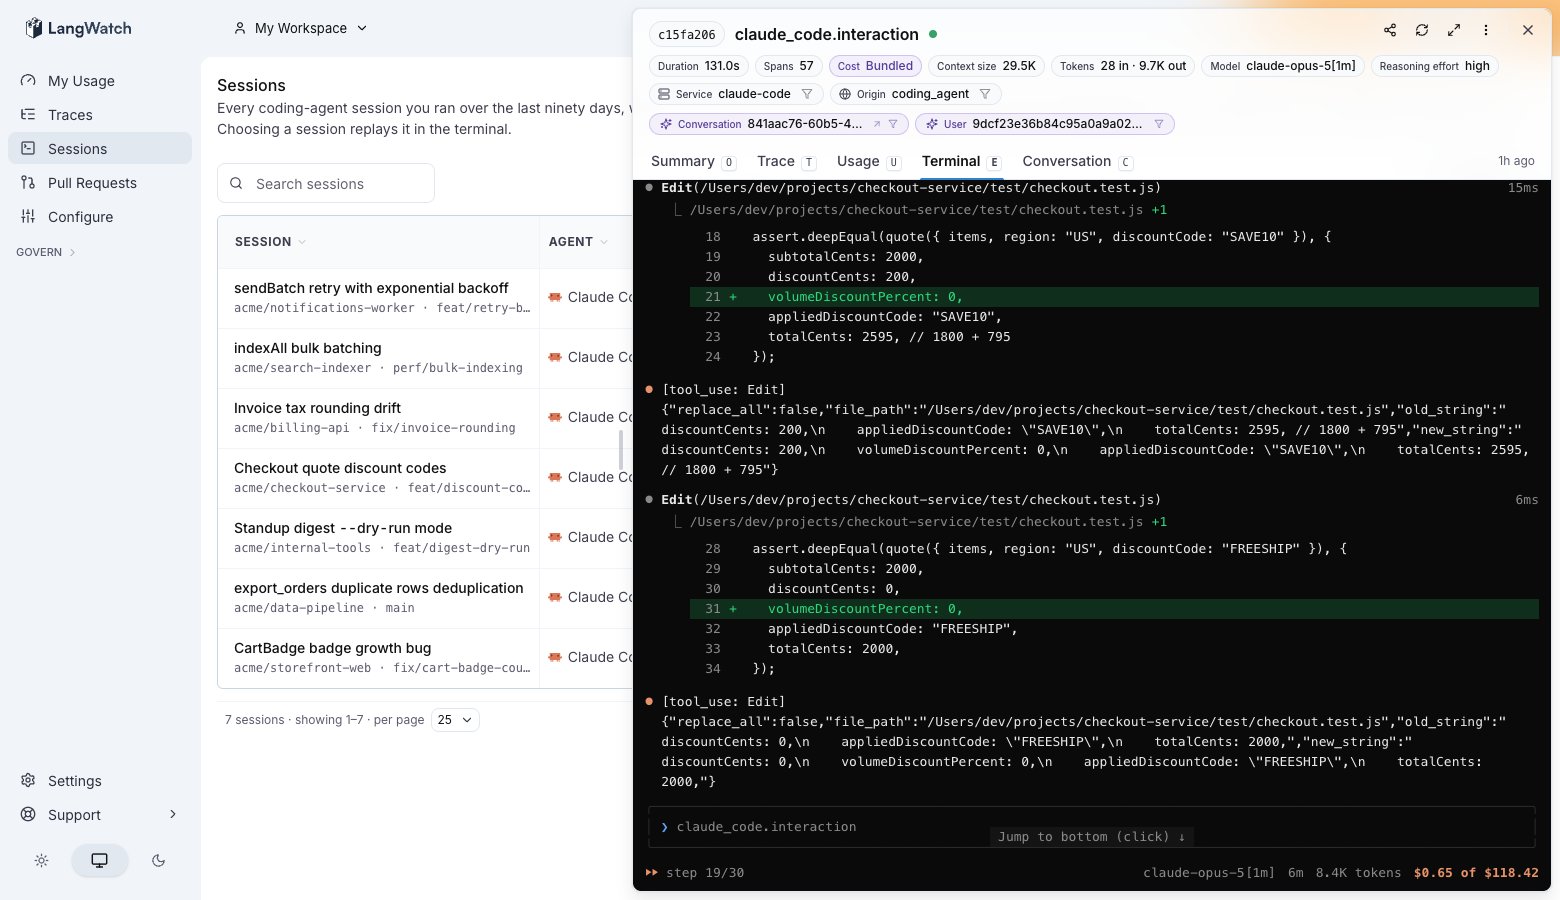
The terminal replay. Each tool run carries the time it took, and a file edit renders as the diff the agent applied.
- A notification injected into the session by tooling renders as a note, never as something you said.
- A tool call the agent was denied stays in the replay, marked as denied.
Read sessions from outside the UI
The same data answers over the command line and the API:GET /api/coding-agent/sessions/{sessionId}/events returns the per-call rows. See the coding agents API reference.
Also check: Usage analytics for the rollups across sessions, and Privacy for who can open a session’s content.