Automatic capture
If your instrumentation already emits any of the signals below, TTFT shows up without any extra code:| Source | Signal |
|---|---|
| Vercel AI SDK | ai.response.msToFirstChunk span attribute |
| OpenLLMetry / OpenLIT instrumentors | llm.content.completion.chunk / First Token Stream Event span events |
| OTel GenAI semconv emitters | gen_ai.server.time_to_first_token span attribute (milliseconds) |
| LangWatch SDKs | timestamps.first_token_at on the span (see below) |
If you stream through the Vercel AI SDK with
experimental_telemetry enabled, TTFT is captured automatically from ai.response.msToFirstChunk, nothing to do.Setting TTFT manually
If you handle streaming yourself, measure the time between starting the call and the first chunk, then set thegen_ai.server.time_to_first_token attribute (duration in milliseconds) on your LLM span:
first_token_at - started_at, falling back to the span’s own start time when started_at isn’t provided.
REST API
If you send spans through the REST API instead of the SDK, setfirst_token_at (epoch milliseconds) in the span’s timestamps object:
Where TTFT shows up
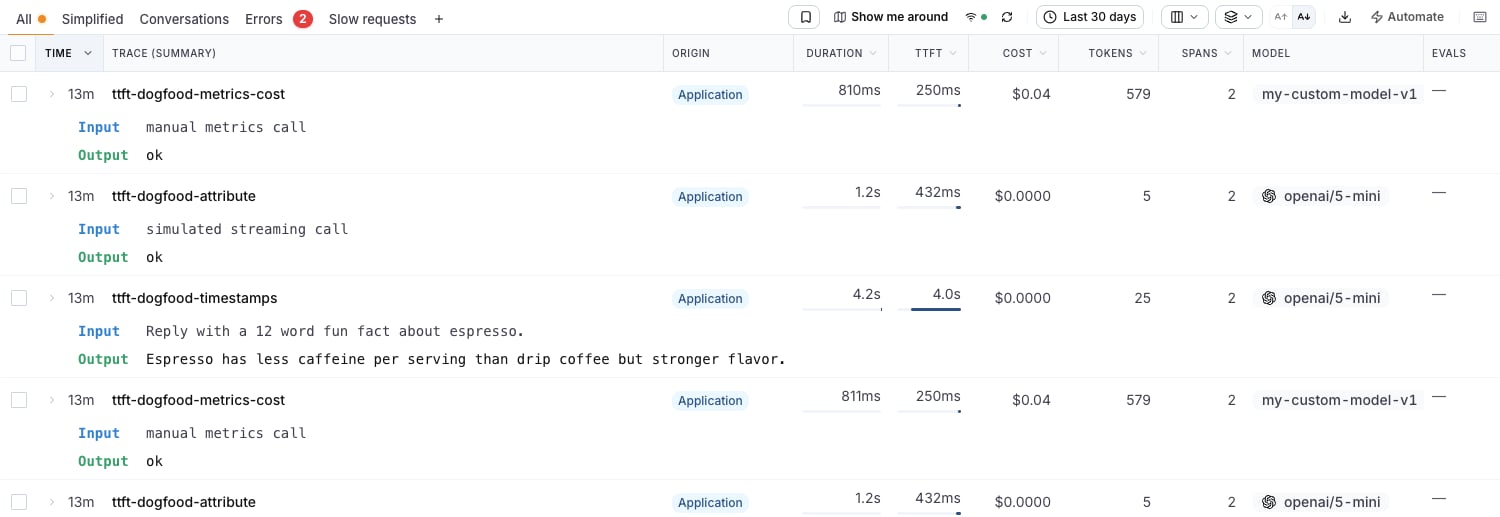
Traces table column
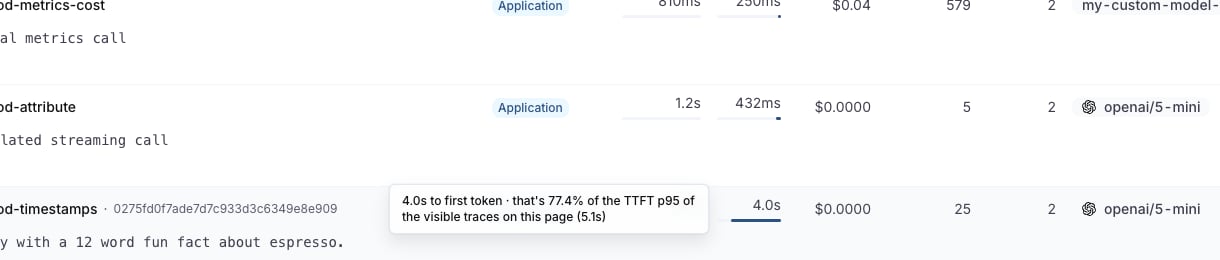
On the Traces page, open the columns picker (the columns icon in the toolbar) and enable TTFT. The column behaves like the Duration column: each cell shows the value plus an inline bar scaled to the 95th percentile of the visible page, so one slow outlier doesn’t flatten every other row. Rows at or above the page’s TTFT p95 render a full red bar.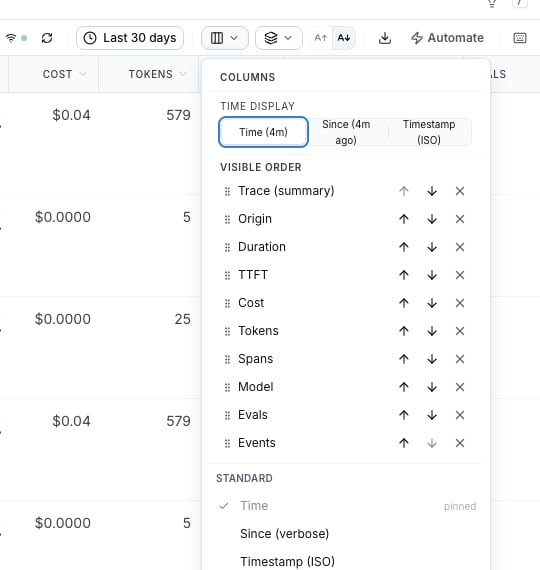
Trace details
The trace drawer shows a TTFT pill in the header next to duration, cost, and tokens: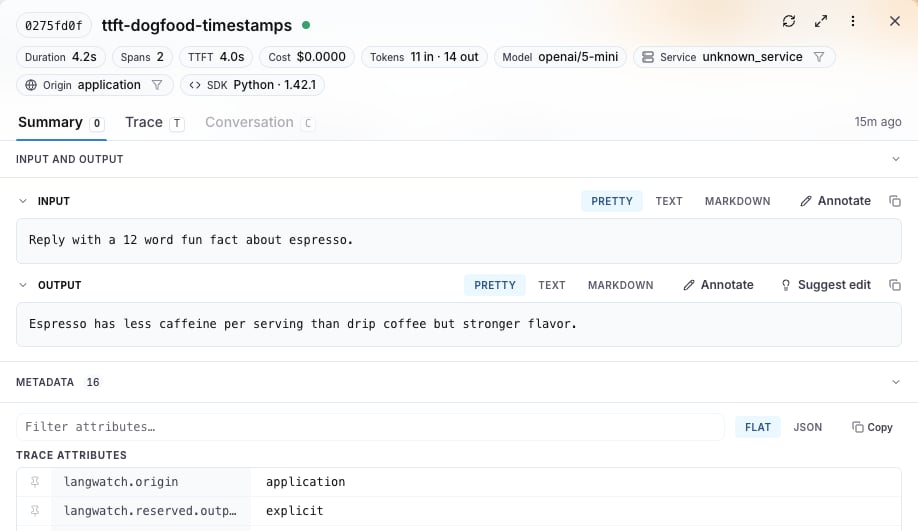
Analytics
In Analytics > LLM Metrics you get time-to-first-token graphs with the usual aggregations (median, p90, p95, p99), and you can build custom graphs on the same metric for dashboards and alerting.Troubleshooting
- TTFT shows ”—” in the table: the trace has no LLM span reporting any of the signals above. For non-streaming calls this is expected, there is no “first token” moment distinct from the response itself.
- Value looks wrong by orders of magnitude: check the units.
gen_ai.server.time_to_first_tokenis a duration in milliseconds;first_token_atinsidelangwatch.timestampsis an epoch timestamp in milliseconds.