

Off-topic reply that flags replies that drift away from the customer’s question. The same steps apply to any evaluator, for example PII detection or jailbreak detection.
Prerequisites
- Your application sends traces to LangWatch. See the integration quick start.
- For evaluators that call a model, a model provider configured in Settings.
Create a monitor
1
Pick an evaluator
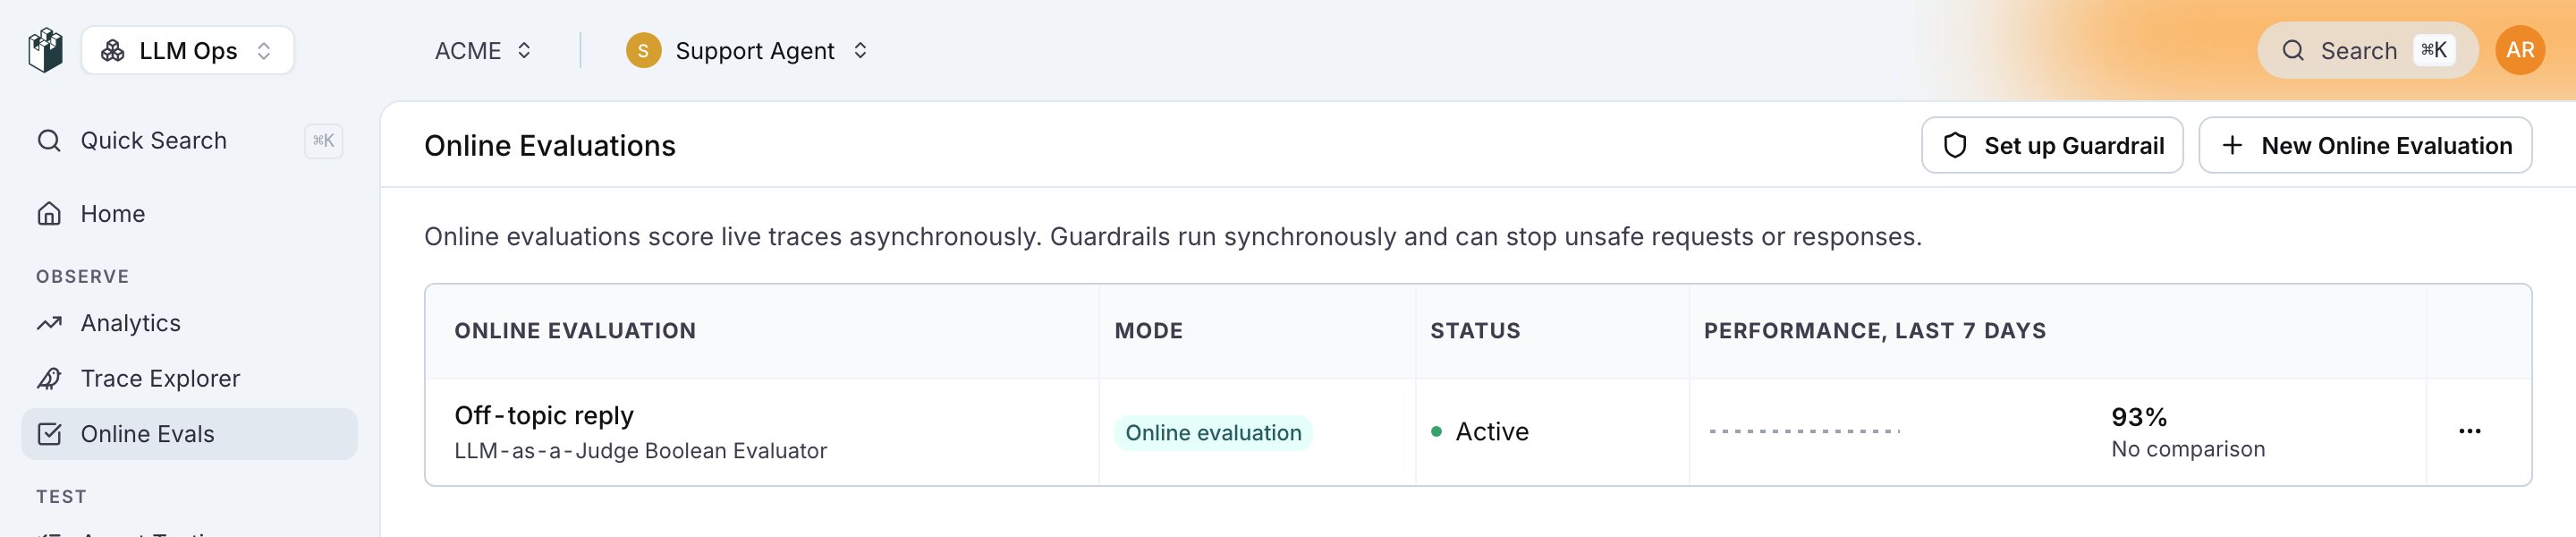
Open Online Evaluations and click New Online Evaluation. In the drawer, pick the Evaluation Level, then click Select Evaluator. Pick one of your saved evaluators, or click New Evaluator to open Choose Evaluator Category: Expected Answer, LLM as Judge, RAG Quality, Quality Aspects and Safety, plus Custom (Code) for a Python evaluator and Custom (from Workflow) for a workflow.Pick LLM as Judge, then LLM-as-a-Judge Boolean Evaluator.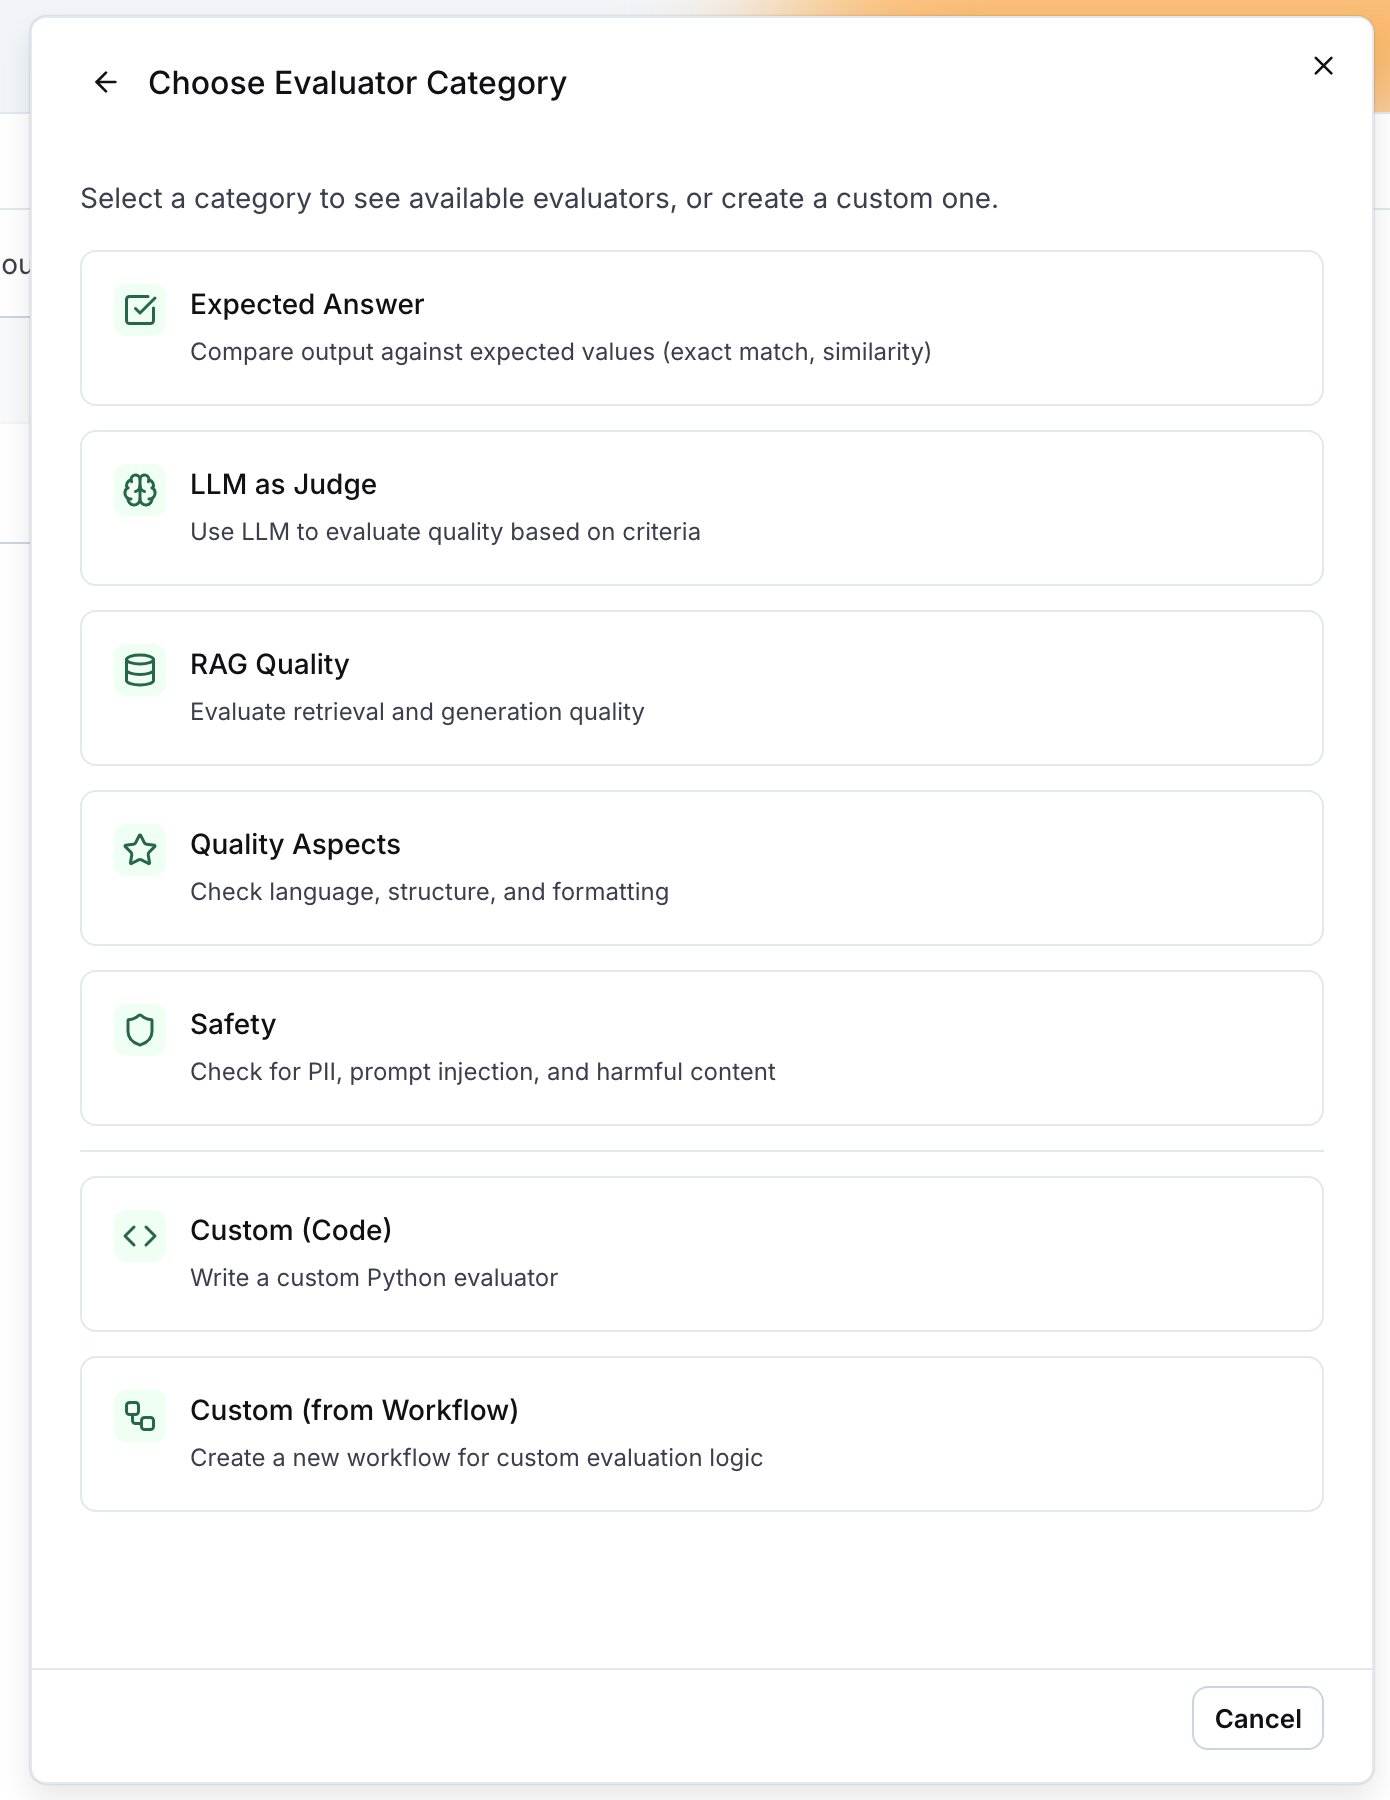
2
Configure the evaluator
Name the evaluator, pick the judge model and write the criteria in Prompt, for example: the reply passes only when it answers the customer’s question and stays on the topic of the customer’s order. A built-in evaluator such as PII Detection shows its own options here instead, for example the entity types to flag.Under Variables, map the evaluator’s fields to the trace.
input maps to the trace input and output to the trace output by default. Click Create Evaluator.3
Set the level, the filter and the sampling
Back in the New Online Evaluation drawer, the evaluator is selected.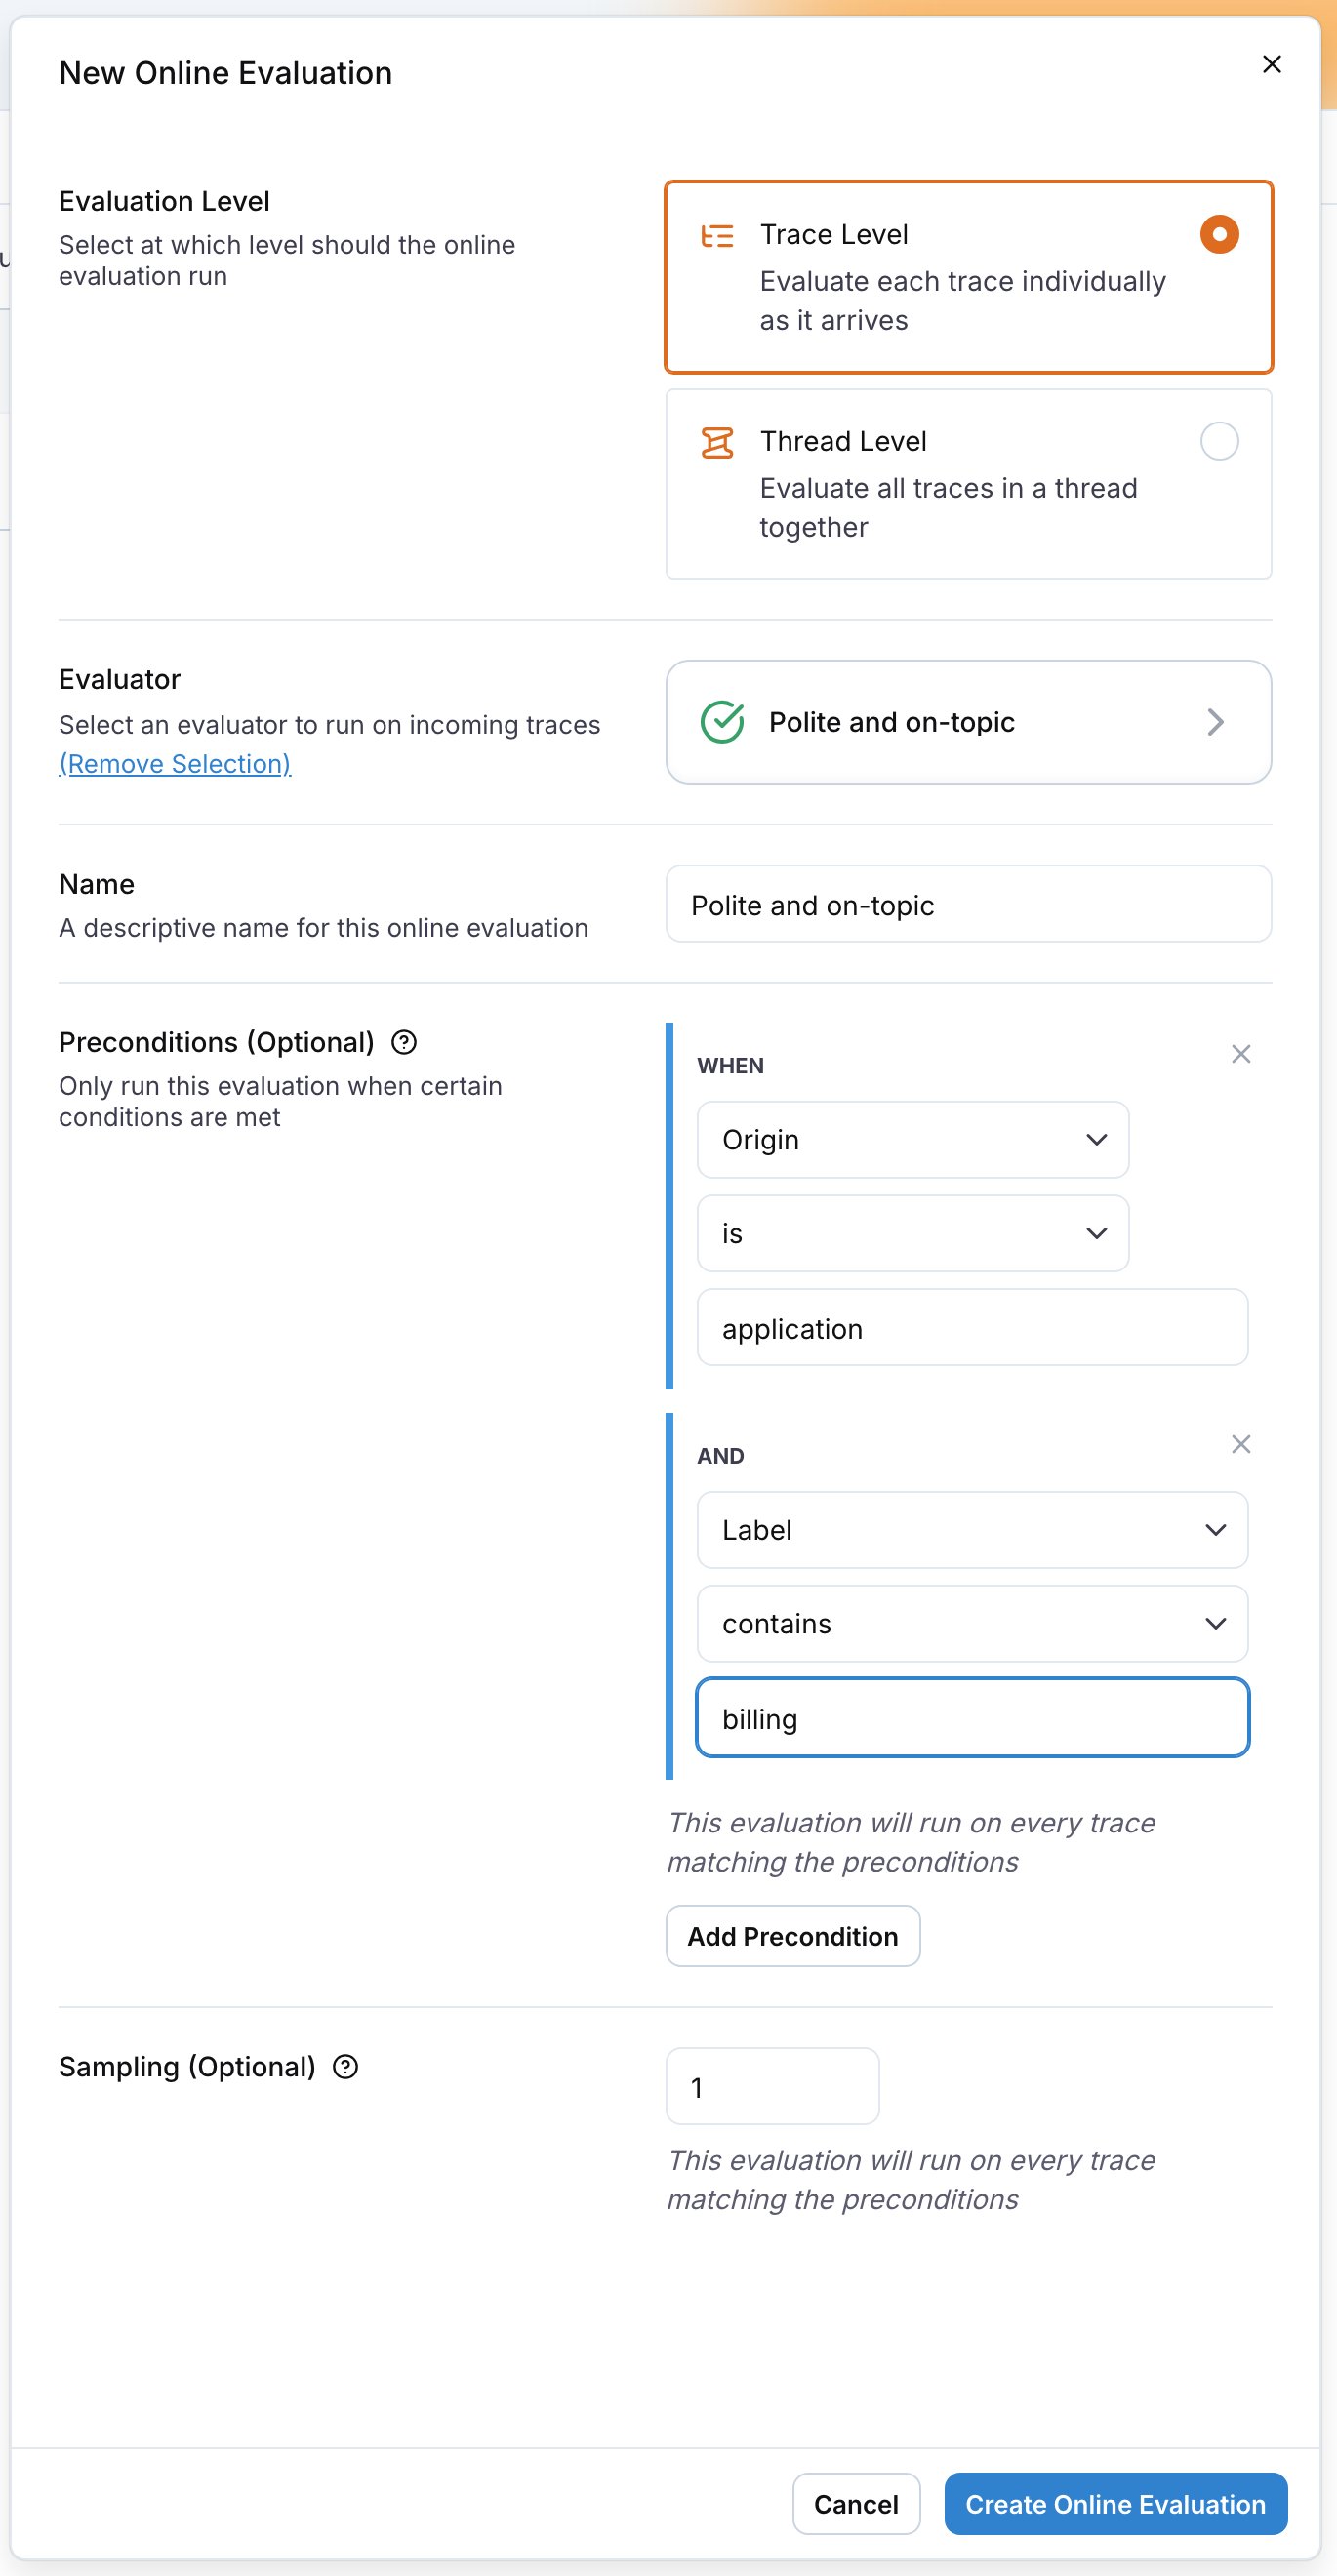
Click Create Online Evaluation. The monitor is active as soon as it is created.
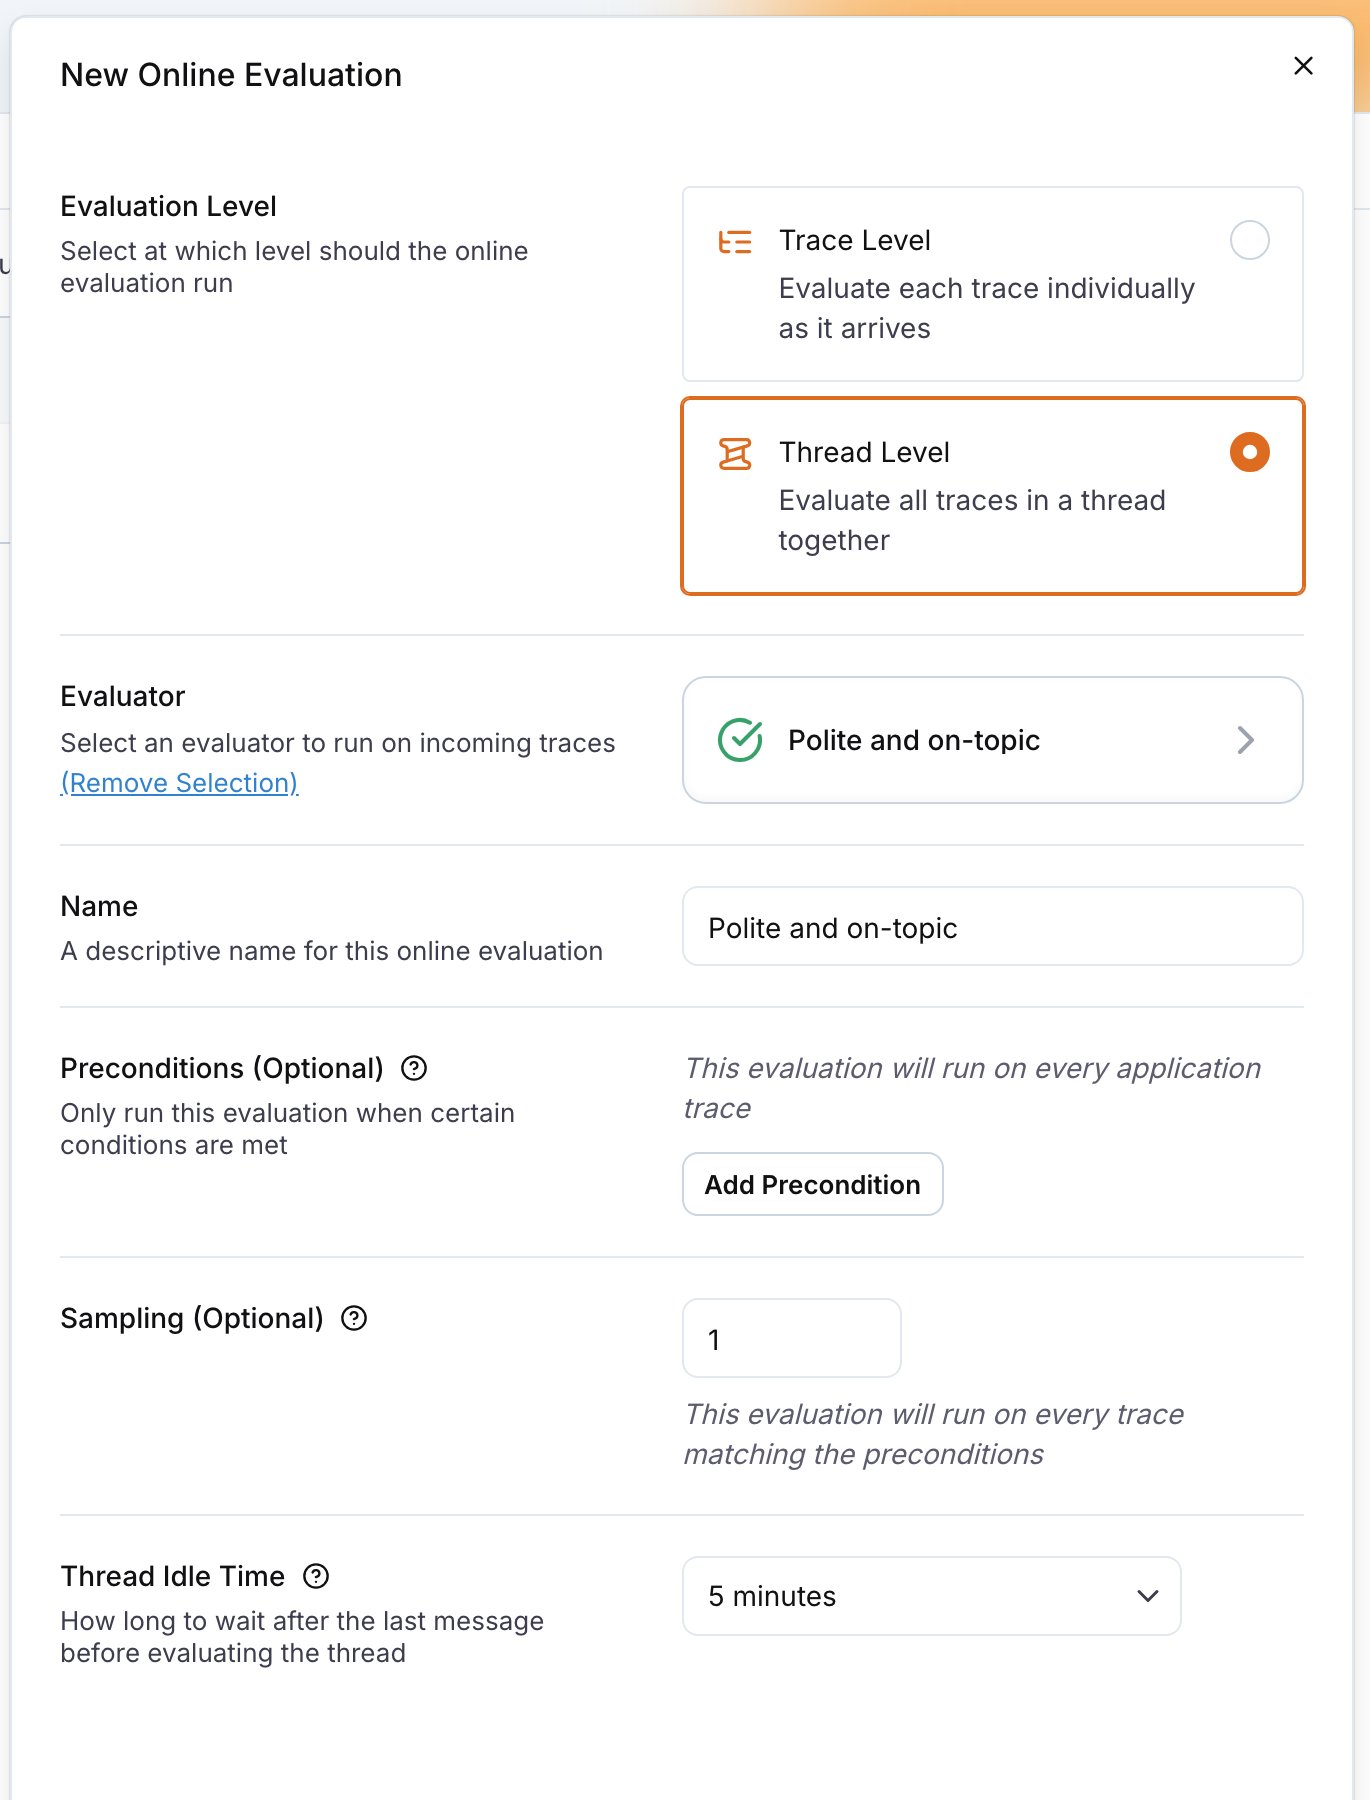
Evaluate whole threads
A trace is one request and response. A thread is the whole conversation, grouped by thethread_id you send in the trace metadata. Some checks only make sense on the conversation: whether the user’s problem was resolved, whether the assistant stayed consistent across turns, whether the tone drifted.
Pick Thread Level in the drawer. The evaluator’s variables now map to the Current Thread source, whose traces field holds every trace in the thread with its input and output.
Read the results
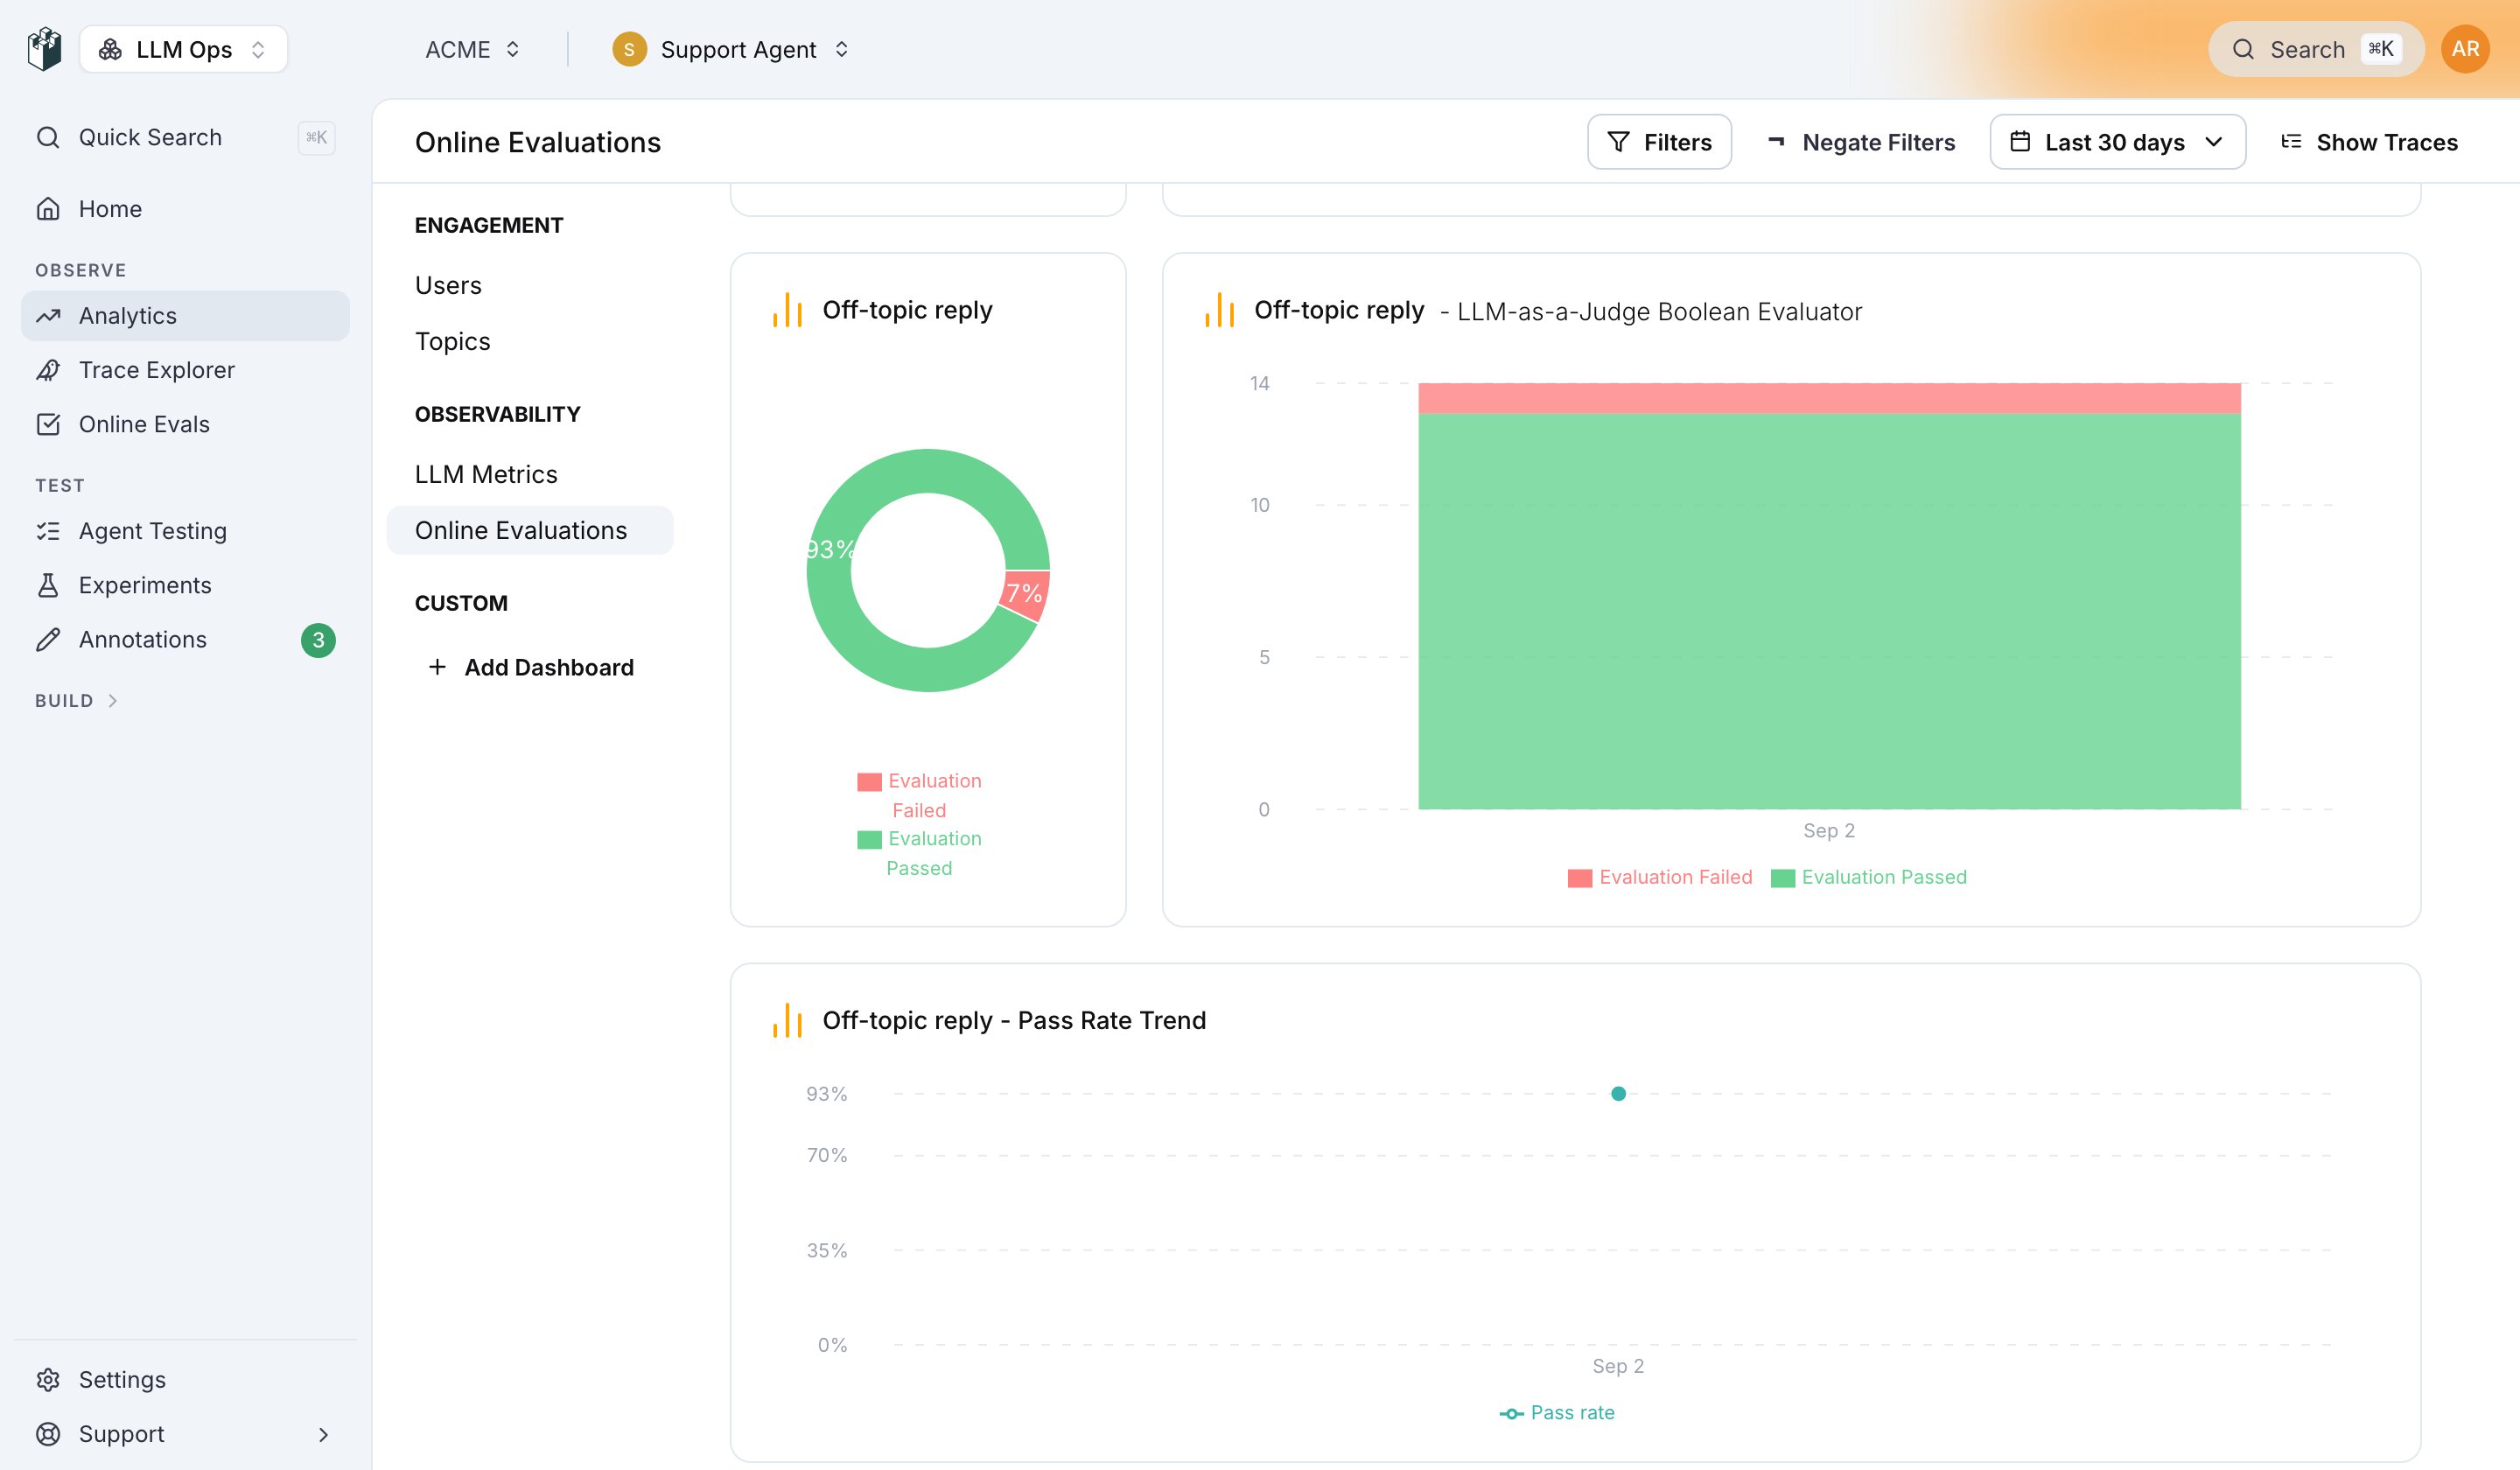
On a trace, the Evals section of the trace drawer lists each monitor that ran with its verdict, score and the reason it returned, and the header shows an Eval chip per monitor. The trace table has an Evals column too, so you can filter and sort the Trace Explorer by the monitor’s result.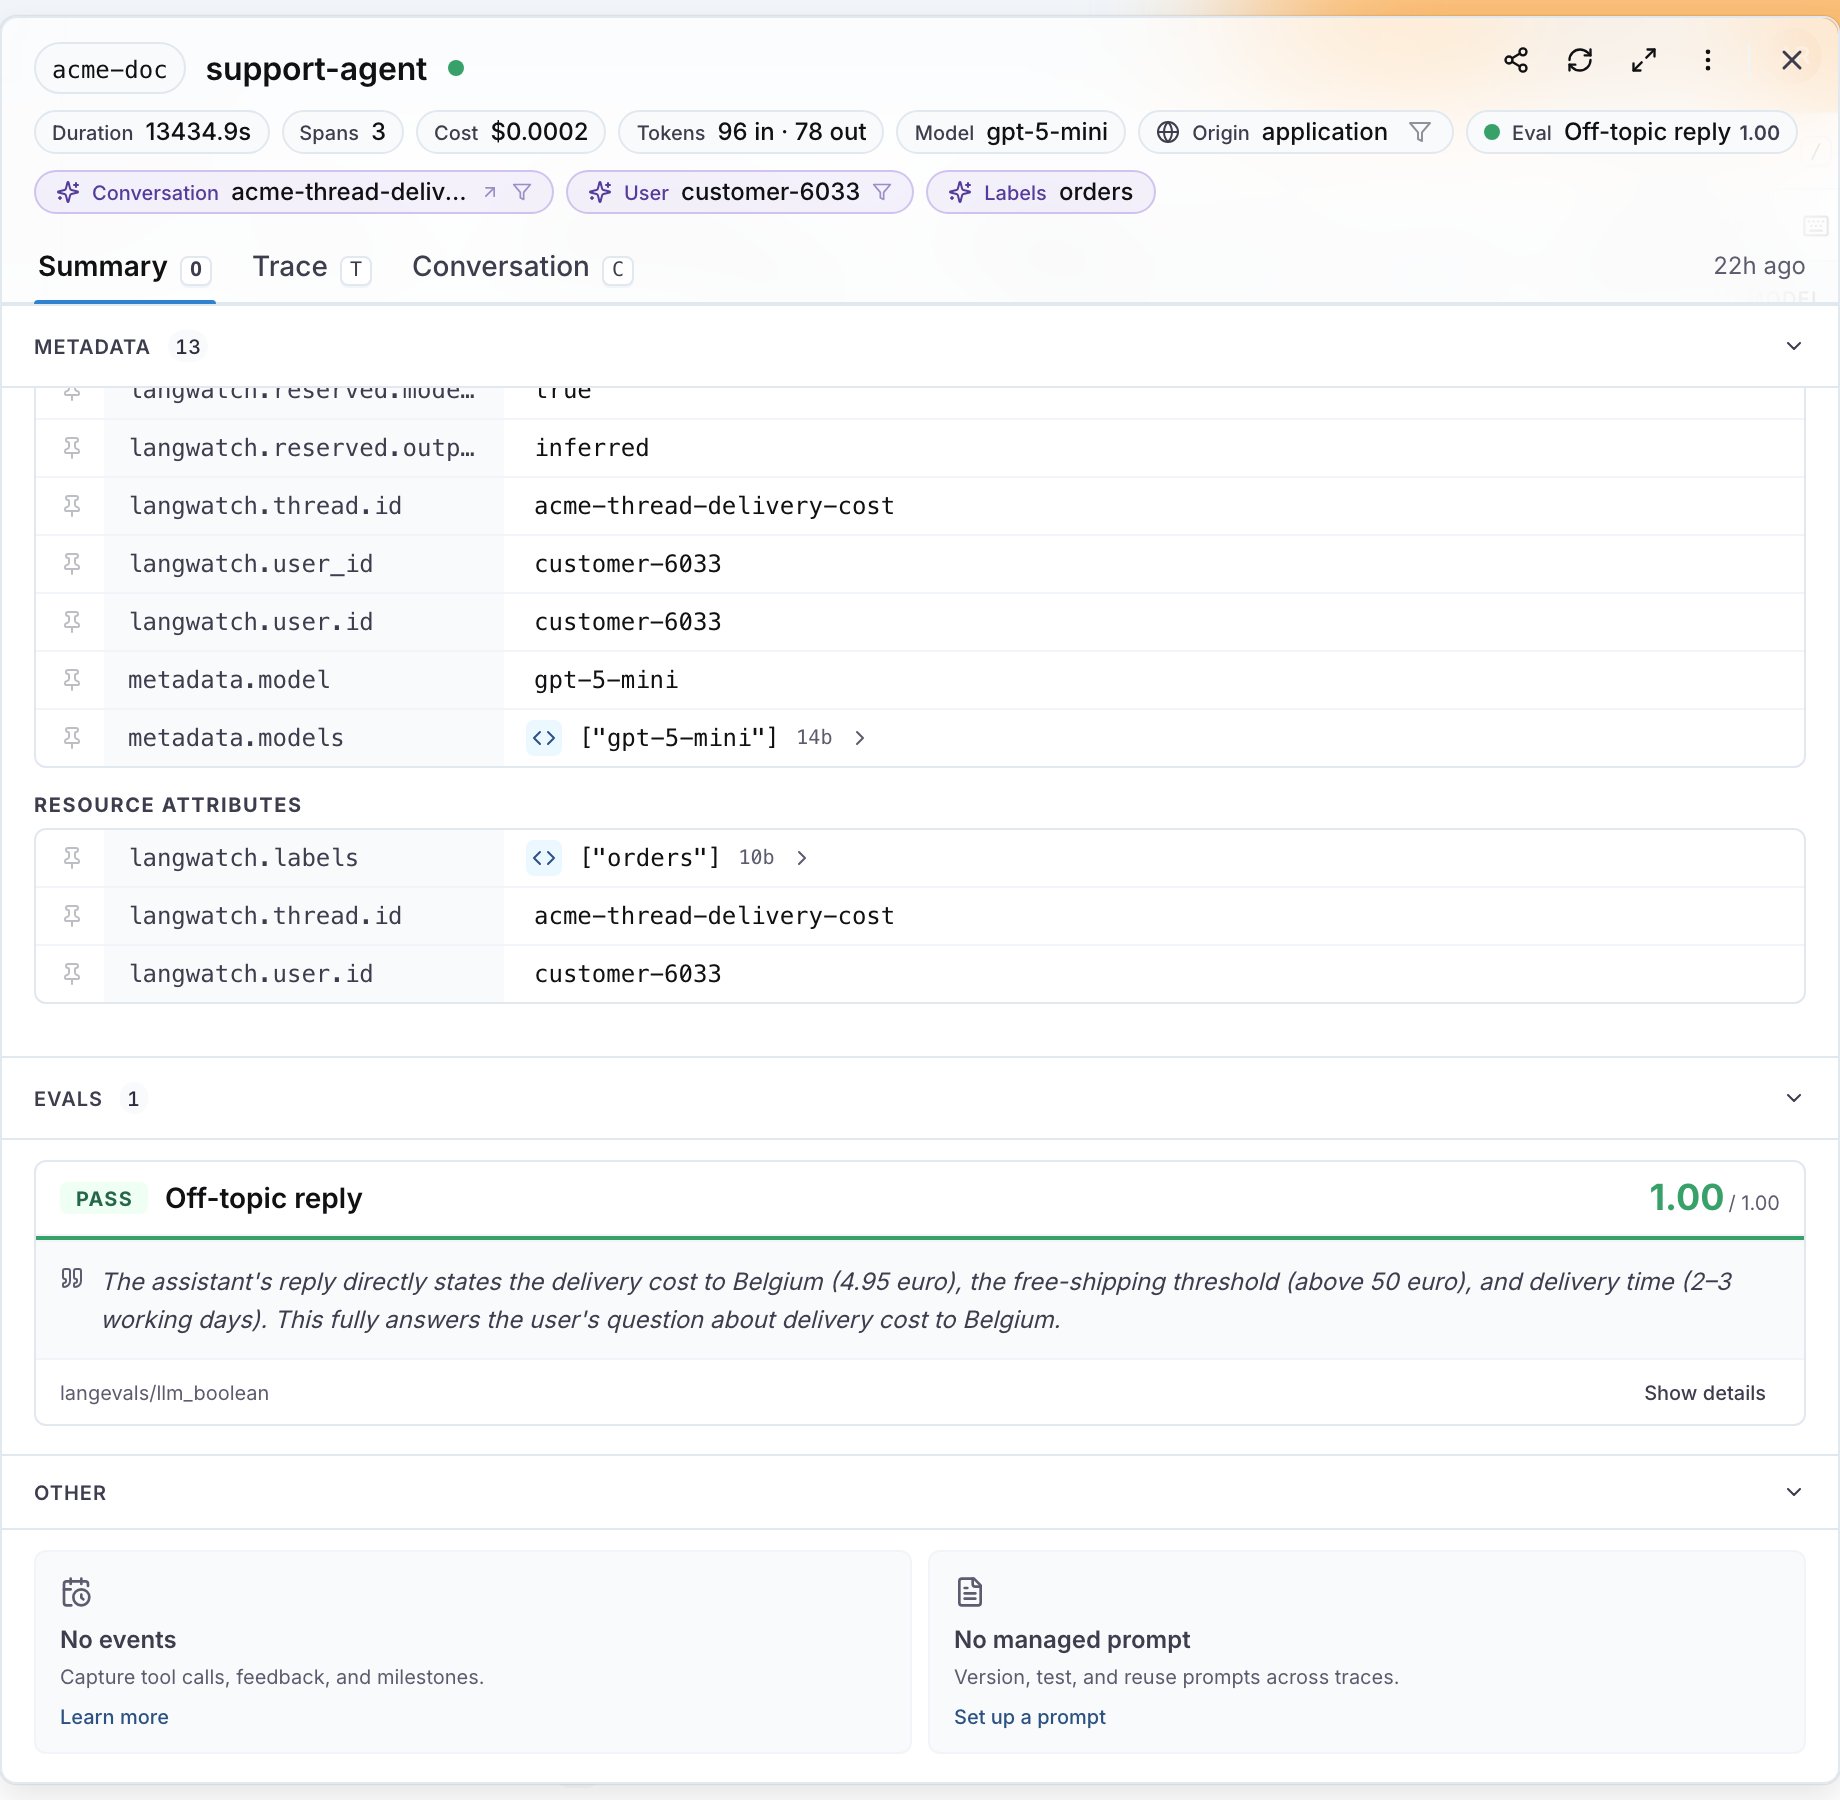
Pause, edit and remove a monitor
The row menu on the list has Edit, Disable (or Enable on a paused monitor), Replicate to another project and Delete. A paused monitor keeps its history and stops scoring new traces.Act on the results
- To be notified when a monitor fails, create an automation on the evaluation result. See Automations.
- To collect the flagged traces into a dataset, add an automation with the Add To Dataset action. See Build datasets from traces.
- To block a request before the response reaches the user, run the evaluator as a guardrail from your code instead of as a monitor. See Guardrails.