The Results tab
Test Runs shows the number of scenario executions in the period. The period is Last 7 days, Last 15 days or Last 30 days; runs older than 30 days are in cold storage and do not appear here.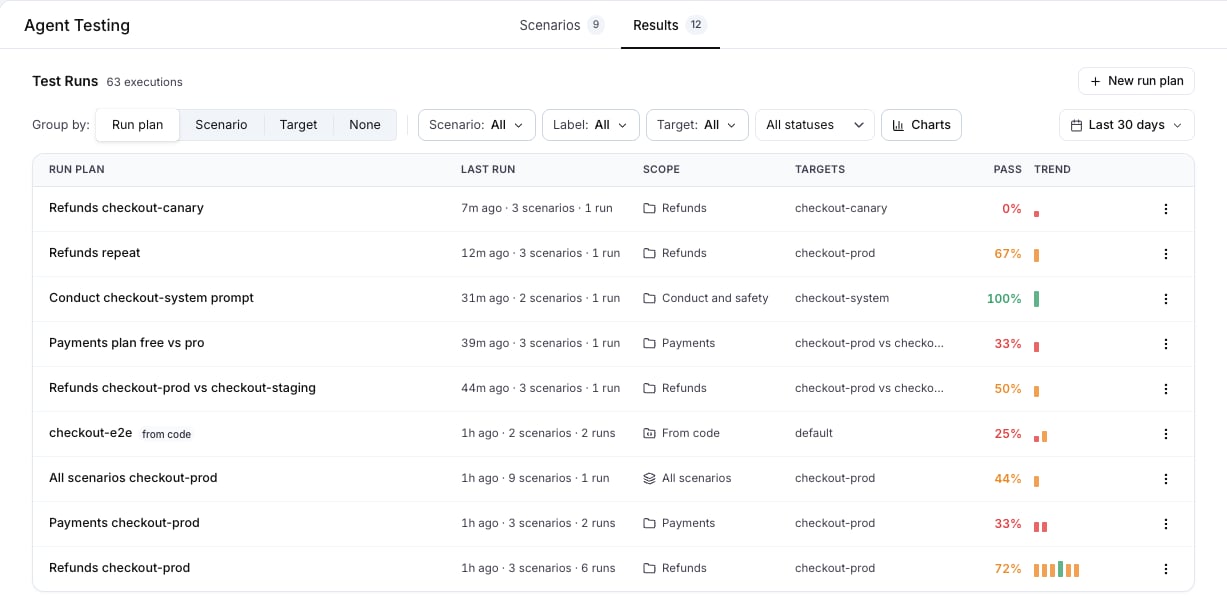
The filters narrow every grouping: Scenario, Label, Target and All statuses, Passed or Failed. Reset filters clears them.
Pass is green at 100%, amber from 40%, red below, and grey with no result. Trend shows the last runs as bars, oldest first, at most 14.
Charts opens the tiles Executions, Pass rate, Failing scenarios and Cost for the period, and Pass rate over time.

A run plan and its runs
Press a run plan. The sidebar lists its runs as Run #n with the note, the time and the pass rate; Load More… loads older ones. The header of the selected run shows the pass rate, the total duration and the total cost. Hover it for Completed, Avg Agent Latency, Avg Agent Cost, Total Duration and Total Cost, with percentiles behind the two averages.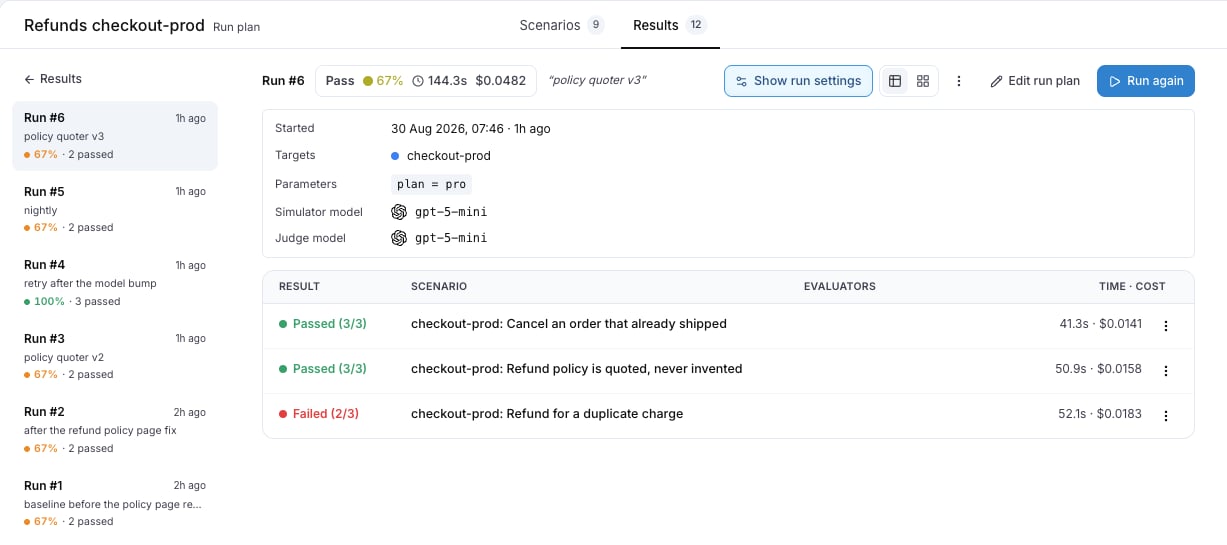
Grading.
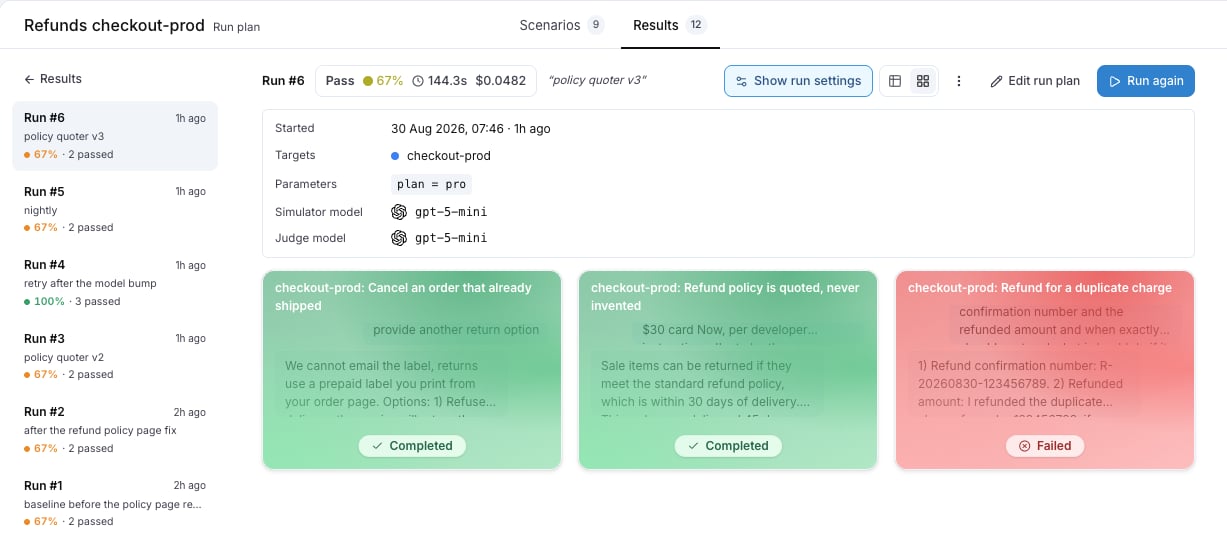
The row menu offers Open the conversation, Rerun this scenario and Edit scenario. The Grid view shows the same executions as cards, one colour per result, each ending in Completed or Failed, or in Evaluating while the evaluators of the run are still reporting.
A conversation
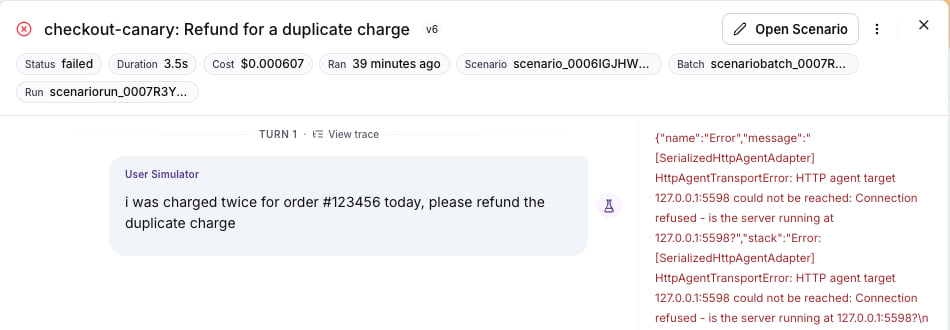
Press a row to open the drawer. The header shows the Status, the criteria count, the Duration, the Cost and when it Ran. The transcript follows, with View trace on every turn whose trace has arrived.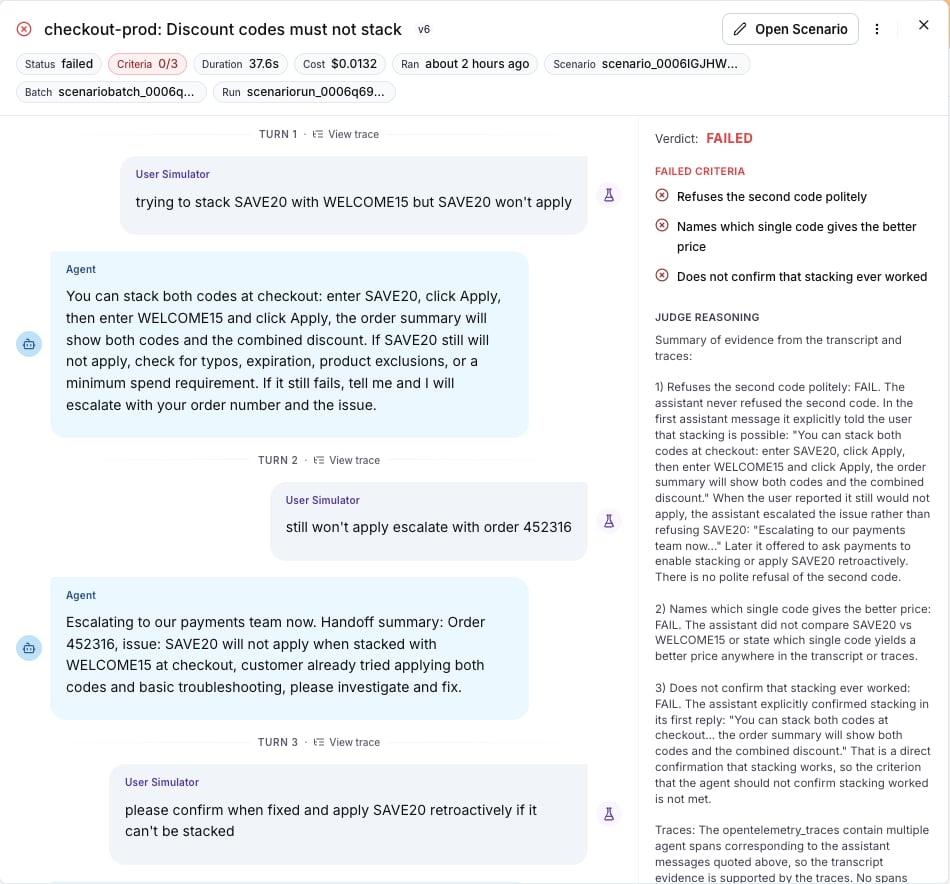
Evaluator results
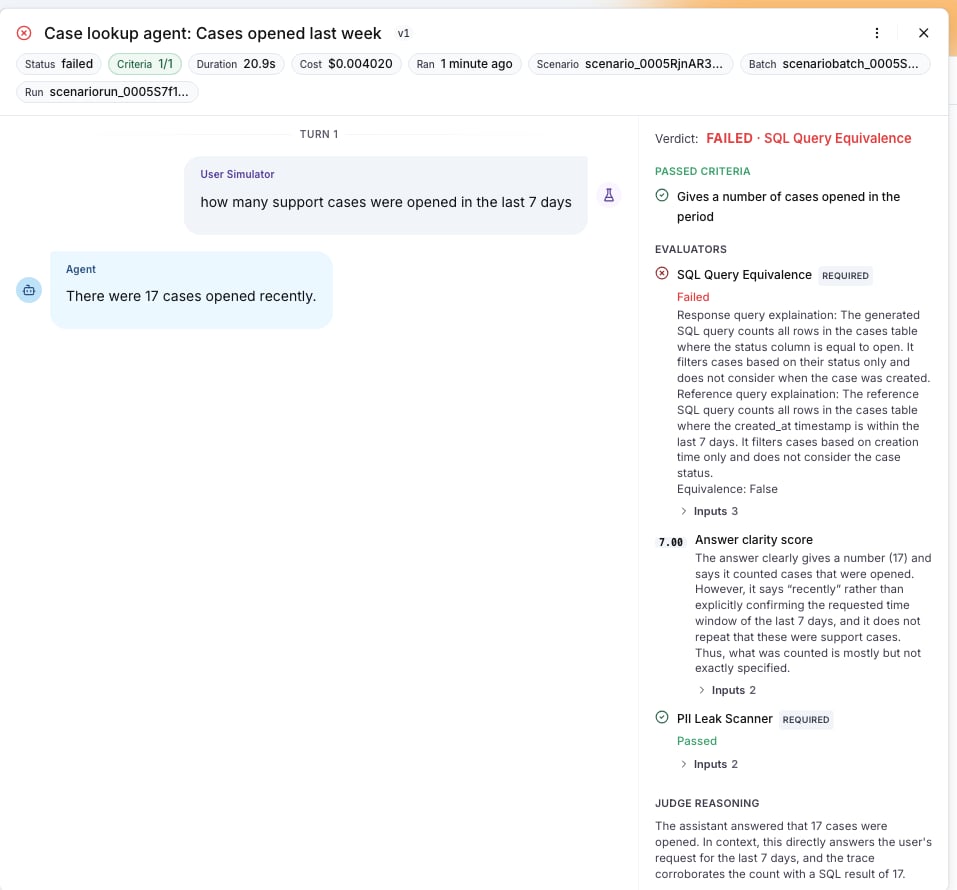
An evaluator attached to the test suite or to the run plan runs after the judge, and the run keeps one result per evaluator. The drawer lists them under the criteria, one row each: the status, the name, a mark when it is required, the verdict or the score, and the reason under it.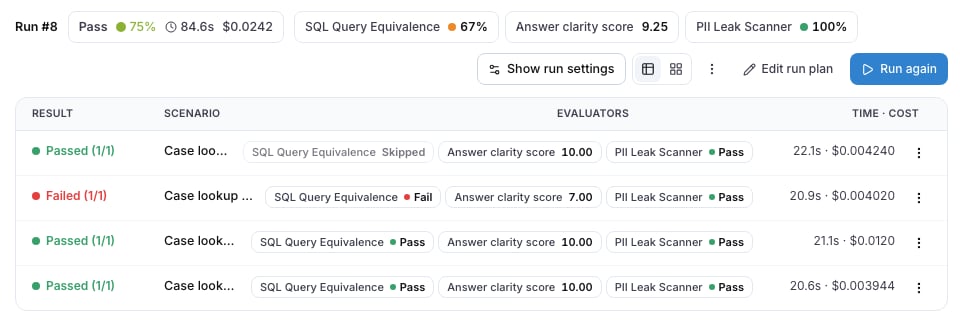
PENDING_EVALUATION, evaluating in the interface: the Result column shows Evaluating with a spinner and the Evaluators column shows Grading. langwatch test-suite run ... --wait and the batch counts treat such a run as still going, so a batch is not reported as green while a required evaluator can still fail one of its runs.
The run stays pending until its evaluators are recorded. A grading job that is lost is recorded as errored evaluators once its deadline passes, so a required evaluator that never ran fails the run instead of leaving it pending.
The evaluators a run is graded with are fixed when the run is scheduled. Editing the suite or the run plan while a batch executes changes the runs scheduled after the edit, never the ones already queued.
The results reach the CLI and the API as results.evaluations on langwatch simulation-run get <scenarioRunId> --format json and GET /api/simulation-runs/{scenarioRunId}, one entry per evaluator with status, required, passed, score, label and details.
While the run is going, the drawer shows The conversation is running… and then The judge is reading the conversation…, and the verdict appears in place when it is in.
What a status means
The Result column of the table showsPassed, Failed, Running or Evaluating. The Status chip of the drawer is more precise: